Смотри обучающее видео по маркету на YouTube
Как купить торгового робота или индикатор
Запусти робота на
виртуальном хостинге
виртуальном хостинге
Протестируй индикатор/робота перед покупкой
Хочешь зарабатывать в Маркете?
Как подать продукт, чтобы его покупали
Технические индикаторы для MetaTrader 5 - 4

This indicator paints any Inside Bar found on the attached chart in a Dark Gray Colour with Black Borders and Wicks. If there are multiple consecutive Inside Bars, then they would also be successively painted Dark Grey with Black Borders and Wicks as well. You may opt to change the colours set by default in order to better contrast with your chosen background and chart colours. I made this Indicator out of necessity as my trading required it. But I know there may be others out there who may need

Automatic fibonacci with alerts is an indicator that automatically plots a fibonacci retracement based on the number of bars you select on the BarsToScan setting in the indicator. The fibonacci is automatically updated in real time as new highest and lowest values appear amongst the selected bars. You can select which level values to be displayed in the indicator settings. You can also select the color of the levels thus enabling the trader to be able to attach the indicator several times with d

Pivot Point Fibo RSJ - это индикатор, который отслеживает линии поддержки и сопротивления дня с использованием ставок Фибоначчи.
Этот впечатляющий индикатор создает до 7 уровней поддержки и сопротивления через точку разворота с использованием ставок Фибоначчи. Замечательно, как цены уважают каждый уровень этой поддержки и сопротивления, где можно определить возможные точки входа / выхода из операции.
Функции До 7 уровней поддержки и 7 уровней сопротивления Устанавливайте цвета уровней индив
FREE

Functional in the Forex market. Functional on the B3 market - Bolsa Brasil Balcão. Motivation The Price Guide indicator is a tool that helps you insert support and resistance points at the chosen price and in the quantity you want, it depends on the agility of its configuration. This FULL version will work in Meta Trader 5 on all accounts and Strategy Tester . To test on the DEMO account , download the free version at: https://www.mql5.com/pt/market/product/111620 Operation The method

An ICT fair value gap is a trading concept that identifies market imbalances based on a three-candle sequence. The middle candle has a large body while the adjacent candles have upper and lower wicks that do not overlap with the middle candle. This formation suggests that there is an imbalance where buying and selling powers are not equal. Settings Minimum size of FVG (pips) -> FVGs less than the indicated pips will be not be drawn Show touched FVGs Normal FVG color -> color of FVG that hasn't
FREE

Если вы ищете надежный индикатор для торговли по концепции ICT, Структура рынка ICT предоставляет руководство пользователя для трейдеров, использующих более продвинутые стратегии. Этот универсальный индикатор фокусируется на концепциях ICT (концепции умных денег). Структура рынка ICT пытается понять, как торгуют институты, помогая предсказывать их действия. Понимая и используя эту стратегию, трейдеры могут получить ценные знания о движениях рынка и находить более практичные точки входа и выхода

CAP Channel Trading - индикатор на основе волатильности, который в своей работе использует "теорию расширенных огибающих". Эти огибающие состоят из двух внешних линий. Теория огибающих утверждает, что рыночная цена, как правило, попадает в диапазон между границами огибающей (или канала). Если цены выходят за пределы огибающей, это торговый сигнал или торговая возможность.
Как торговать В основном CAP Channel Trading можно использовать для помощи при определении состояния перекупленности и пере
FREE

Setup Tabajara был создан бразильским трейдером, известным как «OGRO с Уолл-стрит».
Идея этой установки состоит в том, чтобы указать трейдеру текущий тренд цен и тип операции, которую следует искать на графике.
Операция Он делает это путем позиционирования закрытия свечей и VWAP до 10:40 утра, а затем, используя среднее арифметическое значение за 20 периодов, раскрашивает свечи в 4 возможных цвета: Зеленый -> Цена растет в восходящем тренде (Поиск точек входа для ПОКУПКИ) Черный -> Коррекци
FREE

This indicator plots the volume profile by Price on the chart
There are 5 ways to view it:
By Total Volume Traded; Volume Ticks(Forex) Separated by Buyers and Sellers; Buyers Only; Sellers Only and; Business balance (Buyers - Sellers).
It is possible to select how many days the profiles will be calculated.
On the current day it recalculates the histogram data for each new candlestick.
Another feature is to select the highest trading range by entering the desired percentage.
Th
FREE

Индикатор FFx Patterns Alerter дает торговые рекомендации по входу в рынок, по уровням TP 1, TP 2 и SL на основе любого из выбранных паттернов (PinBar, Engulfing, InsideBar, OutsideBar) Предлагаются следующие варианты: Для работы с несколькими парами можно запускать несколько экземпляров индикатора на одном графике. Рекомендации по входу - количество пипсов, которые будут добавлены после пробоя для входа в рынок 3 различных варианта расчета SL - по пипсам, с использованием множителя ATR или по м

Симметричный треугольный паттерн представляет собой период сокращения и консолидации, прежде чем цена вынуждена совершить прорыв вверх или пробой. Пробой нижней линии тренда указывает на начало нового медвежьего тренда, а прорыв верхней линии тренда указывает на начало нового бычьего тренда.
Версия MT4 доступна здесь: https://www.mql5.com/en/market/product/68709/
Этот индикатор идентифицирует эти паттерны и предупреждает вас, когда формируются 4 ключевые точки и цена снова возвращается в тр

Royal Scalping Indicator is an advanced price adaptive indicator designed to generate high-quality trading signals. Built-in multi-timeframe and multi-currency capabilities make it even more powerful to have configurations based on different symbols and timeframes. This indicator is perfect for scalp trades as well as swing trades. Royal Scalping is not just an indicator, but a trading strategy itself. Features Price Adaptive Trend Detector Algorithm Multi-Timeframe and Multi-Currency Trend Low

Was: $49 Now: $34 Blahtech Better Volume provides an enhanced version of the vertical volume bars. Each bar is compared to the previous 20 bars. Depending on its volume, range and volume density it will be assigned a state and colour. Low Volume – Minimum volume High Churn – Significant volume with limited movement Climax Neutral – High volume with unclear direction
Climax Up – High volume with bullish direction Climax Dn – High volume with bearish direction Climax Churn – High vol

Баланс спроса и предложения – простой и достаточно эффективный метод анализа рынка. Заблаговременно, ещё до разворота тренда, диаграмма спроса и предложения подскажет нам – где закончилось предложение и уже зарождается спрос, где закончился спрос и уже зарождается предложение – существенно увеличивая вероятность совершения сделки с высоким профит фактором и в правильном направлении.
Сигналы индикатора По сочетанию значений цена/объём индикатор генерирует сигналы: ED (Excess demand) – избыточны

Скринер поддержки и сопротивления находится в одном индикаторе уровня для MetaTrader, который предоставляет несколько инструментов внутри одного индикатора. Доступные инструменты: 1. Скринер структуры рынка. 2. Зона бычьего отката. 3. Зона медвежьего отката. 4. Ежедневные опорные точки 5. еженедельные опорные точки 6. ежемесячные опорные точки 7. Сильные поддержка и сопротивление, основанные на гармоническом паттерне и объеме. 8. Зоны уровня берега. ПРЕДЛОЖЕНИЕ ОГРАНИЧЕННОЕ ВРЕМЯ: Индикатор подд

This indicator obeys the popular maxim that: "THE TREND IS YOUR FRIEND" It paints a GREEN line for BUY and also paints a RED line for SELL. (you can change the colors). It gives alarms and alerts of all kinds. IT DOES NOT REPAINT and can be used for all currency pairs and timeframes. Yes, as easy and simple as that. Even a newbie can use it to make great and reliable trades. NB: For best results, get my other premium indicators for more powerful and reliable signals. Get them here: https://www.m
FREE

VTrende Pro - МТФ индикатор для трендовой торговли с панелью индикации для МТ5 !!! - Подробное описание на русском языке под видео (на Youtube) - !!!
Хотя сигналы индикатора VTrende Pro можно использовать, как сигналы полноценной торговой системы,
рекомендуется применять их в связке с ТС Билла Вильямса.
VTrende Pro - это расширенная версия индикатора VTrende . Отличие Pro версии от VTrende:
- Временные зоны
- Сигнал V - сигнал 1-2 волн
Основная задача индикатора - определить точки изм

A top-quality implementation of the famous Super Trend indicator, which needs no introduction. It is completely loyal to the original algorithm, and implements many other useful features such as a multi-timeframe dashboard. [ Installation Guide | Update Guide | Troubleshooting | FAQ | All Products ] Easy to trade It implements alerts of all kinds It implements a multi-timeframe dashboard It is non-repainting and non-backpainting Input Parameters
ATR Period - This is the average true range per
FREE

BUY INDICATOR AND GET EA FOR FREE AS A BONUS + SOME OTHER GIFTS! ITALO LEVELS INDICATOR is the best levels indicator ever created, and why is that? Using high volume zones on the market and Fibonacci the Indicator works on all time-frames and assets, indicator built after 7 years of experience on forex and many other markets. You know many levels indicators around the internet are not complete, does not help, and it's difficult to trade, but the Italo Levels Indicator is different , the Ital

Brilliant Reversal Indicator for MetaTrader 5 - Your Ultimate Alert-Driven Trading Solution Unlock unparalleled trading success with the "Brilliant Reversal Indicator" tailored for MetaTrader 5. This powerful tool has been meticulously designed to empower traders by identifying critical reversal opportunities with lightning-fast alerts. Key Features: Precise Reversal Detection: The Brilliant Reversal Indicator for MT5 specializes in pinpointing potential trend reversals, providing you with a str

The CCI Trend Dashboard is an advanced technical analysis tool available that provides a dashboard interface for traders to analyze multiple symbols and timeframes at once. It uses the Commodity Channel Index (CCI) in combination with currency strength and volumes to analyze market trends. The tool is user-friendly and suitable for both beginner and advanced traders. Note: The values are derived from the CCI values of the respective symbol and timeframe using the specified period from the sett

MACD (short for M oving A verage C onvergence/ D ivergence) is a popular trading indicator used in technical analysis of securities prices. It is designed to identify changes in the strength, direction, momentum, and duration of a trend in a security's price.
History Gerald Appel created the MACD line in the late 1970s. Thomas Aspray added the histogram feature to Appel's MACD in 1986.
The three major components and their formula 1. The MACD line: First, "PM Colored MACD" employs two

Golden Spikes Detector This indicator is based on an advanced strategy primarily for trading spikes on Boom and Crash Indices. Complex algorithms were implemented to detect high probability entries only. It alerts on potential Buy and Sell entries. To trade spikes on the Deriv or Binary broker, only take Buy Boom and Sell Cash alerts. It was optimised to be loaded on 5-minute timeframe although multiple timeframe analysis is done in the background. Features · Desktop pop up and sound

I've combined two trading strategies, the Order Block Strategy and the FVG Trading Strategy, by utilizing a combination of the FVG indicators and Order Blocks. The results have been surprisingly effective.
This is a two-in-one solution that makes it easy for traders to identify critical trading zones. I've optimized the settings so that all you need to do is install and trade; it's not overly complex to explain further. No need for any usage instructions regarding the trading method. You shou

Stargogs Spike Catcher V3.12 This Indicator is Developed To milk the BOOM and CRASH indices . Send me Message if you need any help with the indicator. CHECK OUT THE STARGOGS SPIKE CATCHER EA/ROBOT V3: CLICK HERE ALSO CHECK OUT SECOND TO NONEFX SPIKE CATCHER: CLICK HERE STARGOGS SPIKE CATCHER V3.12 WHATS NEW! Brand New Strategy. This is the Indicator you need for 2023. The Indicator Gives you an Entry at a time when conditions are met enter on every arrow and exit when it gives an X. New Tren

The market price usually falls between the borders of the channel .
If the price is out of range, it is a trading signal or trading opportunity.
Basically, Fit Channel can be used to help determine overbought and oversold conditions in the market. When the market price is close to the upper limit, the market is considered overbought (sell zone). Conversely, when the market price is close to the bottom range, the market is considered oversold (buy zone).
However, the research can be used

"The trend is your friend" is one of the oldest and best-known sayings in financial markets. However, this message only represents half of the picture. The correct saying should be, "The trend is your friend only until it ends." KT Trend Filter solves this problem by clearly indicating the start of an Uptrend and Downtrend using an averaging equation on the price series. If the trend direction is not clear, it shows the trend as sideways showing the uncertainty in the market.
Features
Get a

An indicator based on candlestick patterns
To catch short-term and long-term trends
If it gives a signal in the direction of the trend, it is long term
And if it gives a signal in the opposite direction of the trend, it is short term
Too many signals
Can be used in all symbols
Can be used in all time frames
Attributes: Too many signals Can be used in all symbols Can be used in all time frames Simple settings Simple and fast usage With author lifetime support
Settings: Candle back: Th

KT Auto Fibo draws Fibonacci retracement levels based on the ongoing trend direction. The Highs and Lows are automatically selected using the Maximum and Minimum points available on the chart. You can zoom in/out and scroll to adjust the Fibonacci levels accordingly.
Modes
Auto: It draws the Fibonacci levels automatically based on the chart area. Manual: It draws the Fibonacci levels only one time. After that, you can change the anchor points manually.
Usage: Helps to predict the future p

VR Sync Charts это утилита для синхронизации разметки между окнами. ИНДИКАТОР НЕ РАБОТАЕТ В ТЕСТЕРЕ СТРАТЕГИЙ!!! Как получить триал версию с тестовым периодом, инструкции, обучение читайте в блоге https://www.mql5.com/ru/blogs/post/726504 . С помощью VR Sync Charts Ваши трендовые урони, горизонтальные уровни, разметка Фибоначчи будут синхронизированы со всеми графиками. Утилита позволяет синхронизировать все стандартные графические объекты в терминале MetaTrader, все Ваши тренды, линии Ганна, и

Эта информационная панель представляет собой инструмент оповещения для использования с индикатором разворота структуры рынка. Его основная цель - предупредить вас о возможностях разворота на определенных временных рамках, а также о повторных проверках предупреждений (подтверждении), как это делает индикатор. Панель инструментов предназначена для самостоятельного размещения на графике и работы в фоновом режиме, чтобы отправлять вам оповещения о выбранных вами парах и таймфреймах. Он был разработ
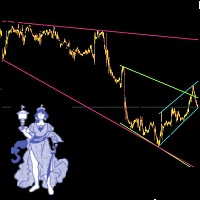
Leave a comment if you would like me to write an EA to trade these trendlines... if enough interest, will write an EA. Automatic Trendlines, updated automatically. To Set up 3 different (or mroe) Trendlines on chart, simply load the indicator as many times and name it differntly.. the example in the picture below is indicator 1 (loaded 1st time): Name: Long, StartBar: 50, BarCount: 500, Color: Pink indicator 2 (loaded 2nd time): Name: Short, StartBar: 20, BarCount: 200, Color: Green indicator 3
FREE

Индикатор iPump это универсальный индикатор, совмещающий в себе преимущества трех категорий индикаторов. одновременное определение тренда на нескольких ТФ определение зон сопротивление и поддержки определение зон перекупленности и перепроданности Функции индикатора: Определение тренда Данная функция будет необходима всем трейдерам, которые хотят объективно оценивать текущее направление рынка и избежать субъективизма. Вы за доли секунды сможете сравнить направление тренда на самых главных тайм

Royal Wave is a Trend-Power oscillator which has been programmed to locate and signal low-risk entry and exit zones. Its core algorithm statistically analyzes the market and generates trading signals for overbought, oversold and low volatile areas. By using a well-designed alerting system, this indicator makes it easier to make proper decisions regarding where to enter and where to exit trades. Features Trend-Power Algorithm Low risk Entry Zones and Exit Zones Predictions for Overbought and Over

A personal implementation of the famous Bollinger bands indicator as a trend following mechanism, which uses a moving average and the standard deviation to define what a trend is and when it changes. Bollinger bands are usually used as an oversold/overbought indicator only, but in my opinion, the trading approach is more complete using the trend variant as an exit strategy. [ Installation Guide | Update Guide | Troubleshooting | FAQ | All Products ] Easy to trade Customizable colors and sizes I
FREE

九转序列,源自于TD序列,是因TD序列的9天收盘价研判标准而得名。 汤姆·德马克(Tom DeMark)技术分析界的着名大师级人物,创建了以其名字首字母命名的TD系列的很多指标,价格反转的这个指标就是其中重要的一个,即TD序列。 德马克原版TD序列指标要复杂一些,想研究就自行看关于德马克的资料吧。这里只说简单的TD序列(九转序列)。 九转序列分为两种结构,低九买入结构和高九卖出结构。 TD高九卖出结构:连续出现的九根K线,这些K线的收盘价都比各自前面的第四根K线的收盘价高, 如果满足条件,就在各K线上方标记相应的数字,最后1根就标记为9,如果条件不满足,则K线计数中断,原计数作废重新来数K线。如出现高9,则股价大概率会出现转折。 TD低九买入结构:连续出现的九根K线,这些K线的收盘价都比各自前面的第四根K线的收盘价低,如果满足条件,就在各K线下方标记相应的数字,最后1根就标记为9,如果条件不满足,则K线计数中断,原计数作废重新来数K线。如出现低9,则股价大概率会出现转折。
结构的本质是时间和空间的组合,时间是横轴,空间是纵轴,不同的时间周期和空间大小的组合,形成不同的结构形态,不同

US30 Ninja is a 5 minute scalping indicator that will let know you when there is a trade set up (buy or sell). Once the indicator gives the trade direction, you can open a trade and use a 30 pip stop loss and a 30 pip to 50 pip take profit. Please trade at own own risk. This indicator has been created solely for the US30 market and may not yield positive results on any other pair.
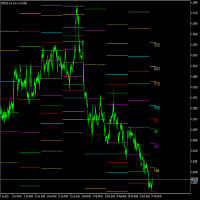
Fibonacci Pivots is a multi-timeframe indicator with custom alerts, designed to help traders easily identify key levels of support and resistance on any financial instrument. This advanced indicator uses the popular Fibonacci sequence to calculate pivot points based on the specified timeframe, depth, and backstep parameters. It also comes with customizable alerts. You can choose to be alerted when the price crosses any of the pivot points or when the price is within a specified frequency and pi
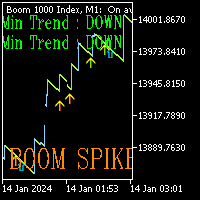
Boom Spike mater is the future for trading Boom markets. It has been designed to run on Boom 300 , 500 and 1000 markets on the 1 minute timeframe. It has 2 different trading modes (Aggressive and Normal) Aggressive mode will plot Yellow and blue arrows. 2 different conditions to help you make the right choice. Enter first trade on yellow arrow and second trade on blue candle. SL in this mode will be 10 Candles from the blue arrow. Normal mode will only plot red arrows on the chart. This mode is
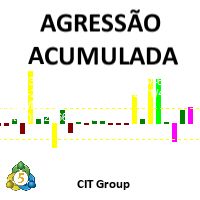
Apresentação:
- O Indicador "Agressão Acumulada" da CIT Group é um indicador especializado na bolsa brasileira (B3).
Objetivo:
- Especificamente desenvolvido para o perfil de pessoas que operam IntraDay.
Funcionamento:
- Calculado com base nos trades realizados durante o pregão, sendo atualizado a cada 1 segundo, tendo maior precisão da agressão
Funcionalidades:
- Entrega de um conjunto de parâmetros para calcular a média de agressão (Volume ou Quantidade), estes podendo

The indicator show Higher timeframe candles for ICT technical analisys Higher time frames reduce the 'noise' inherent in lower time frames, providing a clearer, more accurate picture of the market's movements.
By examining higher time frames, you can better identify trends, reversals, and key areas of support and resistance.
The Higher Time Frame Candles indicator overlays higher time frame data directly onto your current chart.
You can easily specify the higher time frame candles yo

** NOTE: This indicator uses realtime data. Thus DO NOT download Demo version. If you still need demo version, please refer to free version .
Symbol Chart Changer is an indicator/utility that offers you the option to switch between symbols and timeframes.
You can choose any symbol and timeframe on the same chart with just a few clicks. In addition, this indicator also shows the profit of the symbol through the color of the buttons.
Features: Click buttons on the chart to monitor all your
The KT QQE Advanced is a modified version of the classic QQE oscillator to depict it more accurately using the colored histogram with fast and slow Trailing Line(TL).
Unlike the classic QQE, the KT QQE Advanced consists of a histogram with overbought/oversold levels.
Applications
Find quick buy/sell signals across all the timeframes using the MTF scanner. Find the trend direction more accurately. Detects overbought/oversold market. Shows the price momentum.
Inputs RSI Period Smooth Per

Gamma Bands This indcator shows the trend with the color histogram. It is simple and easy to use. Usage: If the histogram changes from the aqua to the fuchsia, which means the trend is up. If the histogram changes from the fuchsia to the aqua,which means the trend is down. Inputs: MaPeriods: the periods of moving average. f1: the multiplier of inner bands f2: the multiplier of outer bands Popup Window Alert Email Alert Mobile Push Alert Alerts When the trend changes for the long trend to the

Пробои ценовых уровней, продвинутая статистика, расчет ТейкПрофита и 3 вида уведомлений. Преимущества: Не перерисовывает свои результаты Сигнал строго на закрытии свечи Алгоритм фильтрации ложных пробоев Отлично сочетается с любой трендовой стратегией Работает на всех инструментах и таймсериях Руководство пользователя и инструкция -> ЗДЕСЬ /Решение проблем -> ЗДЕСЬ / МТ4 версия -> ЗДЕСЬ Как торговать с индикатором: Торговля с AW Breakout Catcher всего в три простых шага: Шаг 1 - Открытие п

При пользовании осциллятором CCI (Commodity Channel Index) , в зависимости от таймфрейма, ожидание следующего сигнала может занимать достаточно большое время. Поэтому чтобы не пропустить следующий нужный вам сигнал данного индикатора, и создан индикатор CCI Alerts. Это дополнение или, скорее, замена стандартного индикатора CCI . Теперь, как только появится сигнал индикатора CCI на нужном вам уровне, - индикатор вас оповестит звуковым сообщением или push-уведомлением на мобильное устройство и вы

Тем, кто изучил книги Билла Вильямса "Новые измерения в биржевой торговле" и "Торговый Хаос (второе издание)" и пробовал торговать по этим методикам, становится ясно, что стандартного набора индикаторов недостаточно для полноценной работы. Индикатор Trading Chaos Map рисует "карту рынка", позволяя вам видеть графики так же, как автор трилогии. В параметрах предусмотрены опции включения и отключения каждого сигнала. Вы можете использовать ту или иную методику, либо использовать их вместе. Может

BreakHarmony Multi-Timeframe Breakout Indicator for MT5
The BreakHarmony Multi-Timeframe Breakout Indicator for MT5 is a highly advanced tool providing information on breakout points across different timeframes, aiding traders in decision-making and understanding market movements. [ Features and Manual | MT4 version | All Products ] The indicator tracks breakout points on price charts across 6 timeframes. Breakout prices are indicated with the closing price of the correspond

Стратегия пробоя для торговли по тренду, фильтрация и все необходимые функции, встроенные в один инструмент! Интеллектуальный алгоритм индикатора Trend Pro с точностью определяет тренд, отфильтровывает рыночный шум и генерирует входные сигналы и уровни выхода. Новые функции с расширенными правилами статистического расчета улучшают общую производительность этого индикатора.
Важная информация Для максимального использования потенциала Trend Pro прочитайте полное описание www.mql5.com/en/blogs/

Это индикатор, следящий за трендом и основанный на MACD, предоставляет сигналы на покупку, когда выше 200-MA, и сигналы на продажу, когда ниже него. Сигнал генерируется при пересечении MACD нулевой линии. Индикатор также отображает уровень поддержки и сопротивления, который можно использовать в качестве стоп-лосса. Регулируемые параметры включают период MA, быструю EMA MACD, медленную EMA и интервал поддержки-сопротивления. Он отображается на самых низких и высоких точках последних свечей. Настр
FREE

Dark Oscillator is an Indicator for intraday trading. This Indicator is based on Counter Trend strategy, trying to intercept changes in direction, in advance compared trend following indicators. We can enter in good price with this Indicator, in order to follow the inversion of the trend on the current instrument. It is advised to use low spread ECN brokers. This Indicator does Not repaint and N ot lag . Recommended timeframes are M5, M15 and H1. Recommended working pairs: All. I nst
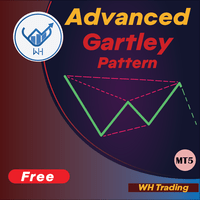
Добро пожаловать в индикатор распознавания образов Advanced Gartley Этот индикатор обнаруживает паттерн Гартли на основе HH и LL ценовой структуры и уровней Фибоначчи, и при достижении определенных уровней Фибо индикатор отображает паттерн на графике. Версия MT4: WH Advanced Gartley Pattern MT4 **Этот индикатор является частью комбо Ultimate Harmonic Patterns MT5 , который включает в себя все функции распознавания образов.**
Функции : Расширенный алгоритм обнаружения паттерна Гартли с в
FREE

The Inversion Fair Value Gaps (IFVG) indicator is based on the inversion FVG concept by ICT and provides support and resistance zones based on mitigated Fair Value Gaps (FVGs). Image 1
USAGE Once mitigation of an FVG occurs, we detect the zone as an "Inverted FVG". This would now be looked upon for potential support or resistance.
Mitigation occurs when the price closes above or below the FVG area in the opposite direction of its bias. (Image 2)
Inverted Bullish FVGs Turn into P

Tape Reading, flow monitoring.
FabFlowInPrice is a powerful indicator for those who like Tape Reading (Times & Trades). It presents the volumes traded at each price level, considering the purchase, sale and direct aggressions for each level. Excellent tool for market flow analysis. Thought of flow so monitor who is attacking the most, buyers, sellers or direct exchanges, thought FabFlowInPrice. The indicator displays information in 4 distinct and fixed periods, on any timeframe: @Day - All

Паттерн «голова и плечи» - это форма диаграммы, которая напоминает базовую линию с тремя вершинами, две внешние - близки по высоте, а средняя - самая высокая. Он предсказывает разворот тренда от бычьего к медвежьему и считается одним из самых надежных паттернов разворота тренда. Это один из нескольких верхних паттернов, которые с различной степенью точности сигнализируют о том, что тренд близится к концу. [ Руководство по установке | Руководство по обновлению | Устранение неполадок | FAQ | Все

Паттерн 123 - один из самых популярных, мощных и гибких графических паттернов. Паттерн состоит из трех ценовых точек: дна, пика или долины и восстановления Фибоначчи между 38,2% и 71,8%. Паттерн считается действительным, когда цена выходит за пределы последнего пика или долины, в момент, когда индикатор строит стрелку, выдает предупреждение, и сделка может быть размещена. [ Руководство по установке | Руководство по обновлению | Устранение неполадок | FAQ | Все продукты ]
Четкие торговые сиг

Это простой индикатор VWAP, но мы добавили в него оповещения, чтобы вы знали, когда цена касается простого VWAP или пересекает его. Этот индикатор представляет собой традиционный индикатор VWAP для MetaTrader 5 (MT5). Стандартные параметры такие же, как у обычного VWAP, но у вас есть возможность использовать новые расчеты и лучшее: Когда цена касается или пересекает VWAP, вы узнаете об этом через оповещения, уведомления на мобильном телефоне, электронную почту или звуковые события. бесплатный ин
FREE

If you want to find good trading opportunities, then you must trade near the Trend Line. This allows you to have a tighter stop loss on your trades — which improves your risk to reward . But that’s not all… Because if you combine Trend Line with Support and Resistance, that’s where you find the best trading opportunities. Now you might wonder: “So when do I enter a trade?” Well, you can use reversal candlestick patterns (like the Hammer, Bullish Engulfing, etc.) as your e

The Smart Liquidity Profile is color-coded based on the importance of the traded activity at specific price levels, allowing traders to identify significant price levels such as support and resistance levels, supply and demand zones, liquidity gaps, consolidation zones, Buy-Side/Sell-Side Liquidity and so on. Smart Liquidity Profile allows users to choose from a number of different time periods including 'Auto,' 'Fixed Range,' 'Swing High,' 'Swing Low,' 'Session,' 'Day,' 'Week,' 'Month,' 'Quart

Trend Master Chart – это индикатор тренда, который вам нужен. Он накладывает диаграмму и использует цветовое кодирование для определения различных рыночных тенденций/движений. Он использует алгоритм, который объединяет две скользящие средние и разные осцилляторы. Периоды этих трех элементов можно изменить. Работает на любом таймфрейме и любой паре.
С первого взгляда вы сможете определить восходящий или нисходящий тренд и различные точки входа в этот тренд. Например, во время заметного восходя
FREE

MOON 4 TREND COLORS: is a Tren indicator. I s a powerful indicator of TREND for any par and any timeframe. It doesn't requires any additional indicators for the trading setup.The indicator gives clear signals about opening and closing trades, PAINTING THE CANDLES OF COLOR IN FUNCTION OF THE SENSE OF TREND .This Indicator is a unique, high quality and affordable trading tool.
Perfect For New Traders And Expert Traders Low risk entries. For MT5 Only Great For Scalping Great For Swing Trad

Индикатор "Sniper MACD" представляет собой улучшенную версию классического индикатора MACD, оптимизированную с использованием нескольких методов для достижения максимальной эффективности торговли. Этот индикатор обладает дополнительной фильтрацией и несколькими уровнями сглаживания, что позволяет получить более точные сигналы. Особенности: Дополнительная фильтрация: Внедрена дополнительная фильтрация для улучшения качества сигналов, что помогает избежать ложных сигналов и повышает точность прог
FREE

Получите сигнал о следующем разворотном движении | Оптимизируйте статистику коэффициента усиления | Получить зоны, которые цена будет тестировать | Индикатор без перерисовки и задержек - идеально подходит для ручной и автоматической торговли - подходит для всех активов и всех временных единиц $ 69 на старте - затем снова $149 После покупки пожалуйста, свяжитесь с моим каналом для получения рекомендуемых настроек Версия МТ4 | Получите наш полный метод с TrendDECO

Do you know VWAP Bands? It is an indicator used to identify support and resistance points from the daily VWAP and you can use it to check the best entry and exit points. This indicator does not use the principle of bollinger bands. There is a difference in the calculation method. Use it according to your strategy. See the applications and what results you can get. The indicator is free and can be used on any account.
FREE

Simplify your trading experience with Trend Signals Professional indicator. Easy trend recognition. Precise market enter and exit signals. Bollinger Bands trend confirmation support. ATR-based trend confirmation support. (By default this option is OFF to keep interface clean. You can turn it ON in indicator settings.) Easy to spot flat market conditions with ATR-based trend confirmation lines. Highly customizable settings. Fast and responsive. Note: Do not confuse ATR-based trend confirmation
FREE

Cybertrade Auto Fibonacci retraction and projection - MT5
##### Free indicator for an indefinite period. ##### Auto Fibonacci is an indicator that automatically plots the Fibonacci retracement and projection based on the number of bars you select in the indicator setting. You can customize nine different levels of retraction and three levels of projection. It works on periods longer than the period visible on the chart. All values are available in the form of buffers to simplify possible au
FREE

MACD divergence indicator finds divergences between price chart and MACD indicator and informs you with alerts (popup, mobile notification or email) . Its main use is to find trend reversals in the chart. Always use the divergence indicators with other technical assets like support resistance zones, candlestick patterns and price action to have a higher possibility to find trend reversals. Three confirmation type for MACD divergences: MACD line cross zero level Price returns to previous H/L Crea
FREE

Boom and Crash Spike Detector v1.0 Boom and Crash spike detector prints Down non repaint Arrow for catching crash spikes and Up non repaint arrow for catching boom spikes. It is suitable for 1M time frame for majorly crash500 and Boom 500. When the Red arrow prints in a red zone moving averages, it indicates high probability of crash spikes downwards, likewise, blue arrow printing in a blue zone of moving average, it indicates high probability of boom spikes. Its pretty straight forward since
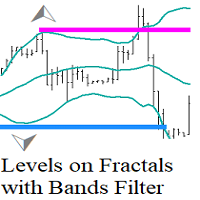
Levels on Fractals with Bands Filter - это уровни на основе фракталов отфильтрованные с помощью индикатора Bollinger Bands. Индикатор уровней, основанный на фракталах Билла Вильямса, отфильтрованных с помощью Линий Боллинджера, представляет собой инструмент технического анализа, который использует комбинацию фракталов и индикатора Боллинджера для определения уровней поддержки и сопротивления. Как использовать?
Когда фрактал образуется за внешней лентой Боллинджера (пробой волатильности) эт
FREE

Fractal Advanced - отображает индикаторы Fractal и Alligator на графике цены. Обладает широкими возможностями настроек и кастомизации. Также оснащён алертами и системой горячих клавиш.
Инструкция/Мануал ( Обязательно читайте перед приобретением ) | Версия для МТ4
Преимущества
1. Индикатор не забивает весь график фракталами, а позволяет отображать только актуальные сигналы.
2. Регулировка количества фракталов осуществляется при помощи скролла мыши с зажатой клавишей Shift.
3. Мгновенное ото
MetaTrader Маркет - уникальная площадка по продаже роботов и технических индикаторов, не имеющая аналогов.
Памятка пользователя MQL5.community расскажет вам и о других возможностях, доступных трейдерам только у нас: копирование торговых сигналов, заказ программ для фрилансеров, автоматические расчеты через платежную систему, аренда вычислительных мощностей в MQL5 Cloud Network.
Вы упускаете торговые возможности:
- Бесплатные приложения для трейдинга
- 8 000+ сигналов для копирования
- Экономические новости для анализа финансовых рынков
Регистрация
Вход
Если у вас нет учетной записи, зарегистрируйтесь
Для авторизации и пользования сайтом MQL5.com необходимо разрешить использование файлов Сookie.
Пожалуйста, включите в вашем браузере данную настройку, иначе вы не сможете авторизоваться.