Смотри обучающее видео по маркету на YouTube
Как купить торгового робота или индикатор
Запусти робота на
виртуальном хостинге
виртуальном хостинге
Протестируй индикатор/робота перед покупкой
Хочешь зарабатывать в Маркете?
Как подать продукт, чтобы его покупали
Технические индикаторы для MetaTrader 4 - 71

MARKET PREDATOR 1 --------------------------------------------------- This powerful and reliable indicator is based on a custom trend following strategy. It does not signal against the obvious trend. No fancy and clouded charts. It is a simple but powerful BUY and SELL signals indicator. It is great for Day Traders and Scalpers too. Each currency pair works better with a specific timeframe so use the recommended timeframes with their respective pairs as below:
PAIR || TIMEFRAME =
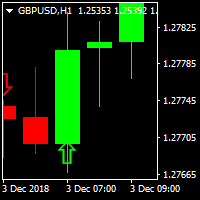
PIPs Forecast Indicator A traders perfect tool to catch big pips in the market One of its kind indcator that gets you in the game early enough
Supporting Multi-Currencies Works on all time-frames but if you're not a scalper stick to H1,H4,D1, W1 and MN for good results. Comes Pre-configured to ensure consitency Can be used alongside other indicators to avoid accumulation regions and Asian session ranges. For details, MT5 and EA questions feel free to contact me on elllykamau@gmail.com
Now wi

This indicator will allow you to evaluate single currency linear regression.
WHAT IS LINEAR REGRESSION?(PIC.3) Linear regression is an attempt to model a straight-line equation between two variables considering a set of data values. The aim of the model is to find the best fit that can serve the two unknown values without putting the other at a disadvantage. In this case, the two variables are price and time, the two most basic factors in the Forex market. Linear regression works in such a wa
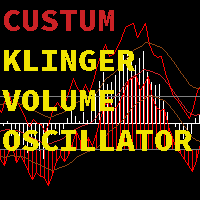
Or (KVO) determines the long-term trend of money flow while remaining sensitive enough to detect short-term fluctuations.It u ses the key price compared to the prior bar's key price to assign volume as positive or negative value. Volume is a measure of how many units of a pair are trading per unit of time.You can choose between a KVO line, histogram, or both combined with this Klinger Volme Oscillator.The Klinger Volume Oscillator is a trend reversal indicator. It relies on the concept of a vol
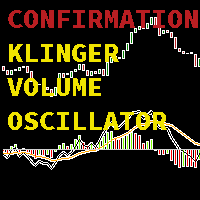
Or (KVO) determines the long-term trend of money flow while remaining sensitive enough to confirm short-term reversals.It u ses the key price, and increasing and decreasing bars compared to the prior bar's key price and increasing and decreasing bars to assign volume and the trend as positive or negative values. Volume is a measure of how many units of a pair are trading per unit of time, while the increasing and decreasing bars are a measure strength of the trend the trend .The Klinger Volume O

This indicator displays the histogram and arrows on chart. When Simple The Best Pro are placed on a chart, they identify the trend. The color of may be blue or red. The blue color stands for upside moves and the red color stands for downside trends. The indicator offers to set Stop Loss (SL) and Take Profit (TP) setting. The default value is ATR. Indicator has automatic optimization. The STB is a unique indicator that shows the tendency (button Bars) of a particular signals. The STB tells us

A lmas Wall Street - профессиональный стрелочный индикатор без перерисовки. Сигналы появляются одновременно с формированием свечи. Рекомендации по торговле : Войдите в сделку минимум на 2 свечи или на следующей свече после сигнала за 1 свечу. Скриншот 5. Красная стрелка вниз указывает на необходимость рассмотрения продаж, а синяя - на покупку. Все, что вам нужно настроить, это цвета сигнальных стрелок. Рекомендуется применять этот индикатор для скальпинга на временных интервалах M1-M5. Сигналы

Price Momentum Index (PMI) Price Momentum Index (PMI) is a powerful and easy to use indicator. It can use for any currency and timeframe. Features Noise reduction. Trend detection. No lag. Good entry point detection. Good TP guide line. All in one window, easy to use and make decision. How to Use Prepare entry - When the PMI line (aqua) is between Signal (yellow) and Sinal2 (red) line. Entry - When the PMI (aqua) line breaks through Signal1(yellow) or Signal 2 (red) line. Exit - When the PMI li

Introduction Professional traders use pivot points as support/resistance levels or as an indicator of a trend. Basically, a pivot point are areas at which the direction of price movement can possibly change. What makes pivot points so popular is their objectivity as they are recalculated each time the price moves further. The pivot points indicator implements 5 popular pivot points calculation and drawing: Standard – The most basic and popular type of the pivots, each point serve as an indica
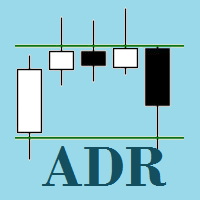
Average Daily Range (ADR) SR is an indicator which shows how far a currency pair can move in a day. It can be used to find hidden support and resistance levels (SR), estimate effective profit and stop loss targets, and provide short term trade signals from the hidden SR levels. Features
Automatically plots on the chat, the top and bottom of the ADR value (i.e. a horizontal channel) which acts as Support and Resistance Levels Automatically calculates the percentage of the ADR reached by the curr

This indicator will generate signal from other indicators like RSI, MA, Force Index etc into one confluent signal.
Which indicators to be used is up to the users to decide. You can add a simple MA, OsMa, RVI and ADX to see how these indicators will work out when combined together, an arrow will be drawn onto your chart where confluence happens.
And if that combination doesn't seem so good, then tweak the setting a little bit or remove it completely or add another different indicator, as you

Brilliant Wall Street является профессиональным стрелочным индикатором. O н основан на математическом расчете. благодаря специальному алгоритму расчета который разрабатывался лутшыми спецыалистами он не опаздывает более того он дает опережающие сигналы . --------- практически полное отсутствие перерисовки---------. сигналы появляются вместе с появлением свечи. Bходить в сделку минимум на 1-2 свечи рекомендуется на следующей свечи но можно и на сигнальной. . Красная стрелка вниз указыв

Данный индикатор отображает точки входа в рынок и точки выхода, которые определяются по заданному расстоянию в пунктах. В основе взят индикатор Parabolic, различные математические и статистические методы. Индикатор помогает во многих случаях пропустить ложные входы, линия поддержки и сопротивления огибает цену в определенном режиме, снижая убытки. Информационная панель показывает результаты работы индикатора, чтобы можно было его настроить более точно и видеть, как параметры влияют на результа

Insider Sniper MTF это стрелочный индикатор для торговли от уровней поддержки сопротивления ---полное отсутствие перерисовки---
он умеет определять уровни поддержки сопротивления находит най лутшые точки входа и показывает их стрелочками
Если формируется тенденция, индикатор всегда оповестит с помощью стрелочного сигнала . сигнал на покупку синяя стрелка на продажу красная стрелка.
Этот сигнальный инструмент также можно применять на боковом движении рынка. Главное, чтобы оно было волати
Psychological or Round Levels indicator automatically draws lines or zones at the psychological levels (00 or 50) as the market moves. New lines are drawn as the market moves while the old lines are deleted. This ensures that your chart is clutter-free. The user specifies the number of lines preferred on the chat, and the indicator keeps the number of lines constant. The indicator plots two types of levels, the Main Level (00 levels e.g. USDCAD 1.33000, 1.34000) and the Sub Level (50 levels -

The indicator signals about "Impulse near!" or "Reversal point near!" The arrow-signal does not disappear and does not redraw after a bar closes. On next bar you may to open orders: buy stop && sell stop. Working timeframe: D1, H4, H1, M30, M15. The indicator parameters Momentum soon Period1 18 Calculation period 1 Period2 37 Calculation pe
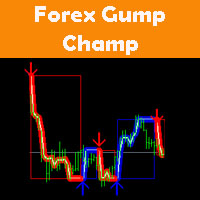
ForexGumpChamp является профессиональной торговой системой. С помощью данной торговой стратегии работают многие известные форекс трейдеры и управляющие инвестора. Мы как разработчики проанализировали их торговую стратегию и конвертировали ее в простой и понятный индикатор. ForexGumpChamp сам анализирует рынок и дает трейдеру простые и понятные сигналы на открытие и закрытие сделок. Для того, чтобы сделать Вашу работу еще проще и избавить от потребности постоянно находиться за компьютером, мы инт
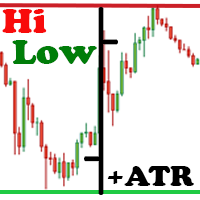
Индикатор Hi Low Last Day ( Hi Lo Last Day ) показывает максимум и минимум прошлого торгового дня и второго торгового дня. Существует множество торговых стратегий по дневным уровням. Этот индикатор незаменим при использовании таких торговых стратегий. На самом деле, в торговле все просто, нужно только это понять и принять для себя. Есть только цена!!! А что такое цена? На графике это уровень. Уровень - это цена, которую сдерживает покупатель и продавец. Какую цену сдерживает контрагент? Цену

KT COG is an advanced implementation of the center of gravity indicator presented by John F. Ehlers in the May 2002 edition of Technical Analysis of Stocks & Commodities magazine. It's a leading indicator which can be used to identify the potential reversal points with the minimum lag. The COG oscillator catches the price swings quite effectively.
MT5 version of the same indicator is available here KT COG Advanced MT5
Calculation of COG The COG indicator is consist of the two lines. The mai

Demarker levels cross Alert is a modified version of the classic Demarker indicator, with email and mobile alert when demarker cross High or Low levels, default levels setting are: low=0.1 and High=0.9 and Demarker of periode=10, you can modify all these entries to find the best setting for every Pair or Stock. Basically these Alerts are reversal Alerts, you will get: 1-Buy alert when Demarker cross above Low level. 2-Sell alert when Demarker cross below High level. -----------------------------

Индикатор Sensitive Signal ( SS ), используя разработанные автором методы фильтрации (что включают и кластерный мультивалютный анализ), позволяет с большой долей вероятности устанавливать начало истинного (отфильтрованного от помех – случайных блужданий цены) трендового движения, что очень эффективно для торговли . Разработанная автором фильтрация проводится в несколько итераций и выявляет истинную траекторию закономерного движения цены (точнее, наиболее вероятную кривую такого д
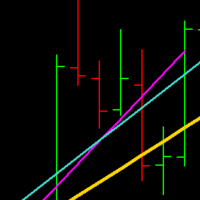
TrueRegression will calculate the linear regression of a given sequence of bars, and display the line of best fit on the chart. Regression is used to determine whether a market is currently trending, and whether sub-trends are occurring, which can hint at a potential breakout situation. The indicator will recalculate every 'n' bars (defined by the user input). When the indicator re-draws, it will keep the original lines on the chart, unmodified, so they can be referenced by a custom EA, or by th
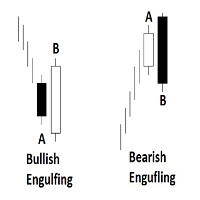
Engulfing Candlestick Bulkowski The engulfing candlestick is a well-known candle pattern composed of two candles. This indicator for showing engulfing candlestick that describe by Thomas Bulkowski.
If you need for MetaTrader 5 version, please visit here: https://www.mql5.com/en/market/product/34183
Feature Highlights Show bullish engulfing and bearish engulfing. Customizable "Up Symbol". Customizable "Down Symbol". Customizable symbol distance from candlestick. Customizable "Down Color". Cus

This indicator displays XR Power Trend movement.Indicator displays Moving Average period 5,Moving Average period 26,Moving Average period 52,Commodity Channel Index,MACD,Average Directional Movement Index,Bulls Power,Bears Power,Stochastic Oscillator,Relative Strength Index,Force Index,Momentum,DeMarker,average movement.Indicators period is standard period.
Features X - move the trend left and right. Y - move the trend up and down.
How to understand the status: If the Trend color is green

Introduction
This indicator alerts you when certain price levels are reached. The alert can be on an intrabar basis or on a closing price basis. It will also send alerts when one forms, including via e-mail or push notification to your phone . It's ideal for when you want to be notified of a price level being reached but don't want to have to sit in front of your chart all day.
Input Parameters
DoAlert: if set to true a desktop pop-up alert will appear from your MetaTrader terminal whe

A simple but very useful indicator that allows you to display the current date and time on the chart. Especially useful when you save your analysis or trades.
Features: show local date and time show server date and time show remaining time to end the current timeframe interval customizable display parameters - show/hide date or time set display position set display size set display color works on every timeframe

Scalping Trender ***Specialized for scalping trading on timeframe 5m & 15m***
work best with: **USDMXN m5 **USDMXN m15 **GBPJPY m15 **EURJPY m15 **USDTRY m15 **EURTRY m15
Scalping Trender use smart algorithm detects the price circles with time . give strong signals at the right time as result of combine the price and time.
our team spent months to develop this indicator specially for Scalping..with high success rates about 89% win trades .
Advantages Easy, visual and effective

This indicator helps you to find price that may cause MACD Signal crossover on the current bar.. These crossover points are depicted in form of stars (like Parabolic SAR).
prevEMA line also helps you to decide the trend.
Get 20% OFF for rents for 1 year! How to use:
MACDSignalStars (Violet) stars displayed are the the prices that make the MACDmain = MACDsignal.
If the close price is higher than the star, then MACDmain > MACD signal. If the close price is lower than the star, then MACDmain

Представляем DFP Reconnoiter Ultimate — технический индикатор, специально разработанный для трейдеров, использующих стратегию Daily Fibonacci Pivot . Этот индикатор включает в себя стандартные уровни коррекции Фибоначчи, дневные уровни разворота, модели свечей, уровни ATR и ADR для определения областей разворота и выхода, что обеспечивает своевременные входы. Ключевые уровни восстановления Фибоначчи 38,2%, 50,0% или 61,8% предпочтительнее в сочетании с дневным центральным пивотом. Страте
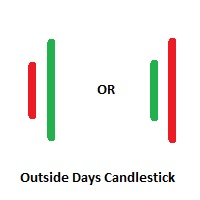
Outside Days Candlestick Bulkowski The Outside days candlestick is a well-known candle pattern composed of two candles. This indicator for showing outside days candlestick that describe by Thomas Bulkowski.
If you need for MetaTrader 5 version, please visit here: https://www.mql5.com/en/market/product/34406
Feature Highlights Show outside days candlestick. Customizable "Symbol". Customizable symbol distance from candlestick.
Input Parameters Symbol - Input symbol code from "wingdings" for

KT Pin Bar identifies the pin bar formation which is a type of price action pattern which depicts a sign of reversal or rejection of the trend. When combined with support and resistance, BRN and other significant levels, Pin Bar pattern proved to be a very strong sign of reversal.
Basically, a pin bar is characterized by a small body relative to the bar length which is closed either in upper or lower 50% part of its length. They have very large wicks and small candle body.
A pin bar candlest

Trump Day индикатор для эффективнoй прибыльной торговли бинарными опционами полное отсутствие перерисовки Cтрелка указывает направление следующей свечи и возможного направления тренда процент правильных прогнозов индикатора от 80%. его преимущества: точность сигналов. полное отсутствие перерисовки. Вы сможете выбрать абсолютно любой инструмент. индикатор обеспечит точные сигналы. Рекомендуется открывать сделки на 2 - 3 свечей. плюсы индикаторa: 1. опережающие сигналы. 2. высокая точность сы

Dark Sniper стрелочный индикатоp. полное отсутствие перерисовки процент правильных прогнозов индикатора от 80 85% Cтрелка указывает направление следующей свечи и возможного направления тренда в дальнейшем. подходит для маленьких таймфреймов м1. Pекомендуется открывать сделки от 1 до 2 свечей. Сигнал появляется на прошлой свечи плюсы индикаторa: 1. опережающие сигналы. 2.полное отсутствие перерисовки 3. высокая точность сигналов. 4. чaстота появления сигналов.

KT Auto Fibo draws Fibonacci retracement levels based on the ongoing trend direction. The Highs and Lows are automatically selected using the Maximum and Minimum points available on the chart. You can zoom in/out and scroll to adjust the Fibonacci levels accordingly.
Modes
Auto: It draws the Fibonacci levels automatically based on the chart area. Manual: It draws the Fibonacci levels only one time. After that, you can change the anchor points manually.
Usage: Helps to predict the future pr
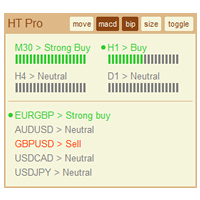
Индикатор High Trend Pro (высокий тренд, профессиональная версия) мониторит большое количество символов на 4 таймфреймах одновременно и определяет силу сигнала. Индикатор сообщает, когда происходит совпадение сигналов на разных таймфреймах. При этом индикатор может быть запущен на одном графике. Таким образом, High Trend Pro - это мильтивалютный и мультитаймфреймовый индикатор. High Trend Pro использует переработанные версии популярных и востребованных индикаторов для определения силы сигнала. H

KT Psar Arrows plots the arrows on chart using the standard Parabolic SAR indicator. A bullish arrow is plotted when the candle's high touch the SAR. A bearish arrow is plotted when the candle's low touch the SAR. The signals are generated in the real-time without waiting for the bar close.
Features
A beneficial tool for traders who want to experiment with the trading strategies that include the use of Parabolic Sar indicator. Can be used to find turning points in the market. Use custom PSA

Open High Low Close Внешняя Свеча
Индикатор внешних свечей наложенных на график с выбранными вами тайм фреймом.
Наглядно отображаете уровни OHLC и пройденное значение ATR текущей свечи и свечей в истории.
OHLC — аббревиатура, дословно расшифровывается как:
O — open (цена открытия интервала (бара или японской свечи)).
H — high (максимум цены интервала).
L — low (минимум цены интервала).
C — close (цена закрытия интервала).
Данный индикатор наглядно покажет трейдеру, уровень открыт
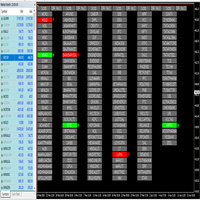
* Compatible with MCX, NSE, Futures, Forex. * No need to monitor individual script. * Sound Alert and Popup on new signal. * Change Number of previous candles to signal to be generated. * Single Click To See Live Chart From Defined Templates * Custom List of Script Can be Made
*Parameters of Each Indicator can be changed for Scanning * Scan based on multiple indicators like: - Moving Average Crossover (All Types of MA) - RSI - Parabolic SAR - Stochastic - M
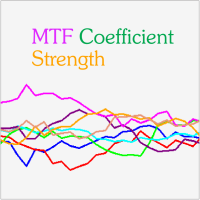
MTF Coefficient Strength is a Currency Strength Indicator based on RSI. It gives the strength of the 8 major currencies. What makes this indicator different from similar products are the following features : Choice between Classical Mode and Multi-Timeframe Mode. The MTF (Multi-Timeframe) Mode uses an averaging of the values coming from the different Timeframes. Possibility to use a Coefficient for each Timeframe separately. Possibility to draw Horizontal Lines in order to quickly compare lev
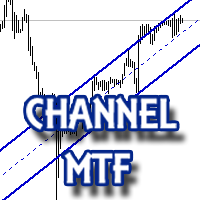
Мультитаймфреймовый индикатор каналов в автоматическом режиме обеспечивает визуальное отображение линий поддержки и сопротивления. Будет полезен всем трейдерам, использующим в своей работе технический анализ. Индикатор можно использовать как самостоятельный инструмент анализа рынка, так и как часть торговой стратегии. Настройки TimeFrame - Таймфрейм для построения канала; Line color - Цвет линий канала; Mark the intersection? - Отмечать маркером пересечение ценой границ канала?
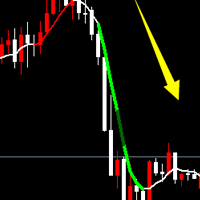
This indicator is suitable for long, medium and short-term foreign exchange users.
Suitable for trending technology users
Have a strong judgment and guidance
Need to combine the MACD indicator to find a specific entry location
How to use: The best approach conditions are MACD cross-average color change, find the callback position to enter the field to do the homeopathic, find the resistance level in the big cycle to protect the damage
Simple, intuitive and practical, suitable for forei
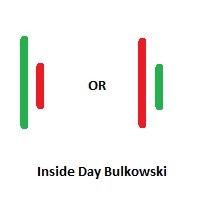
Inside Days Candlestick Bulkowski Inside Days Candlestick Bulkowski The Inside days candlestick is a well-known candle pattern composed of two candles. This indicator for showing outside days candlestick that describe by Thomas Bulkowski.
If you need for MetaTrader 5 version, please visit here: https://www.mql5.com/en/market/product/34724
Feature Highlights Show inside days candlestick. Customizable "Symbol". Customizable symbol distance from candlestick.
Input Parameters Symbol - Input

MOVING AVERAGE BANDS / MA BANDS: This is an very simple Indicator but very powerful in identifying trend reversal.The calculation of moving Average bands consist of defining the range of bars and the multiplier we use. -To find range of n bars we used the values of moving average high and low values of n bars. -Then we used individual multiplier for individual bands. -The multiplier we defining can be based on your style say for example some needs moving average fibonacci bands or dynamic fibona
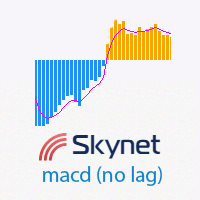
Данный индикатор отображает гистограмму пересечения двух аналогов скользящей средней, по внешнему виду такую же, как и классический индикатор MACD, только практически без задержки. Первое значение индикатора после перехода через ноль вычисляется с помощью разницы верхней и нижней полосы Боллинджера и не может быть равно нулю.
Преимущества практически отсутствует задержка при увеличении периодов усреднения, так как используются аналоги средних, где нет такого отрицательного эффекта, как задержк

В тестере не работает смотрите как работает на видео извините за неудобства ето сделано для кочественой работы в реальном времени при торговле. индикатор рисует уровни поддержки сопротивления. так же при появлении уровня появляетса стрелка указатель куда нужно открывать сделку. вы не пропустите ни одного нужного подхода к уровню. индикатор хорошие результаты показал на всех графиках и тайм-фреймах.рекомендуемые настройки PeriodBars 1000. трейдеры торгующие из wall street тоже используют уровни п

Esta es una de las modificaciones de los canales Keltner. Ayuda a identificar puntos de entrada y salida lógicos. Ayuda a determinar un posible movimiento de precios. Crea canales equidistantes que se convierten en niveles de soporte y resistencia dinámicos. Facilita enormemente el análisis del mercado visual. El indicador es un multi-tiempo multi-tiempo muestra buenos resultados.

Индикатор ForexMarshalsBars относится к группе трендовых индикаторов. Он дает возможность принимать правильные решения о входе в рынок или выходе из него и через его настройки указывает, следует ли открывать длинную или короткую позицию для получения прибыли. Вы должны понимать, на чем основываются сигналы, которые дает вам индикатор. Прежде всего надо запомнить то, что лучше всего использовать сразу несколько индикаторов, чтобы уменьшить свои риски и только так вам удастся получить более то
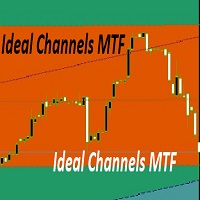
торговый индикатор, который автоматически распознает уровни поддержки и сопротивления и отображает их на ценовых графиках. индикатор использует систему элдера. может быть применен к любым финансовым инструментам и на любых таймфреймах. так же индикатор рисует каналы с тех самых уровней умеет рисовать канал в канале выделяя тем самым в тренде небольшие тенденции он отлично подойдет для скальпинга так как суть его заключается в торговле в канале индикатор имеет множество параметров которые поз

Base Trading System (MTF) MULTI TIME FRAME
For Single Time Frame click here BASE TRADING SYSTEM MTF is a useful tool to trade with simple strategy. It draws automatically base up for long trade and base down for short trade. Clear trade when base is going opposite direction. User can trade by instant market entry or by pending order entry. It depends on user best strategy. input: Arrow UP, Arrow DOWN. Base Box Color- UP base box , DOWN base box, UP base shadow, Down base shadow.

"It's not about how much you do, but how much love you put into what you do that counts." - Mother Teresa
This Indicator is build on value of Relative Strength Index and Moving average of relative strength Index. We have calculated bands with respect to Moving average of Relative strength Index. Trading strategy: https://www.mql5.com/en/blogs/post/725691 Why use Rsi Ma Bands? Great for novice traders as well as experienced traders. Low risk entries. Doesn't repaints.
No additional Indica
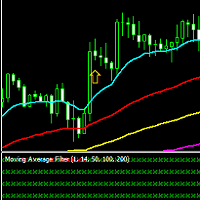
This is a filter of various moving average combinations used to give a higher level of confidence to trade entries. The indicator may be used with moving averages on the chart or independently by itself to show the current trend direction. Trade signals of the Moving Average Filter are based on the Price (1EMA) vs the 14EMA, the 14EMA vs the 50EMA, the 50EMA vs the 100EMA, and the 100EMA vs the 200EMA. Trade signals are produced when all of the filters are in alignment, thus showing all green or
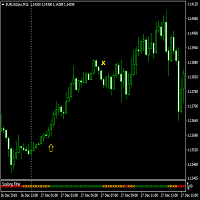
Advanced Scalping Filter to be used on any major currency pair. Designed for the 15 minute time-frame, however the filter should also work efficiently on the 5 minute time-frame. This filter takes into account various conditions of MACD's, Moving Averages, as well as current price positioning, to produce recommended buy, sell, or exit signals (as green for buy, red for sell, and orange for exit). Ideal for quick 10 pip profits or for exit signal to occur.

Индикатор Bad Boys это стрелочный индикатор процент (плюсовых сделок) правильных прогнозов индикатора даже во время выхода новостей индикатор тестировался на реальном счете и показал хороший результат правильных прогнозов. Настройки позволяют настроить цвет стрелок. volatility period период индикатора количество баров за которое будет вестись анализ рынка price это метод когда будет появляться сигнал при открытии при закрытии свечи и т.д volatility позволяет настроить количество сигналов

Dream Wall Street представляет собою визуализацию уровней поддержки сопротивления индикатор отмечает уровни которые образованы на свече, чей тиковый объем превышает средний объем он отлично подойдет как сам без фильтров для скальпинга по уpовням так и подойдет как дополнение к уже существующей торговой системе может быть использован как фильтр индикатор уже настроен настраивать вам ни чего ну нужно настройки вам позволяют настроить света уровней.

Are you using Awesome Oscillator? Wonder at which High and Low prices this indicator colored Green? Red? This indicator helps you determine those limits. GET 20% OFF for renting for 1 year! Yellow line is called Upper Line, and Red line is Lower Line.
BUY SIGNAL In this case, last bar's AO color would be colored Green.
Both Open and Low Price above the Lower Line. Close price crosses the Upper Line from below.
SELL SIGNAL In this case, last bar's AO color would be colored Red. Both Open and

Индикатор тренда, который показывает направление разворотных точек. Можно использовать с оптимальным коэффициентом риска к прибыли. Вероятность успешного тренда очень высока. Стрелками показывает благоприятные моменты и направления для входа в рынок. Использует один параметр для настройки (регулировать от 1 до 3). При работе тейк-профит значительно больше стоп-лосса! Работает на всех валютных парах и на всех таймфреймах.

The Divergent Accuracy indicator is designed to identify discrepancies on the price chart of a currency pair. The Divergent Accuracy indicator recognizes bullish and bearish divergences, and can also output a signal that a divergence has been detected... In addition to identifying divergences, the indicator works with overbought and oversold levels, and also shows arrows to enter the market...

This mutlitimeframe indicator is based on my own indicator wich shows trends at a early stage . You will see the trends from M1 to Month timeframe . The more the value is high ,the more the trend is confirmed .The values above 100 determine a high trend . Medium trend : 50 <=Value<100 No trend : 50<Value You can set alert for each timeframe and for your own value . Meaning of the parameters: M5|1: .....is the indicator's value on the 1st bar for M5 timeframe M5|2: .....is the indicator's va

https://www.mql5.com/en/users/earobotkk/seller#products FIBO ARROW This indicator draws a Fibonacci Retracement based on daily time frame. It draws arrows, sends pop-up alert and phone notification whenever price crosses Fibonacci levels. This tool is useful for users who trade with Fibonacci. INPUT ON Alert: set to true will pop-up alert whenever arrow appears. ON Push: set to true will send phone notification whenever arrow appears. ===== FIBO(High & Low)===== Time Frame: Fibonacci is drawn f

Большинство из тех, кто торгует на Форексе, знает о системе волнового анализа Эллиота. Так что же это такое волновой анализ: Это изучение и анализ цены, а не её производных (различные индикаторы); Возможность определение ценовых целей с использованием инструментов Фибоначчи (волны Эллиотта теснейшим образом связаны с числами Фибоначчи). Можно получить чёткую картину рынка на всех временных масштабах; При помощи EWA возможно построение торговой системы с чётким описанием входов и выходов. Для
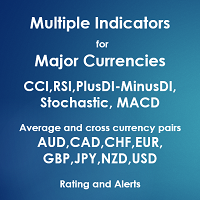
Multiple Indicators for Major Currencies
The purpose of this indicator is to save time to detect more good trading opportunities by scanning all 28 cross currency pairs of AUD, CAD, CHF, EUR, GBP, JPY, NZD and USD in the same time. There are 5 indicators included in this indicator which are CCI, RSI, Stochastic, MACD and the different between plusDI and minusDI of ADX (PlusDI-MinusDI). The indicator can help in determining the following properties of each currency depending on which indicator

Пинбар — это лишь 1 свечка или бар, представляющая собой цену, что отскочила от максимального или минимального ценового уровня. Свечка открылась, цена пошла в одном направлении и затем резко развернулась за период свечи — так формируется пинбар. Пинбар легко заметить — длинная тень (хвост), маленькое тело. Запомните: не все свечи с длинным хвостом являются пинбарами. Только когда хвост намного больше тела свечи, формируется пинбар. Как правило, рынок при этом закрывается там, где открылся или по

Индикатор WiseBW упрощает процесс принятия решений, распознавая развороты с помощью встроенного алгоритма, а затем подтверждает сигналы на уровнях поддержки/сопротивления. Таком образом индикатор отслеживает рыночный тренд с непревзойденной надежностью, игнорируя резкие колебания рынка и шумы вокруг средней цены. Индикатор можно использовать как для пипсовки на мелких периодах, так и для долгосрочной торговли. Параметры: updown - смещение пипсах для отступа от значков; back - сколько баров учит

Индикатор связывает цену по циклично-волновой зависимости используя скользящие средние. Таким образом, все точки пересечения будут оптимальными точками, в которых изменяется движение с учетом периода индикатора. Точки пересечения можно использовать как точки потенциального разворота рынка. Но не надо забывать, что подход должен быть комплексным, сигналы индикатора требуют дополнительной информации для входа в рынок.

ComplexPulse - импульсный индикатор или сигнальный. Чувствительный и быстро реагирует на ценовые движения. Индикатор показывает взаимозависимость различных валютных пар, а именно: USD, EUR, GBP, CHF, JPY. Валюты измеряются в относительных единицах, поэтому в каждую единицу времени сумма всех валют будет равна нулю. Отсюда один из основных элементов кластерных индикаторов является линия нуля, или линия баланса (нулевая линия). Если какая-то валюта находится ниже линии баланса, то говорят, что вал

Индикатор Analytic System - это полноценная торговая система. Он состоит из 2 частей: Первая - это стрелочки, показывающие наиболее оптимальные точки открытия и закрытия сделок. Стрелка вверх - сигнал на покупку,стрелка вниз - на продажу. Индикатор использует сложные аналитические алгоритмы, при помощи которых система определяет моменты входов и выходов. Вторая - это информационная панель в правом верхнем углу. Крупным шрифтом обозначена цена, справа от неё показано текущее направление тренда (в

Технический индикатор Currency Heat Wave Ultimate — это ценный инструмент, который предоставляет трейдерам информацию о силе основных валют в режиме реального времени. Благодаря анализу 28 валютных пар он предлагает всесторонний обзор силы валюты прямо на графике, что делает его невероятно удобным в использовании. Динамически меняя цвета, он позволяет трейдерам быстро определять позиции валют и принимать обоснованные решения. Одной из примечательных особенностей Currency Heat Wave является е

Индикатор RegressionXP рассчитывает два типа регрессии и вычисляет среднеквадратичную девиацию цены на данном диапазоне. Важна прямая золотая линия (регрессия первой степени), показывающая направление и состояние текущего тренда на выбранном таймфрейме. Чем больше угол с горизонталью, тем сильнее тренд. Таким образом, мы имеем возможность делать выводы относительно состояния валютной пары по текущему расположению цены относительно линии регрессии. На расстоянии от золотой линии проходят параллел

Индикатор TrendLSMA , очень надежный поскольку создан на основе скользящих средних. Особенность TrendLSMA это наличие сигнала для входа/выхода - линия индикатора определённым цветом обозначает сигналы "buy" или "sell". Точность этого сигнала очень высока, сответствие 95% удач на 5% неудач. TrendLSMA также подойдет для выхода из позиции. Индикатор захватывает практически полностью тренд, но во время флета необходимо использовать фильтры. При входе в позицию, вы всегда будете работать "по тре

Scalpinez - готовая система для скальпинга. Индикатор сам анализирует рынок и дает трейдеру понятные сигналы на открытие и закрытие ордеров. Так же индикатор дает рекомендации по размеру ТейкПрофита. СтопЛосс - обратный сигнал. То есть, если у нас есть открытый ордер на продажу и у него еще не сработал ТейкПрофит, при этом появляется синяя стрелка на покупку - ордер на продажу закрываем. Таким образом работа с индикатором Scalpinez сводится к тому, чтобы следовать его указаниям. Стратегия торго
MetaTrader Маркет - единственный магазин, где можно скачать демоверсию торгового робота и подвергнуть его проверке и даже оптимизации на исторических данных.
Прочитайте описание и отзывы других покупателей на заинтересовавший вас продукт, скачайте его прямо в терминал и узнайте, как протестировать торгового робота перед покупкой. Только у нас вы можете получить представление о программе, не заплатив за неё.
Вы упускаете торговые возможности:
- Бесплатные приложения для трейдинга
- 8 000+ сигналов для копирования
- Экономические новости для анализа финансовых рынков
Регистрация
Вход
Если у вас нет учетной записи, зарегистрируйтесь
Для авторизации и пользования сайтом MQL5.com необходимо разрешить использование файлов Сookie.
Пожалуйста, включите в вашем браузере данную настройку, иначе вы не сможете авторизоваться.