Смотри обучающее видео по маркету на YouTube
Как купить торгового робота или индикатор
Запусти робота на
виртуальном хостинге
виртуальном хостинге
Протестируй индикатор/робота перед покупкой
Хочешь зарабатывать в Маркете?
Как подать продукт, чтобы его покупали
Технические индикаторы для MetaTrader 4 - 119

Анализ нескольких таймфреймов валютной пары в одном окне может вас запутать.
Для анализа нескольких таймфреймов вам нужны надежные индикаторы.
Один из них использует 9TF STOCH RSI.
Я работал день и ночь, чтобы создать простой, но надежный код, покрывающий все девять таймфреймов всего в одном индикаторе.
Давайте рассмотрим некоторые преимущества этого индикатора:
Красочная гистограмма. Цвет кривой на каждом таймфрейме отличается друг от друга. Стрелки, указывающие на пересечение основн

Pivot Point Indicator (Poivt)
ClassicMode indicator calculation formula (ClassicMode):
pp=(High+Low+Close)/3.0
s1=2*pp-High
s2=pp-(High-Low)
s3=Low-2*(High-pp)
r1=2*pp-Low
r2=pp+(High-Low)
r3=High+2*(pp-Low)
Woodie Mode indicator calculation formula (WoodieMode):
pp=(High+Low+2*Close)/4.0
s1=2*pp-High
s2=pp-(High-Low)
s3=Low-2*(High-pp)
r1=2*pp-Low
r2=pp+(High-Low)
r3=H
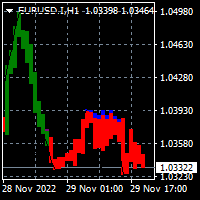
To download the MT5 version of Donchian Trend Ribbon please click here . This is inspired by TradingView: "Donchian Trend Ribbon" By "LonesomeTheBlue". As MT4 does not support HISTOGRAM bars to be customized I decided to adjust the donchian ribbon on candle chart. The result is one of the coolest indicators out there to detect trend direction and strength. The indicator is loaded light and non-repaint. Note: Please adjust candle width via input tab depending on your choice of chart zoom. Thanks
СИГНАЛ ОТКРЫТИЯ OSW
(МЕТАТРЕЙДЕР 4)
Вы хотите работать, ломая взлеты и падения? это идеальный индикатор для получения сигналов от входа такого типа.
Как только индикатор запустится, он не покажет вам никакого сигнала, но по мере роста цены он будет читать рынок, пока не найдет идеальный паттерн для прорыва.
Индикатор для чтения максимумов и минимумов имеет специальную настройку для Зигзага, что позволяет брать только самые подходящие.
Как и любой индикатор, он не дает идеальных входов
DepthTrendView is an indicator that is used to see the direction of the market very clearly compared to the indicators that are commonly used by many people.
What is interesting about this indicator is that you can see the direction of the trend and also know that the market is at the end or that the market wants to start a new trend.
How to Use: 1- To see the earliest BUY direction you need to see previous candle below Aqua Line before green arrow appear.
2- To see the earliest SELL dire

MA Revolution is upgraded version of standard Moving A verage. With the current upgrade moving average line got more sensitive with different market conditions. It gets more flexible by decreasing default period step by step while market is sharp and incrasing period back to default period step by step while market is normal again. testing of the ide a shows th at this upgr aded version gives much more acur acy for detecting m arket direction, ch anges in direction are shown much e arly th an
Разместите индикатор на графике, желательно с таймфреймом H1 или H4. Если вы торгуете в дневном диапазоне или, наоборот, на младших таймфреймах — вам нужно будет соответствующим образом настроить уровни RSI и ATR. Синие стрелки индикатора будут сигналом к открытию длинной позиции, красные стрелки — сигналом к открытию короткой позиции: 1) Синяя стрелка для лонгов (рост) и красная стрелка - для шортов (спад). 2) Две горизонтальных линии для текущих позиций (одна для входа и одна для стопа). 3)
This indicator is very useful for those who trade with investor techniques. That's why I named it InvestorTool. Why investors? Isn't this a tool for trading? This indicator is basically to help investors to identify which pairs are very close to their All-Time-Low or All-Time-High. So that the investor will quickly spot which instruments are "relatively" at its low cost, and telling the minimum equity required.
If the pair is close to All-Time-Low then investor can put a buy position. Whe

NOTE: PRICE WILL RISE VERY SOON. DON'T SKIP THIS OFFER! Dear traders I am glad to introduce the " Market Swing Scanner Board" indicator to you. This indicator was made mainly to be used in combination with the Market Swing Index Indicator. You use the "Market Swing Scanner Board" indicator to scan for trading opportunities on the Market Swing Index Indicator . This tool is designed for serious traders who have decided to make a difference through trading. Be the next person to witness this st

Analyzing multiple time frames of a currency pair in one window can make you confused. To analyze multiple time frames, you need reliable indicators. One of them is using 9TF RSI MA . I've been working day and night to create code that is simple but reliable and covers all nine time frames in just one indicator . Let's look at some of the advantages of this indicator: Colorful histogram . The color of the curve in each timeframe is different from one another. Arrows indicating the crossing of
KT Trend Exhaustion is our personal implementation of the famous Trend Exhaustion Index developed by Clifford L. Creel, Ph.D., in 1991.
The change in price direction often comes with uncertainty. TEI helps to tackle the uncertainty by showing a crisp direction using the smoothed color-changing index.
Features
Easy to use and interpret. It comes with a multi-timeframe scanner that scans the upcoming signals across all the time-frames. It can be used as an entry signal or trend confirmation
KT Know Sure thing is a momentum oscillator based on the smoothed rate of change over four different timescales and was developed by Martin Pring. In 1992, Pring published the initial description of the indicator in Stocks & Commodities magazine's "Summed Rate of Change (KST)" article. KST creates a momentum oscillator by combining the price momentum measurements from four different price cycles. Traders can utilize KST to search for bullish or bearish divergences, signal line crossovers, and ce
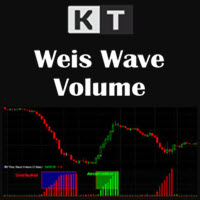
The KT Weis Wave Volume is a technical indicator based on the current market trend and description of the price movement's direction. The indicator is based on volume and displays the cumulative volumes for price increases and decreases in the price chart.
In addition, the indicator window shows a histogram of green and rising red waves.
The green color represents upward movement; the more the price rises, the larger the green volume. The red color represents a decreasing wave; the larger t
KT Forex Line can be described as an improved version of the moving average indicator. The indicator is embedded in the main trading chart and features a line that switches between blue and white depending on the prevailing direction or mood of the market.
Utilizing the indicator is simple. You do not need to understand complex graphs and intricate lines. Recognize the indicator line's color and trade accordingly.
Key Features
The indicator has customizable colors, with the blue and red b

The KT Market Speed is a unique and straightforward oscillator-based technical analysis tool that helps traders visualize the speed at which the price of an instrument changes based on the preset length. The Market Speed representation helps correctly map the price momentum: is it moving fast, slowing down, or trapped in a range? These are the questions the indicator answers, giving traders more bandwidth to execute better-informed trade positions.
Formula
It's a simple technical analysis t

KT Forex Super Scalper is created to identify market trends and plot trade signals based on the direction of the predetermined trend. It functions very similarly to moving averages but reacts quickly to changes in price actions and can signal right away once a valid trend is confirmed. The quick reactionary feature makes it a valuable tool for scalpers. However, anyone familiar with moving averages can use it for actual trading because of its signaling process and chart demonstration simplicity

The double top bottom pattern is arguably one of the technical analysis's most popular chart patterns. These patterns are used to capitalize on recurring patterns and identify trend reversal patterns, thereby creating well-placed entry and exit levels. The KT Double Top Bottom is based on these patterns and fine-tunes the trade signal development process for traders.
Features
It's based on one of the most reliable trading patterns and brings some fine-tuning and automation to the process. A
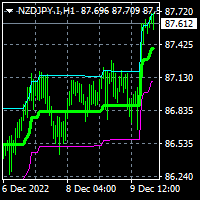
To dowload MT5 version please click here . This is the exact conversion from TradingView: "Range Filter 5min" By "guikroth". - This indicator implements Alerts as well as the visualizations. - Unlike the MT5 version it does not support HeikenAshi and candle colors. - This indicator lets you read the buffers for all data on the window. For details on buffers please message me. - This is a non-repaint and light processing load indicator. - You can message in private chat for further changes you ne

PLEASE LEAVE US A 5-STAR REVIEW LDS Scalper User Manual+ Extra LDS CSDIF INDICATOR + Training Videos ABOUT LDS SCALPER INDICATOR STRATEGY Built on 15+ years of trading experience. LDS Scalper is a very powerful trading indicator for scalping strategy, returns very high accuracy rate in forex, futures, cryptocurrencies, stocks and indices. This indicator displays arrow signals based on price action information with high accuracy. The LDS Scalper Indicator strategy when applied can turn a ne
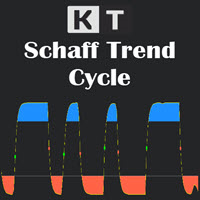
The Schaff Trend Cycle (STC) is a technical analysis tool that helps traders and investors plot highly-probable predictions on the price direction of an instrument. Due to its predictive properties, It's a good tool for foreign exchange (forex) traders to plot buy and sell signals. The Schaff Trend Cycle was developed by prominent forex trader and analyst Doug Schaff in 1999. The idea driving the STC is the proven narrative that market trends rise or fall in cyclical patterns across all time fr
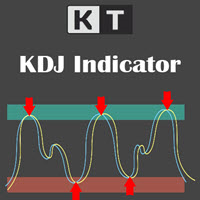
Basic technical analysis tools use signals during market changes by providing critical information that can influence investment and trading decisions. Several technical analysis tools are developed for this purpose, and one of the most popular indicators traders use the KDJ Random index. It's known as the Random Index, is primarily a trend-following indicator that aids traders in identifying trends and prime entry points.
Features
It analyzes and projects changes in trends and price patte
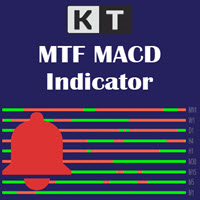
As a trader, monitoring multiple timeframes simultaneously will help you better understand the trend and know when multiple timeframes are in agreement or disagreement. The KT Multiple Time Frame (MTF) MACD displays the overall direction of an instrument in one chart by showing the moving average convergence divergence (MACD) for all time frames. The indicator displays a simple table with the respective MACD trend for each timeframe. You can also see whether MACD is gaining or losing momentum ac

Confluence Indicator is unique indicator which collects differnt popular indicators and analyzes their data. It decides an overall trend with its strength. It is not only helpful for identifying the the current picture of the market but also helps traders to stay away from non trending market. It maximize the chance of winning by giving an aggregate picuture of markets best reliable technical indicator settings There are total 7 types of signal which this indicator provides. Each candle will sho

WARNING!! THIS SWORD IS TOO SHARP! ONLY 10 COPIES LEFT FOR THE NEXT PRICE TO BE 8,000$ FOR UNLIMITED PLAN. Dear traders I am very glad once again to introduce to you my other tool called "Forex Sword Indicator". In short this tool is meant to give you an edge over the market that you have been waiting for so long. Now, here it is. It is a very very simple tool but yet a dangerous sword. I call it a Holy grail indicator!. I will not talk a lot about this tool. Just let the tool speak by itse
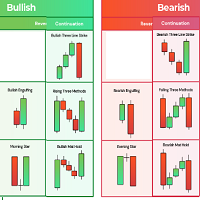
simple indicator based on some candle patterns recognition arrows appear on candles when bear signal / bull signal based on candle pattern recognition two strategies available you can enable / disable them indicator can work on any chart and time frame i prefer to work on high time frames especially the Daily charts D1 red arrows appears above candle showing a bear signal after candle completed - arrow will be blue during candle formation Green arrows appears below candle showing a bull signal a
The Ichimoku indicator is an entire system by itself with an amazing win rate many traders feel that the chart looks like a mess when we add the indicator to the chart this is because there are too many elements present in the indicator we have a solution for that now "TT Ichimoku on off button indicator" ABOUT THIS INDICATOR This is an Ichimoku indicator that has the toggle feature separately for every element ie. Kumo cloud button, kijun button, etc... you can also hide/show the indicator
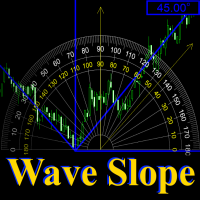
Wave Slope - работает на основании индикатора ZigZag и предназначен для измерения наклона текущей волны, в градусах. Чем острее угол наклона - тем сильнее тренд. И на этом можно построить торговую систему. В настройках можно подключить индикатор ZigZag, установить цвет и ширину линии наклона. А также можно включить и выключить звуковой сигнал, который срабатывает в случае изменения наклона волны.

What Is the Coppock Curve? The Coppock Curve is a long-term price momentum indicator used primarily to recognize major downturns and upturns in a stock market index. It is calculated as a 10-period weighted moving average of the sum of the 14-period rate of change and the 11-period rate of change for the index. It is also known as the "Coppock Guide."
Example of How to Use the Coppock Curve Apply the Coppock Curve to a weekly/monthly price chart of a stock index or stock index exchange traded

Hercules is a trend indicator which is a very powerfull tool to enter into the position at right time. it also indicates the the rangebound areas very easyly. Its visual representation is same like supertrend . But it is more advanced then super trend . If you combine the entry signal of multiple time frame it would give 98% accuracy in most of the symbols. Additional Features Notification Alerts Email Arrow for buy and sell signals Easyly accesible buffers for EA development
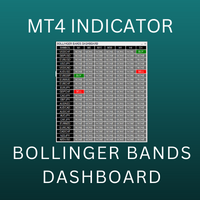
Bollinger Bands Multi Dashboard MT4 uses the value of Bollinger Bands indicator. This dashboard will monitor all symbols in the market watch. We can set up to receive an alert, notification or an email when the buy/sell signal appear on each timeframe. You can check all symbols via only 1 chart. This dashboard will check almost popular time frame (M1,M5,M15,M30,H1,H4 and D1). The colors can be customized. We can have a look at many pairs and many time frames without opening the chart. In additio
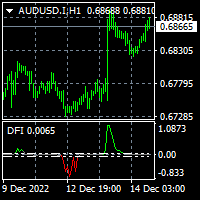
To download MT5 version please click here . - This is the exact conversion from TradingView: "Trend Direction Force Index - TDFI [wm]" By "causecelebre". - This indicator uses multiple levels of averaging to detect trend strength. - You can optimize filter low and filter high levels to achieve best results. - You have access to buffers to use in EAs. - This is a light-load processing and non-repaint indicator. - You can message in private chat for further changes you need.

Analyzing multiple time frames of a currency pair in one window can make you confused. To analyze multiple time frames, you need reliable indicators. One of them is using 9TF MACD Limited Bar . I've been working day and night to create code that is simple but reliable and covers all nine time frames in just one indicator . Attention! When first installed, the indicator does not look intact. Changing the timeframe will solve the problem. Let's look at some of the advantages of this indicator: C

Analyzing multiple time frames of a currency pair in one window can make you confused. To analyze multiple time frames, you need reliable indicators. One of them is using 9TF STOCH RSI LIMITED BAR . I've been working day and night to create code that is simple but reliable and covers all nine time frames in just one indicator . Attention! When first installed, the indicator does not look intact. Changing the timeframe will solve the problem. Let's look at some of the advantages of this indicat

Наиболее важным ценовым уровнем в любом "Профиле объема" является "Точка контроля" . Это ценовой уровень с наибольшим торговым объемом. И в основном это уровень, на котором крупные игроки начинают свои позиции, так что это уровень накопления/распределения для умных денег.
Идея индикатора возникла после того, как сделали индикатор "MR Volume Profile Rectangles" . При создании индикатора "MR Volume Profile Rectangles" мы потратили много времени на сравнение объемов с объемами из профиля объемов
This indicator will help you a lot to caculate all of your orders ( Both real current orders and pending orders) for all of your charts ( Calculation separately in each charts). And it will show you the direction of each chart (Settlement lot) that it's BUY, SELL or HEDGING with how many lot. For example, your EURUSD is 0.6 lots BUY (totally), but GBPUSD is 1.5 lots SELL (totally) and BTCUSD is HEDGING with total BUYs 0.5 lot and total SELLs 0.5 lot. (including summar
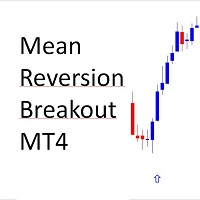
!! FLASH SALE !! Over 80% off !! For ONE week only. Now only $47 - normally $297! >>> Ends on 30 June 2023 - Don't miss it!
Buy and Sell Arrows when price breaks away from mean price. Sends Alerts – On MT4 To Your Phone To Your Email
Does not repaint .
Works on any Forex pair, any timeframe.
10 Activations allowed so you are free from limitations >> MT5 Version Here
For spreads from a tiny 0.1 pips RAW/ECN Accounts, click here . Check out my Waka Esque EA signal here: >

Индикатор Magic SMA очень помогает в определении направления тренда. Он может стать отличным дополнением к вашей существующей стратегии или основой для новой. Мы, люди, можем принимать лучшие решения, когда лучше видим визуально. Поэтому мы разработали его, чтобы отображать разные цвета для восходящих и нисходящих трендов. Каждый может настроить это так, как ему больше всего подходит. Установив период тренда, мы можем оптимизировать его для более длинных или коротких трендов для нашей стратегии

Индикатор Magic EMA очень помогает в определении направления тренда. Он может стать отличным дополнением к вашей существующей стратегии или основой для новой. Мы, люди, можем принимать лучшие решения, когда лучше видим визуально. Поэтому мы разработали его, чтобы отображать разные цвета для восходящих и нисходящих трендов. Каждый может настроить это так, как ему больше всего подходит. Установив период тренда, мы можем оптимизировать его для более длинных или коротких трендов для нашей стратегии

Индикатор Magic LWMA очень помогает в определении направления тренда. Он может стать отличным дополнением к вашей существующей стратегии или основой для новой. Мы, люди, можем принимать лучшие решения, когда лучше видим визуально. Поэтому мы разработали его, чтобы отображать разные цвета для восходящих и нисходящих трендов. Каждый может настроить это так, как ему больше всего подходит. Установив период тренда, мы можем оптимизировать его для более длинных или коротких трендов для нашей стратеги

Индикатор Magic SMMA очень помогает в определении направления тренда. Он может стать отличным дополнением к вашей существующей стратегии или основой для новой. Мы, люди, можем принимать лучшие решения, когда лучше видим визуально. Поэтому мы разработали его, чтобы отображать разные цвета для восходящих и нисходящих трендов. Каждый может настроить это так, как ему больше всего подходит. Установив период тренда, мы можем оптимизировать его для более длинных или коротких трендов для нашей стратеги

Dear Traders this is my another tool called " Swing Master Indicator ". As the name above the indicator is designed to help you in swing trading by capturing the low and highs of the price. You may us this tool with any trading strategy and style from scalping to position trading. It is made for level of traders including newbies and advanced traders even prop-firms, hedge funds and banks to help them make sold market analysis. I create tools for serious traders who want to make a difference in

Индикатор LineMagnit для MT4 - высокоточный индикатор, который строит уровни поддержки и сопротивления, притягивающие к себе цену по принципу магнита. Это позволяет трейдеру легко определить наиболее вероятные точки входа и выхода из рынка, а также определить направление сил в рынке так как уровни строятся на основе вливаний капитала в инструмент. Индикатор LineMagnit оснащен интуитивно понятным графическим интерфейсом, который позволяет быстро находить и анализировать уровни поддержки и сопро
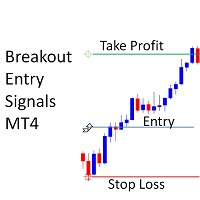
!! FLASH SALE !! Over 80% off !! For ONE week only. Now only $47 - normally $297! >>> Ends on 30 June 2023 - Don't miss it!
Buy and Sell Alerts when price breaks out following strict price action. Sends Alerts – On MT4 To Your Phone To Your Email
Does not repaint .
Works on any Forex pair, any timeframe.
10 Activations allowed so you are free from limitations >> MT5 Version Here For spreads from a tiny 0.1 pips RAW/ECN Accounts, click here . Check out my Waka Esque EA sig

QCAFE+ Trend Filters is a simple but useful for Traders to eliminate false signal from all kinds of Buy/Sell signal indicators. With QCAFE+, Traders can identify UP Trend/DOWN Trend or SIDEWAY period of Market to decide whether Enter a Trade or Not. With 5 Elements of Filters which are shown the Momentum and Strength of the Market; Each element has 3 types of arrows to show Uptrend (Blue UP arrows), Down Trend (Orange Down arrows) or Sideway (Grey Arrows). The Top Element is the main signal tha
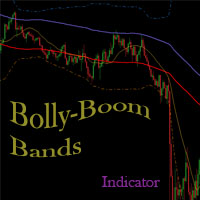
Bolly Boom Bands is an indicator which identifies when a Trend is strong and when it is not, hence it is just a lateral oscillation of the price which can push you to waste money opening inconsistent positions. It is so easy to use and similar to kind-of Bollinger Bands with Fibonacci ranges, it will be useful to find those channels where you should wait if price is inside or when these are broken to start operating into the trend area... As you can imagine it is recommended for opening position

Показывает стрелками точки разворота цены. Работает на всех таймфреймах и всех валютных парах. Подходит как для скальпинга, так и для долгосрочной торговли. Когда появляется синяя стрелка, нужно открывать ордер на покупку. Когда появляется красная стрелка, нужно открывать ордер на продажу. Рекомендуемые таймфреймы M5, M15, H1, H4. Лучшие результаты индикатор показывает на GBPUSD, XAUUSD, EURUSD, USDJPY, AUDUSD, USDCHF, EURGBP, EURJPY, EURCHF и другие основные пары. Этот индикатор хорошо подходи
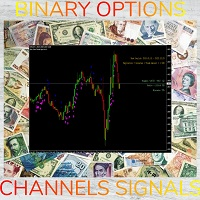
SYSTEM INTRODUCTION: The Binary Options Channels System Is Specifically Designed For Binary Options Trading. Unlike Other Systems And Indicators That Were Adopted From Other Trading Environments For Binary Options. Little Wonder Why Many Of Such Systems Fail To Make Money . Many End Up Loosing Money For Their Users. A Very Important Fact That Must Be Noted Is The Fact That Application Of Martingale Is not Required. Thus Making It Safer For Traders Usage And Profitability. A Trader Can Use Fi
SYSTEM INTRODUCTION: The Binary Options Momentum System Is Specifically Designed For Binary Options Trading. Unlike Other Systems And Indicators That Were Adopted From Other Trading Environments For Binary Options. Little Wonder Why Many Of Such Systems Fail To Make Money . Many End Up Loosing Money For Their Users. A Very Important Fact That Must Be Noted Is The Fact That Application Of Martingale Is not Required. Thus Making It Safer For Traders Usage And Profitability. A Trader Can Use Fi

What is a Point of Interest? Traders who follow Smart Money Concepts may call this a Liquidity Point, or where areas of liquidity have been built up by retail traders for for Big Banks to target to create large price movements in the market. As we all know, retail traders that use outdated and unreliable methods of trading like using trendlines, support and resistance, RSI, MACD, and many others to place trades and put their stop losses at keys points in the market. The "Big Banks" know these me

TradeMo — это 100% точный сигнальный индикатор, который реагирует только на поведение цены. Таким образом, когда 8-линейная скользящая средняя пересекает 10-линейную скользящую среднюю, ожидайте сигнал на покупку, а когда 8-линейная скользящая средняя пересекает 10-линейную скользящую среднюю, ожидайте сигнал на продажу. Вот и все! Посмотрите, как я объясню, как я его использую здесь .
Индикатор настраивается на все таймфреймы, но я рекомендую использовать более высокий таймфрейм, например, 1

VaviStar - это индикатор, основанный на коррекциях тренда, определяемых сегментами ZigZag.
Предполагается, и статистика подтверждает, что акции реагируют на определенные уровни коррекции. Многие используют уровни коррекции Фибоначчи (23,6%, 38,2%, 61,8%).
Предполагается, что как только цена выйдет за пределы 61,8% коррекции, мы уже можем говорить о развороте тренда.
Данный индикатор позволяет комфортно отобразить сегмент Зигзага с выбранными относительными рабочими уровнями. С разворотным

Double top and bottom indicator is a pattern scanning indicator which scans the tops and bottoms using zig zag pattern. When it find price bouncing back from the same point twice after a long trend then it generate arrow signals whenever the last resistance points is broken for double bottom and last support price broken for double top. Unlike other top bottom scanner it does not give only 1 signal. it alerts user when ever the last support /resistance is broker from double top/bottom pattern un

Dear Trader It is my pleasure to introduce to you my tool called the " Forex Sniper Indicator" . The major aim of this tool is to help serious traders and investors in all type of Financial Markets to catch price next movement right at the moment the price direction is about to change. This tool can be used to snipe the price direction in both down trend, uptrend and ranging markets. This tool can be used as the stand alone tool though it may be combined with other tools as well. My goal is to h

Fibo Quartz. It has a special fibonnaci where the indicator is placed and it adapts only to any temporality, works great for forex, all pairs. for crypto also if any broker offers. special for scalping and intraday With the indicator alone and the candles you can get high percentages of profit. That's why the Quartz fibo is made. World Investor. MT4!!!!!!!!!

Buy Sell Professional. It consists of an automated buying and selling strategy according to the arrow that appears on the graph and the alarm that goes off every time you mark a sale or purchase. Special for scalping and intraday. It works for all forex pairs, and if the broker has crypto too! The indicator also has a moving average, trix and mom to capture each movement of the market!

Uses a trend filter to plot the lines and arrows. Great for scalping. Settings: TrendPeriod: change to your preference. Alerts. How to use: Can be used on any time frame. Attached to chart, and wait for arrow to appear on multiple timeframes. Buy : - Blue arrow and blue line cross below price on multiple time frames; e.g., on D,W,M or H1,H4,Daily or M30,H1,H4 Sell : - Yellow arrow and red line cross above price on multiple time frames; e.g., on D,W,M or H1, H4, Daily or M30,H1,H4
**Best r
Контроллер DYJ RSI - это полностью валютная торговая система RSI.
Он может отображать значения RSI для каждой валютной пары от M1 до MN.
Когда значение RSI цикла достигает области перепродажи и зоны перепродажи,
Вы можете сделать правильную сделку на основе этой информации. Сделайте шаблон индикатора RSI с именем DYJ RSI и сохраните его
Когда вы нажимаете кнопку мыши на зоне гиперпродажи или зоне гиперпокупки, автоматически открывайте диаграмму соответствующей валюты к циклу и загружайт

Bank Executive Indicator Uses A Simple method of tracking price as it moves across the chart and signals when a potential long or short position is active and indicates this to the trader giving you the opportunity to take a position on the market. Or you can simply use this indicator to give yourself signals and determine if you want to take the trade or learn the strategy on your own.
To measure the daily range, sell when above 30 pips in the European or US session, buy when below 30 pips in the European or US session. Take profit only around 30 pips because this is only an indicator for daily trading. FEATURES : Sum Range, max 30 Show Rectangle
Show Level
OC SR Line Width OC SR Line Color Show Label
Custom Label Position
Custom Font Label
Custom Font Size
Custom Mark Session
Show Line Break Event Point

Median Renko Terminator works best with renko charts if you do not have a renko chart generator I will email it to you for free and give you the correct settings for scalping or to swing trade NON-REPAINT COMES WITH ALERTS WHEN THERE IS A SIGNAL Conditions to sell: big purple arrow shows you the direction first then you take the small purple arrow to enter the same direction of the purple arrow. Conditions to buy: big white arrow shows you the up direction first then you take small white arrow
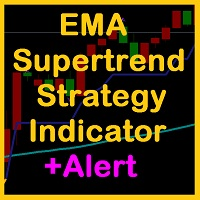
Exponential moving average (EMA) and super trend are popular and good indicators that is often and used to determine the trend direction. One of the best trading strategies with trailing stop is trading strategy with using a combination of Exponential Moving Average (EMA) and Super Trend indicators. EMA SuperTrend Strategy Indicator is the indicator consist of EMA, Super Trend and Alert function also other calculations are needed. It's also has extra indicator there are Automated Fibonacci Retr

Bank Expert Indicator Uses A Simple method of tracking price as it moves across the chart and signals when a potential long or short position is active and indicates this to the trader giving you the opportunity to take a position on the market. Or you can simply use this indicator to give yourself signals and determine if you want to take the trade or learn the strategy on your own. The Signals From this indicator are targeted at long-term positions and focus on top quality call outs.
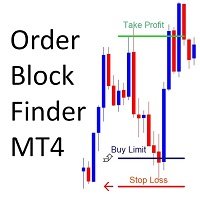
!! FLASH SALE !! Over 80% off !! For ONE week only. Now only $47 - normally $297! >>> Ends on 30 June 2023 - Don't miss it!
Sends Alerts – On MT4 To Your Phone To Your Email
Does not repaint .
Works on any Forex pair, any timeframe.
10 Activations allowed so you are free from limitations >> MT5 Version Here
For spreads from a tiny 0.1 pips RAW/ECN Accounts, click here . Check out my Waka Esque EA signal here: >> High Risk Settings or Medium Risk Settings .
What Is An
The indicator is coded to be suitable for every parity and every period. The purpose of the indicator is to capture the correct signal levels. The product is equipped with all notification and alarm options. In this way, you will be able to receive signals even if you are not at the screen. The product tries to find the signals in the trend direction as a strategy. Thus, it is more reliable. you have input signals. For default settings, recommended periods should be M15,M30,H1.

Innovative Max Min swing This is a really different indicator for drawing Max and Min on the charts. This indicator draws Min and Max levels in a innovative way, based on a volatility proprietary calculation. In this way you will be able to draw trendlines in an objective way and also to see the break of Max and Min levels. You have three paramaters you can play with, in order to suite the volatility to your trading style. The indicator works on every time frame. Added: - Sound Notification
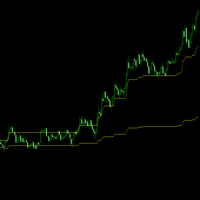
Is the market ranging (balance) or trending (Imbalance) ? This indicator exports a huge concept used in volume analysis (value area) into the price action. It makes it on Intraday level. How to read it? Simple! But you need to make practice. Making profit in market is more than a 2-rule system.
When the price inside the lines, the market is in "range mode".
If the price is above the upper line, the market is trending up.
If the price is below the lower line the market is trending down

Clear trend filter This is a filter-trend indicator. From the settings you can select to use more filter or less. The very interesting part of the indicator comes out using with all the filter. In this way you can follow the trend easily even when the market is without a strong trend, but is instead more flat. I personally use it on 1 minutue timeframe with MORE FILTER (you can select it from the input setting) in order to have an overlook of trend in the market. Added: - Sound Notificatio
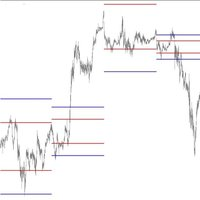
Equilibrium Levels support resistence Intraday indicator --> it means it works on lower TimeFrames , from 1minute to 4hours. This indicator is able to calculate and draw 2 levels (1 support and 1 resistence) representing the Barycenter's levels for a specific day session. From the setting you can choose only one parameter, that's the lenght of Barycenter's orbit. I personally attach the same indicator 2 times on the same chart, inputting as orbit: 0.15 and 0.30. Then what you will no
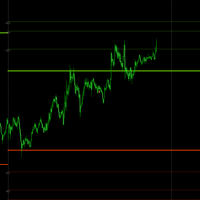
This indicator draws the projections of Fibonacci above the yesterday high and below the yesterday low. Why?
1) First of all, in this you can take the pulse of the market (trend or range). For instance If the price runs above yesterday's high the trend is UP.
2) In this way you will have automatic targets for the trend
3) you can wait the market on excess levels for contrarian and low risk trades.
If you buy the product feel free to contact me for additional tips or info.
I wish you
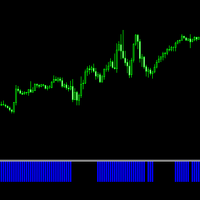
This is a clear and simple filter I've created based on a Ichimoku strategy and setup. I personally like to use the indicator in a multi timeframe approach. It can be used in a double way:
1) Every time the indicator change the colour, you can use the this first change as your trigger point.
2) You can follow the indicator for the trend direction and trade with your other signals.
Added: - Sound Notification - PopUp Notification - Mobile Push Notification (To make it work follow
MetaTrader Маркет предлагает каждому разработчику торговых программ простую и удобную площадку для их продажи.
Мы поможем вам с оформлением и подскажем, как подготовить описание продукта для Маркета. Все продаваемые через Маркет программы защищаются дополнительным шифрованием и могут запускаться только на компьютере покупателя. Незаконное копирование исключено.
Вы упускаете торговые возможности:
- Бесплатные приложения для трейдинга
- 8 000+ сигналов для копирования
- Экономические новости для анализа финансовых рынков
Регистрация
Вход
Если у вас нет учетной записи, зарегистрируйтесь
Для авторизации и пользования сайтом MQL5.com необходимо разрешить использование файлов Сookie.
Пожалуйста, включите в вашем браузере данную настройку, иначе вы не сможете авторизоваться.