Do Thi Phuong Anh / Profil
- Bilgiler
|
1 yıl
deneyim
|
18
ürünler
|
16
demo sürümleri
|
|
0
işler
|
0
sinyaller
|
0
aboneler
|
ADX MA: The Ultimate Trend Strength Guide In forex trading, the Average Directional Index (ADX) is a vital indicator for gauging trend strength. Here's a streamlined approach to using ADX for effective trading: 1. Add ADX to your forex chart. 2. Interpret ADX values: <20 is weak, >40 is strong. 3. Identify trend direction: +DI above -DI indicates an upward trend, and vice versa. 4. Execute trades based on ADX and trend: Strong up trend, consider buying; strong down trend, consider
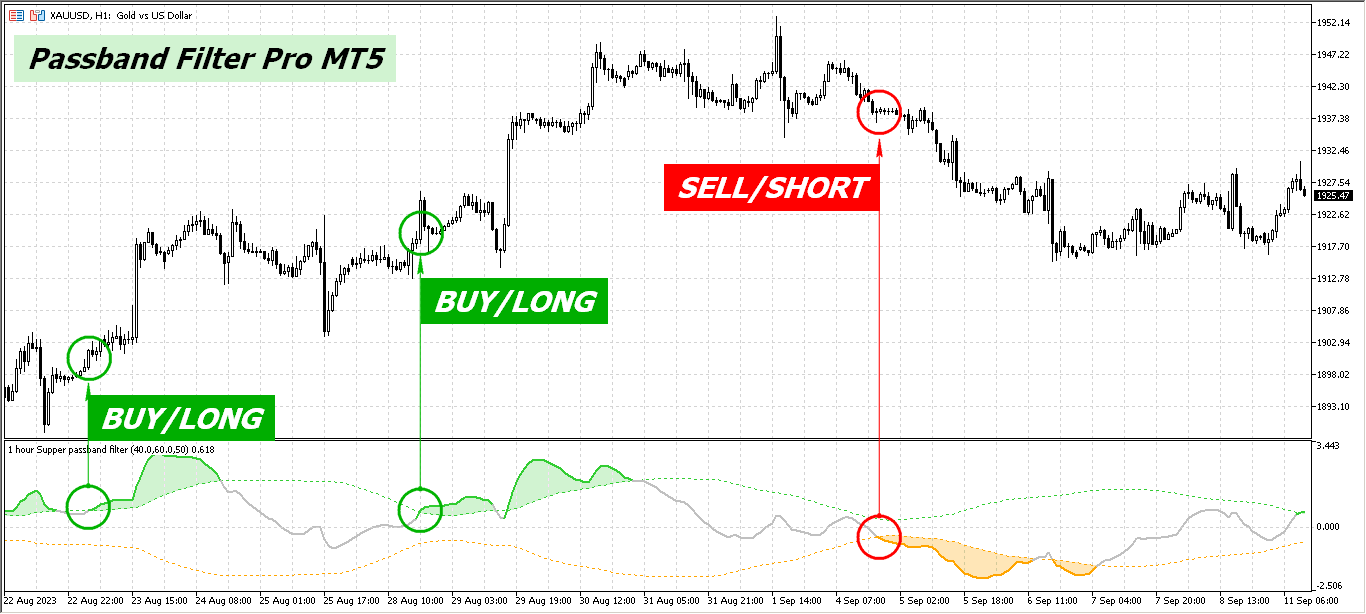
✨ Key Features:
- Dual EMA approach (40 and 60 periods)
- RMS cyclic envelope for trigger points
- Versatile buy/sell signals
- 22 price types for flexibility
📈 How to Use:
- Buy when pass-band crosses above -RMS line
- Short when pass-band crosses below RMS line
🔗 https://www.mql5.com/en/market/product/105155
Supercharge your trading strategy with the Passband Filter Pro!

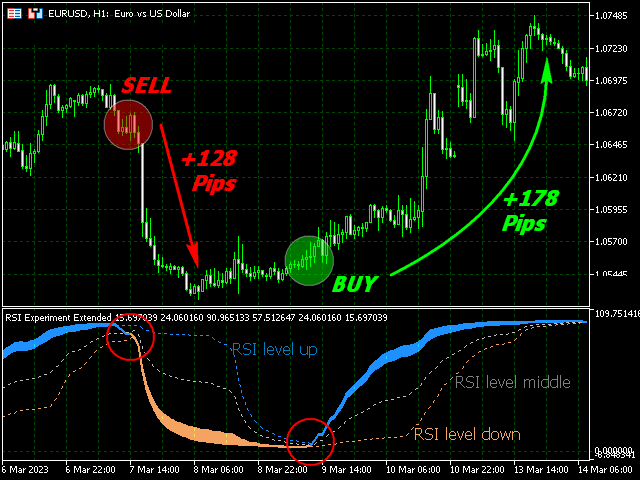
✨ Features:
- Enums for flexible price and RSI calculation methods.
- Customizable inputs: RSI period, price type, smoothing method, look-back period.
- Floating levels adapt dynamically based on historical data.
🔄 Indicator Components:
- RSI fill, up line, middle line, down line, and trend line stored in index buffers.
- Each bar calculates RSI and smoothed price.
- Floating levels determined by look-back period.
- Signals: Sell - RSI above middle, smoothed price above upper. Buy - RSI below middle, smoothed price below lower.
📊 Elevate your trading strategy with this innovative MT5 RSI Experiment! 🔍💹 #Forex #Trading #MT5Indicator #RSIExperiment
=========
https://www.mql5.com/en/market/product/109233

Forex traders often observe increased market activity near Supply and Demand zones, which are levels formed based on zones where strong price movements have previously occurred. The Supply Demand Strong Weak Confirm Indicator utilizes fractals and the ATR indicator to identify and plot support and resistance zones on the price chart. These zones are categorized as follows: - Weak: significant high and low points in the trend. - Untested: crucial turning points in the price chart that the price
Unlock the power of precision in Forex trading with WAE! 🌐💹
✅ Buy & Sell Signals
✅ Trend Power Assessment
✅ Momentum Explosion
🟢 Green Bars = Bullish Trend
🔴 Red Bars = Bearish Trend
📊 Signal Line: Your Momentum Guide!
📈 Buy Setup:
Entry: Green bar crosses above threshold.
Exit: Close when the bar turns red.
📉 Sell Setup:
Entry: Red bar crosses below threshold.
Exit: Close when the bar turns green.
WAE is a robust standalone signal generator, blending trend & momentum. 🔄📊 For maximum impact, integrate it into your comprehensive trading strategy! 🌐📈 #ForexTrading #WAEIndicator #TradingStrategies
========
🚀🚀🚀 https://www.mql5.com/en/market/product/108590
========
📉💵 Market Watch: The dollar takes a breather! 🤔💭 Traders are closely analyzing the possibility of a Fed rate cut, adding a touch of softness to the dollar. 🌐💼 How will this impact your #Forex game? Stay tuned for the unfolding dynamics! 📈🔍 #TradingTalk #MarketUpdate
1. IG - Best Overall 🏆
2. eToro - Leading in Forex Copy Trading 🤝
3. Plus500 - Perfect for Mobile Users 📱
4. Interactive Brokers - Ideal for Professionals 🎓
5. CMC Markets - Cutting-edge Platform Technology 🚀
6. Saxo Bank - Premier Web-based Trading Platform 🔗
7. Forex.com - Top Choice for Affordability 💰
8. XTB - Excellence in Research and Education 📚
Explore their unique features and find the perfect fit for your Forex journey! 💼 #ForexTrading #BrokerReviews #FinancialMarkets 🌍✨


Unveiling the Truth: Forex and Stock Trading - Legitimate Opportunities or Scams?

Smoothed Repulse Alert MT5 Indicator The Smoothed Repulse Alert for MT5 is a powerful tool that visualizes market pressure through a filled area chart and two lines in a separate window. This indicator is based on the repulse indicator, assessing buying and selling pressure using high, low, open, and close prices over a specified period. Key Features: - Customizable parameters include repulse period, moving average type, moving average multiplier, level period, upper and lower levels. - Color
MT5 RSI Experiment: This indicator leverages the Relative Strength Index (RSI) and floating levels to pinpoint potential buy and sell signals. The code uses enums for prices and RSI calculation methods. These enums define indicator parameters. Input variables include RSI period, price type for RSI calculation, smoothing method, and look-back period with levels for floating levels. Index buffers store RSI fill, RSI up line, RSI middle line, RSI down line, and trend line data. For each bar, it
The Hurst Exponent gauges a time series' long-term memory and is named after Harold Edwin Hurst. The MetaTrader's Hurst Exponent Indicator analyzes an asset's price memory, helping predict future trends. It's valuable for traders of all levels, suitable for various styles like scalping or swing trading. In Forex terms, the Hurst Exponent measures a series' dependence, indicating whether it regresses to the mean or clusters in a direction. H values between 0.5-1 suggest positive autocorrelation
The SDL Trend Signals MT5 indicator shows the market direction with a colored moving average line. It has three inputs: Period (calculation period), Method (calculation method), and Applied price (price used for calculations). The indicator has three buffers: Uptrend, Downtrend, and ExtMapBuffer (for indicator values). The Bullish slope is in BLUE, and the Bearish slope is in RED. For example, an upward slope indicates a Bullish market (Blue), and a downward slope indicates a Bearish market
Definition of Forex:
Forex, short for Foreign Exchange, involves exchanging one currency for another. Consider it like exchanging your home currency for Japanese Yen before a trip.
Making Money in Forex Trading:
To profit in Forex, open an account with a broker for access to the currency market. Currency rates fluctuate, providing opportunities. For example, if the Euro to USD rate goes from 1.15 to 1.10, a €10,000 exchange could yield a profit of €500.
Key Points Before Starting:
- Trading isn't a shortcut to overnight wealth.
- It's a business that demands time and effort.
- Patience is crucial for long-term success.
Conclusion:
Trading can change your life, offering flexibility and financial independence. However, it's not always easy and requires commitment. Remember, success in Forex takes time.
Thanks for reading! If you found this helpful, consider giving it an upvote. Happy trading!
SDL Trend Signals is a custom MQL4 indicator named "Slope Direction Line" for MetaTrader 4. It employs weighted and simple moving averages to create customizable trend lines on charts. Using two trend line buffers (Uptrend and Downtrend) and one for indicator values (ExtMapBuffer), the indicator calculates trend lines. Bullish slopes appear in BLUE, signaling an upward trend, while Bearish slopes are in RED, indicating a downward trend. In a Bullish trend, traders can enter a BUY position with
The MT4 Channel Standard Deviation Indicator automatically plots support and resistance channels on the price chart using price standard deviation. It indicates BULLISH and BEARISH market conditions and is suitable for both new and advanced forex traders. This indicator offers support, resistance, entry, and exit levels, along with stop-loss and take-profit points. It accurately identifies BULLISH and BEARISH market trends, making it effective for both intraday and long-term trading across
What are Heiken Ashi Candles? Heiken Ashi, derived from the Japanese term 'Heikin Ashi,' translates to average price bars. It's an indicator depicting price bars on a chart. Formula for Heiken Ashi candles: - Heiken Ashi opening price: (previous candle's opening + closing price) / 2 - Closing price Heiken Ashi: (opening + high + low + closing) / 4 - Heiken Ashi peak: Max of high, opening, or closing price - Heiken Ashi bottom price: Min of low, opening, or closing price How to Read Heiken Ashi
Trend channels are vital tools in technical analysis for identifying optimal buy or sell points. - Upper Line: Marks resistance. - Lower Line: Marks support. - Tops and bottoms of channels indicate potential support or resistance zones. - Bearish Channels: Negative slope (down). - Bullish Channels: Positive slope (up). Creating Channels: - Up Channel: Draw a parallel line matching the uptrend angle
Introducing ZigZag Extras MT4, a Forex indicator that simplifies market analysis: - Visualizes highest highs and lowest lows over a specified "Depth" period. - Highlights potential reversal points with filled blue and red dots. - Optional display of BreakOut points, indicating probable peaks and bottoms. - Helps avoid common pitfalls of mistaking repainted points for market tops or bottoms. - Designed to enhance understanding and serve as signals for various trading strategies. Instructions: 1


