sathish kumar / Profil
HAI, I AM TRADER. I HOPE YOU ALL DOING WELL.
I USE FIBONACCI RETRACEMENT, SUPPORT AND RESISTANCE
I USE FIBONACCI RETRACEMENT, SUPPORT AND RESISTANCE
Arkadaşlar
549
İstekler
Giden
sathish kumar
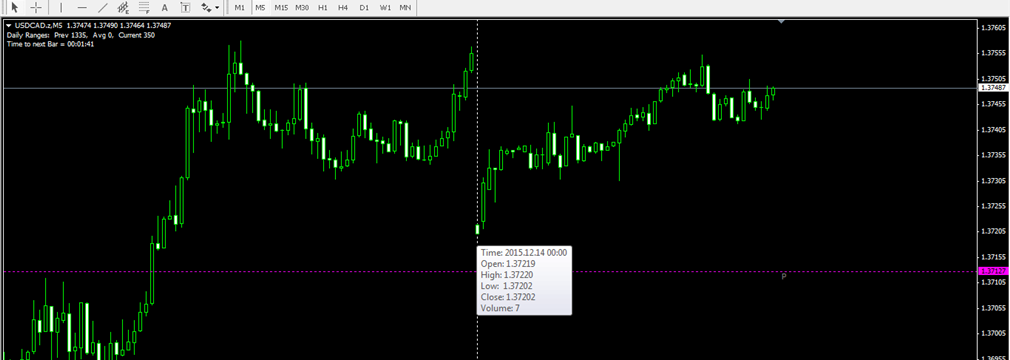

USDCAD STRONG RALLY IN LAST WEEK, TODAY IT OPEN GAP DOWN BY 30PIPS USDCAD LAST WEEK CLOSED @ 1.3755 MARKED OPEN @ 1.3722 AFTER GAPDOWN,USDCAD BACK TO PREVIOUS WEEK CLOSING PRICE 1.3755...
sathish kumar


EURUSD 4HOUR: eurusd form bullish ascending triangle continuation pattern. momentum is still extremely strong here and we can except eurusd to rally this week...
sathish kumar
Forex economic events for 14.12.2015 gönderisini yayınladı
14.12.2015 00:01Rightmove House Price Index (YoY) (December) Currency: GBP, Importance: Low...
sathish kumar
ROBOFOREX OFFER:No commission for funds withdrawal: gönderisini yayınladı
no commission for funds withdrawal December 8th December 15th December 22nd December 29thEvery Tuesday in December, we compensate the client’s expenses for one funds withdrawal application...
sathish kumar
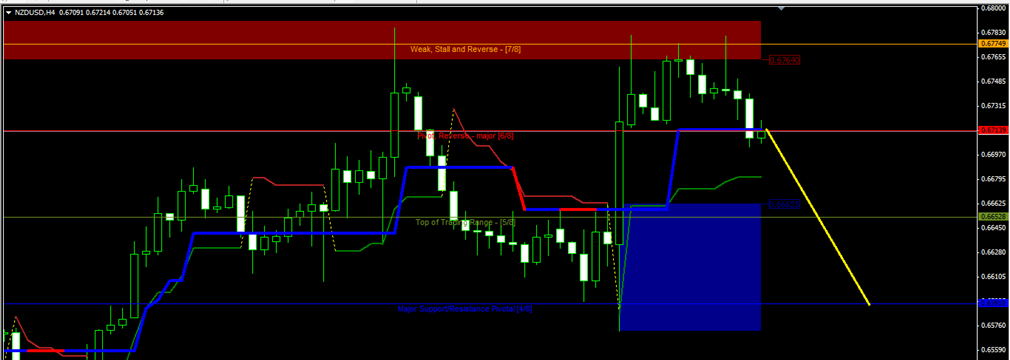

ZD USD, “New Zealand Dollar vs US Dollar” New Zealand Dollar has TESTED 7/8 level four times, which means that it facing ressistance , at least. If the pair breaks Super Trends and stays below them, the market may continue falling. price may reach 4/8...
Sosyal ağlarda paylaş · 1
113
sathish kumar
Brokers offering Bitcoin gönderisini yayınladı
Min Account Size Regulation Registration MT4 Leverage...
sathish kumar
Forex economic events gönderisini yayınladı
13.12.2015 22:00Westpac consumer survey (October) Currency: NZD, Importance: Medium...
sathish kumar
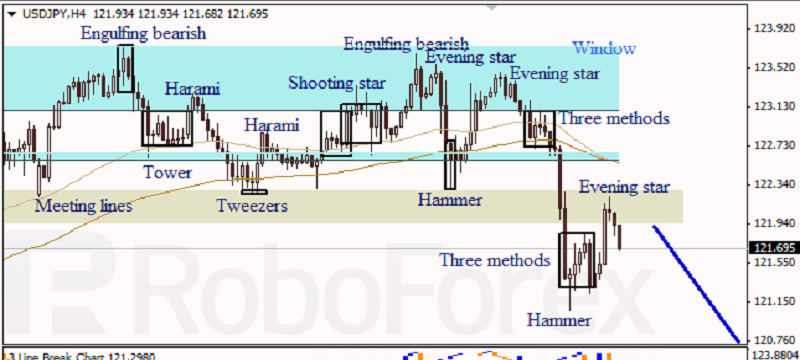

USD JPY, “US Dollar vs. Japanese Yen” At the H4 chart of USD JPY, Three Methods and Evening Star patterns, along with Three Line Break chart and Heiken Ashi candlesticks confirm a bearish movement...
sathish kumar
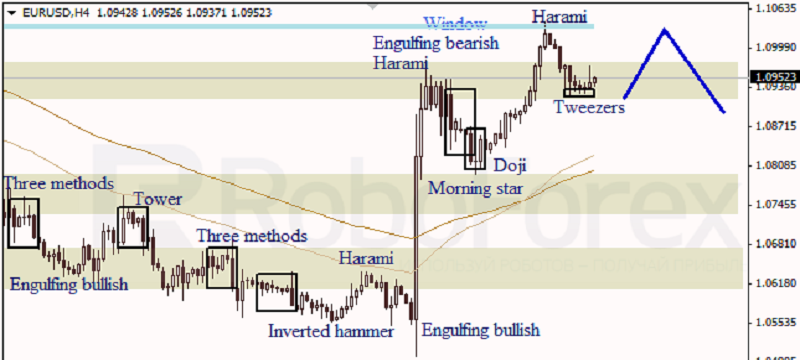

EUR USD, “Euro vs. US Dollar” H4 chart of EUR USD, bearish Harami pattern near the Window (resistance level) indicated a descending movement. Three Line Break chart confirms that a descending correction; Tweezers pattern and Heiken Ashi candlesticks show a bullish movement...
sathish kumar
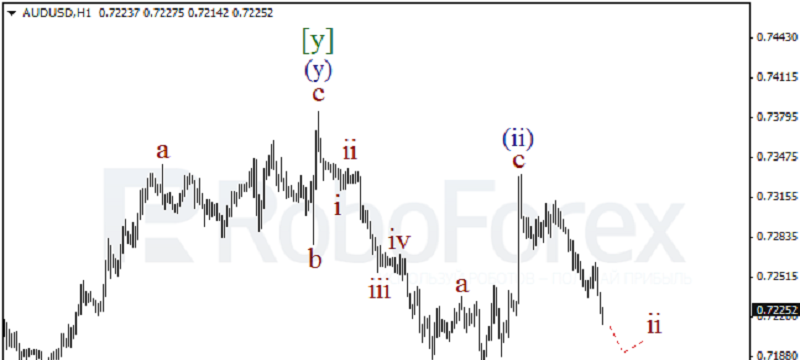

AUD USD, “Australian Dollar vs US Dollar” AT H1 chart, the market has formed the descending impulse in the wave (i). It looks like the wave (ii) has been completed as well, which means that quite soon the price may start another decline...
sathish kumar
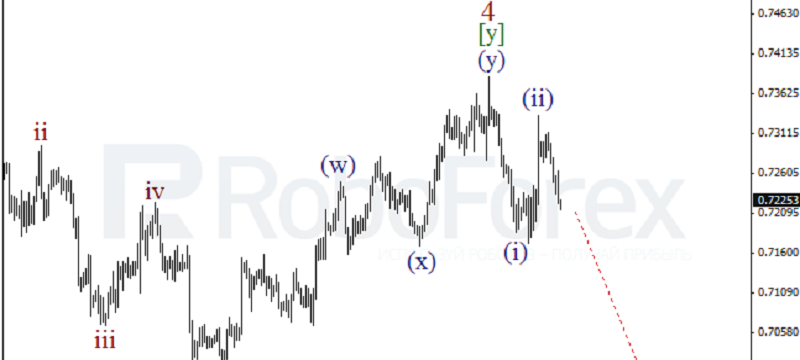

AUD USD, “Australian Dollar vs US Dollar” Australian Dollar finished the correctional wave 4 in the form of the zigzag, the descending impulse in the wave (i) and the correction inside the second wave. On Friday, the price may start falling in the wave (iii) and break its local low...
sathish kumar
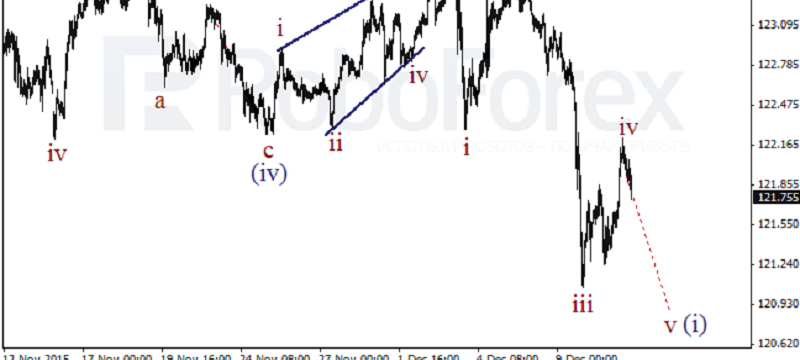

USD JPY, “US Dollar vs Japanese Yen” AT the H1 chart, the price has formed the diagonal triangle in the wave (v). it’s highly likely that the market has finished the fourth wave in the bearish wave (i). Consequently, later the price may start moving upwards in the wave v of (i...
sathish kumar
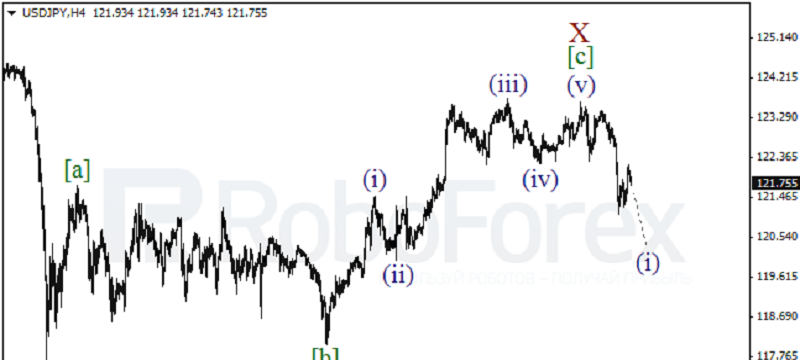

USD JPY, “US Dollar vs Japanese Yen” Yen has broken the critical level and finished the impulse in the wave [c] of the zigzag in the wave X. Consequently, the correction is moving to a higher level. In the nearest future, the pair may start forming the descending wave (i...
sathish kumar
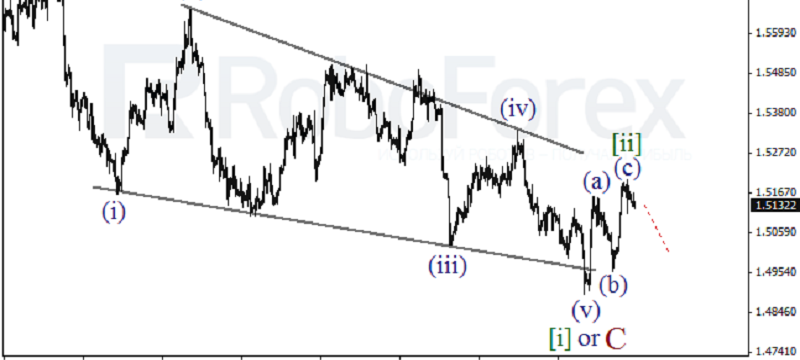

GBP USD, “Great Britain Pound vs US Dollar” After finishing the descending diagonal triangle, Pound started the correction. It looks like the price has formed the zigzag in the wave [ii]. If in the future the pair forms a descending impulse, the market will resume its decline...
sathish kumar
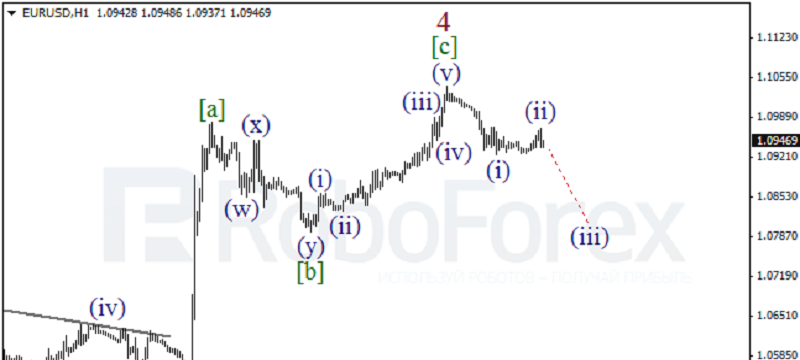

EUR USD, “Euro vs US Dollar” The pair formed the ascending impulse in the wave [с] of 4. Probably, by now the price has already finished the wave (i) and soon is about to complete the local correction. Later, the price may start falling in the wave (iii...
sathish kumar
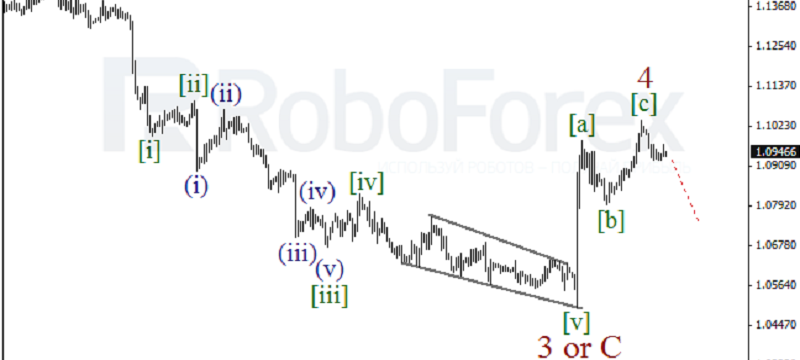

EUR USD, “Euro vs US Dollar” Eurodollar has completed the ascending zigzag in the wave 4. Earlier, the pair formed the long bearish impulse in the wave 3 or C. In the nearest future, the pair may resume its decline...
sathish kumar


Receive Christmas bonuses from RoboForex in December RoboForex is opening a season of holiday surprises for its clients. Only in December up until Christmas and New Year, you can benefit from several unique offers and presents...
sathish kumar
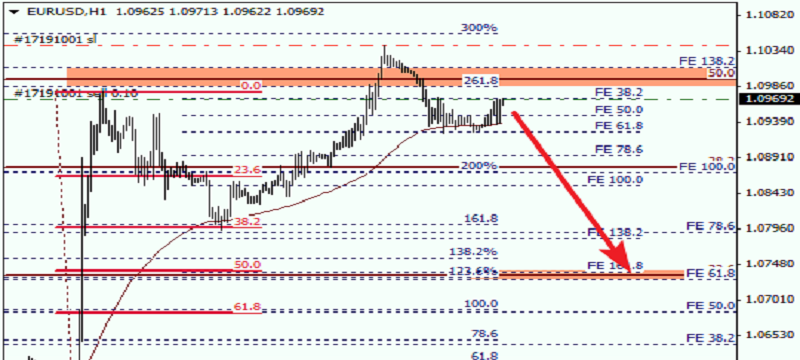

EUR USD, “Euro vs US Dollar” At the H1 chart, the price has broken Moving Average (period 34), which provided support earlier, and it means that the market may resume its descending movement. The closest target is the group of fibo-levels at 1.0735...
sathish kumar
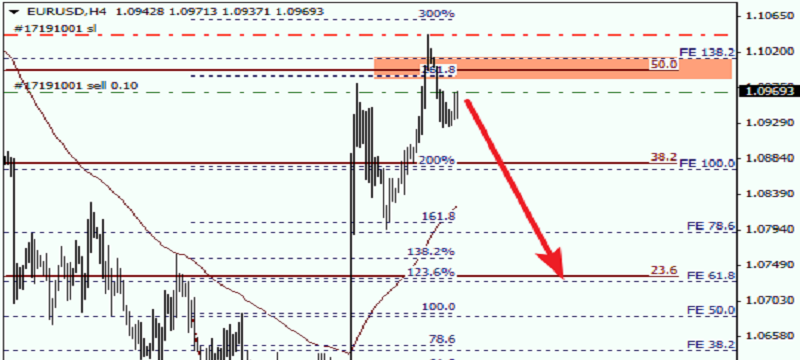

EUR USD, “Euro vs US Dollar” Eurodollar has rebounded from the group of fibo-levels near the retracement of 50%, which means that it may resume falling. It’s highly likely that in the nearest future, the pair may the market may fall towards its local low...
sathish kumar
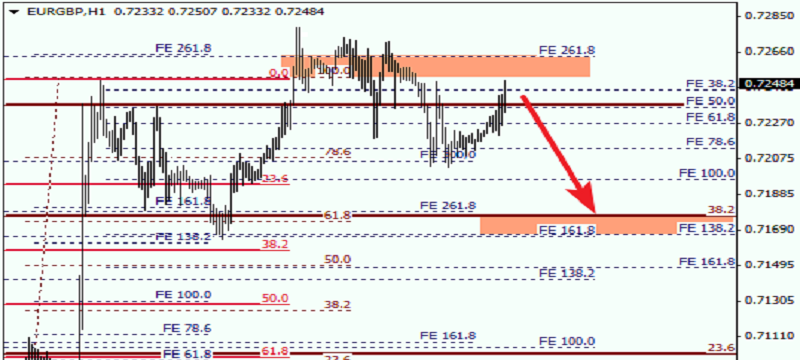

EUR GBP, “Euro vs Great Britain Pound” we can see at the H1 chart, the predicted target of the current correction is confirmed by local retracements. On Friday, the pair may fall to reach the group of lower fibo-levels at 0.7170. If the market breaks them, it may continue falling much deeper...
: