mazen nafee / Profil
- Bilgiler
|
10+ yıl
deneyim
|
0
ürünler
|
0
demo sürümleri
|
|
0
işler
|
0
sinyaller
|
0
aboneler
|
Arkadaşlar
949
İstekler
Giden
mazen nafee

mazen nafee
Konuya yorum yap AUDUSD Technical Analysis 2014, 27.07 - 03.08: Possible Reversal?
30 Min Chart Bullish TOTAL 1 [.886/.786/.382/1.272] Pattern 4 Hour Support at 0.93819 MY preference: Long positions Above 0.93711

mazen nafee

mazen nafee
Konuya yorum yap EURUSD Technical Analysis 2014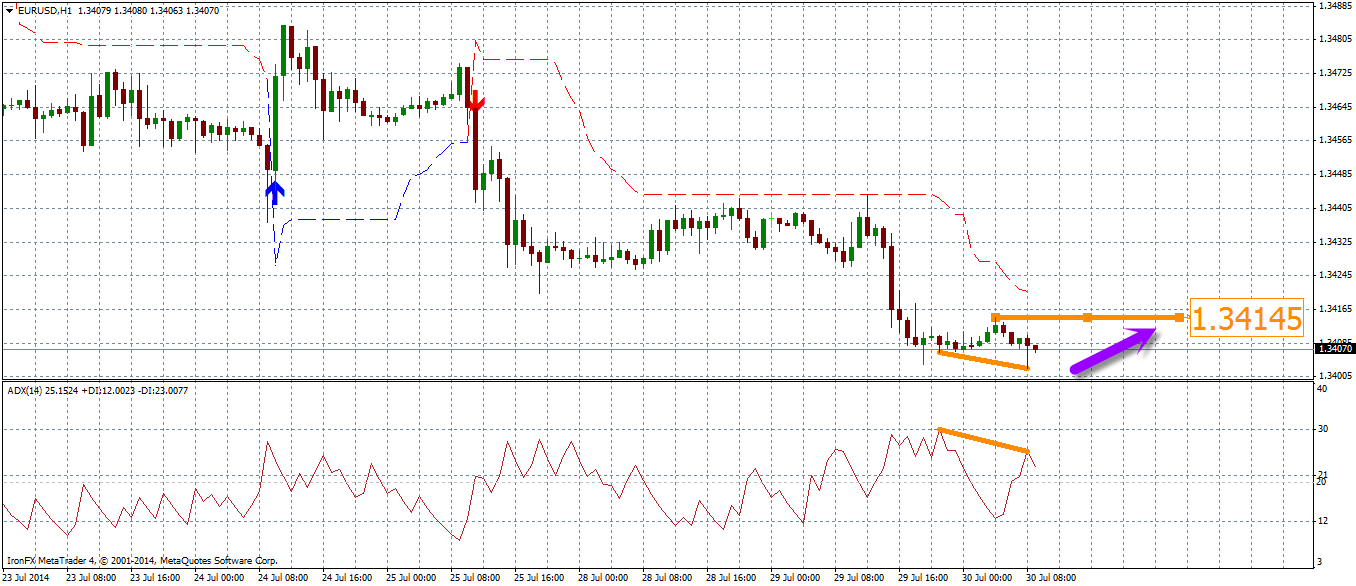
Hourly Chart Bullish Divergence (DMI-) MY preference: Long positions with targets @ 1.34145 in extension

mazen nafee

mazen nafee
Konuya yorum yap EURUSD Technical Analysis 2014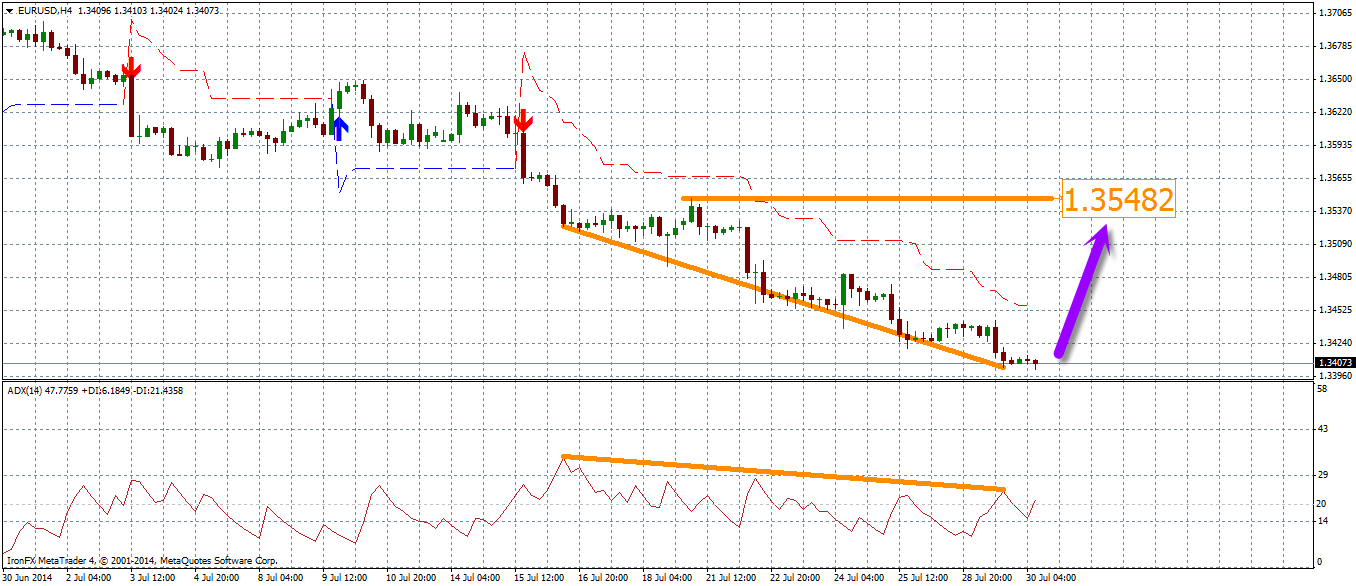
4 Hour Chart Bullish Divergence (DMI-) MY preference: Long positions with targets @ 1.35482 in extension

mazen nafee

mazen nafee
Konuya yorum yap EURUSD Technical Analysis 2014
Daily Chart Possible Bullish Divergence (DMI-) MY preference: Long positions with targets @ 1.34840 in extension

mazen nafee

mazen nafee
Konuya yorum yap EURUSD Technical Analysis 2014
Weekly Chart Bearish Divergence (DMI+) MY preference: Short positions with targets @ 1.3295 and @ 1.3135 in extension

mazen nafee

mazen nafee
Konuya yorum yap EURUSD Technical Analysis 2014
4 Hour Chart Bullish Black Swan [2.618/2.236/.382/1.414] Pattern Day Support at 1.34072 MY preference: Long positions Above 1.33974

mazen nafee

mazen nafee
Konuya yorum yap EURUSD Technical Analysis 2014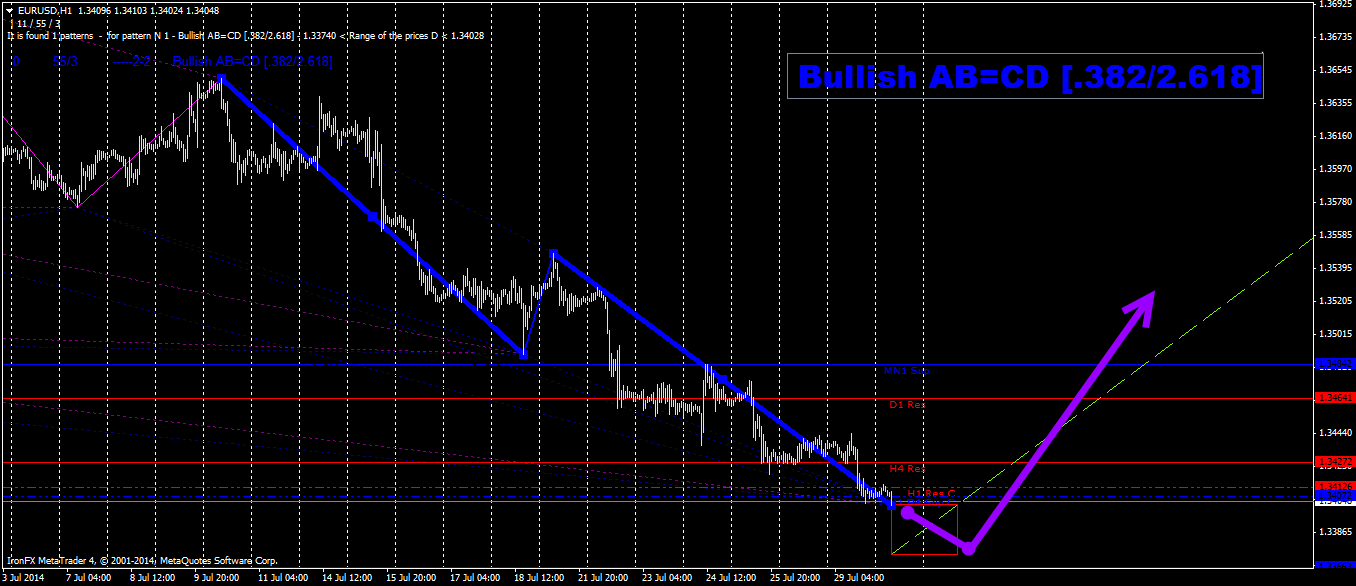
Hourly Chart Bullish AB=CD [.382/2.618] Pattern Day Support at 1.34072 MY preference: Long positions Above 1.33735

mazen nafee

mazen nafee
Konuya yorum yap EURUSD Technical Analysis 2014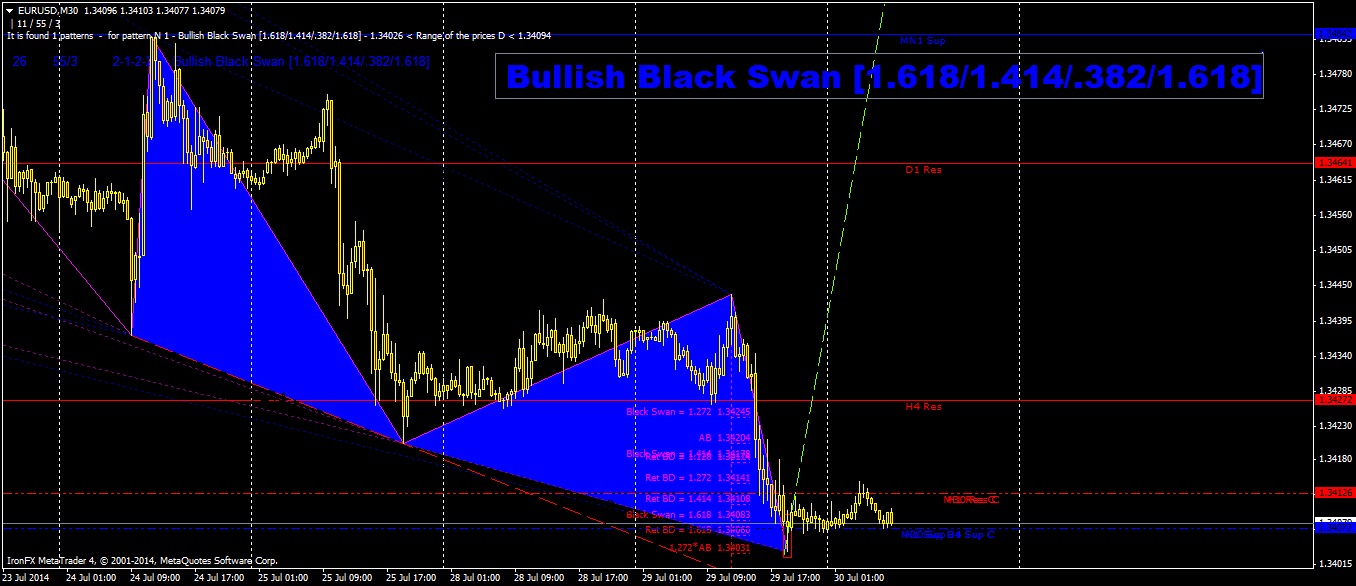
30 Min Chart Bullish Black Swan [1.618/1.414/.382/1.618] Pattern Day Support at 1.34072 MY preference: Long positions

mazen nafee

mazen nafee
Konuya yorum yap GBPJPY Analaysis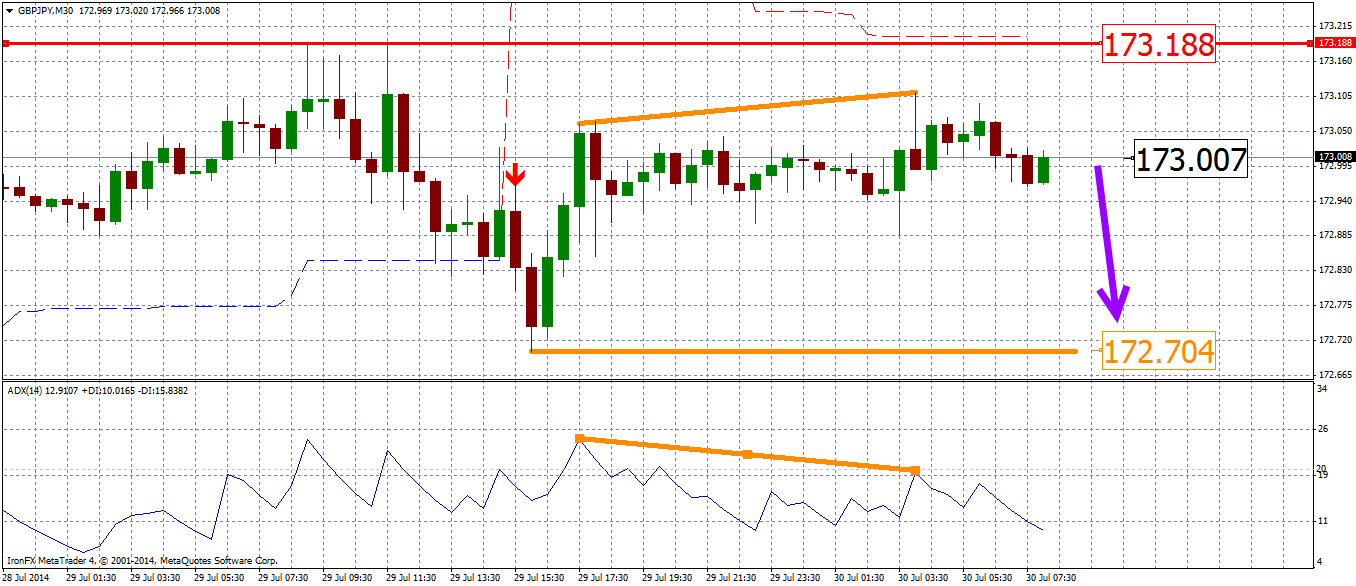
30 Min Chart Bearish Divergence (DMI+) MY preference: Short positions Below 173.188 with targets @ 172.704 in extension

mazen nafee

mazen nafee
Konuya yorum yap GBPJPY Analaysis
Weekly Chart Bearish AB=CD [2.236/.447] Pattern Month Resistance at 174.324 Week Resistance at 175.125 MY preference: Short positions

mazen nafee

mazen nafee
Konuya yorum yap GBPJPY Analaysis
Weekly Chart Bearish Divergence (DMI+) MY preference: Short positions Below 181.000 with targets @ 137.816 in extension

mazen nafee

mazen nafee
Konuya yorum yap USDJPY Analysis
Hourly Chart Bearish Divergence (DMI+) My preference: Short positions Below 102.26 with targets @ 101.708

mazen nafee

mazen nafee
Konuya yorum yap USDJPY Analysis
Daily Chart Bearish Divergence (DMI+) My preference: Short positions Below 102.26 with targets @ 101.60

mazen nafee

mazen nafee
Konuya yorum yap Indices Technical Analysis
Forum on trading, automated trading systems and testing trading strategies Press review mazennafee , 2014.07.29 14:21 Greencore Group ST: the upside prevails as long as 264.25 is support Our pivot
mazen nafee

mazen nafee
Konuya yorum yap Indices Technical Analysis
Forum on trading, automated trading systems and testing trading strategies Press review mazennafee , 2014.07.29 14:19 Opera Software ST: the RSI is oversold 78.7 is our pivot point. Our preference
mazen nafee

mazen nafee
Konuya yorum yap Indices Technical Analysis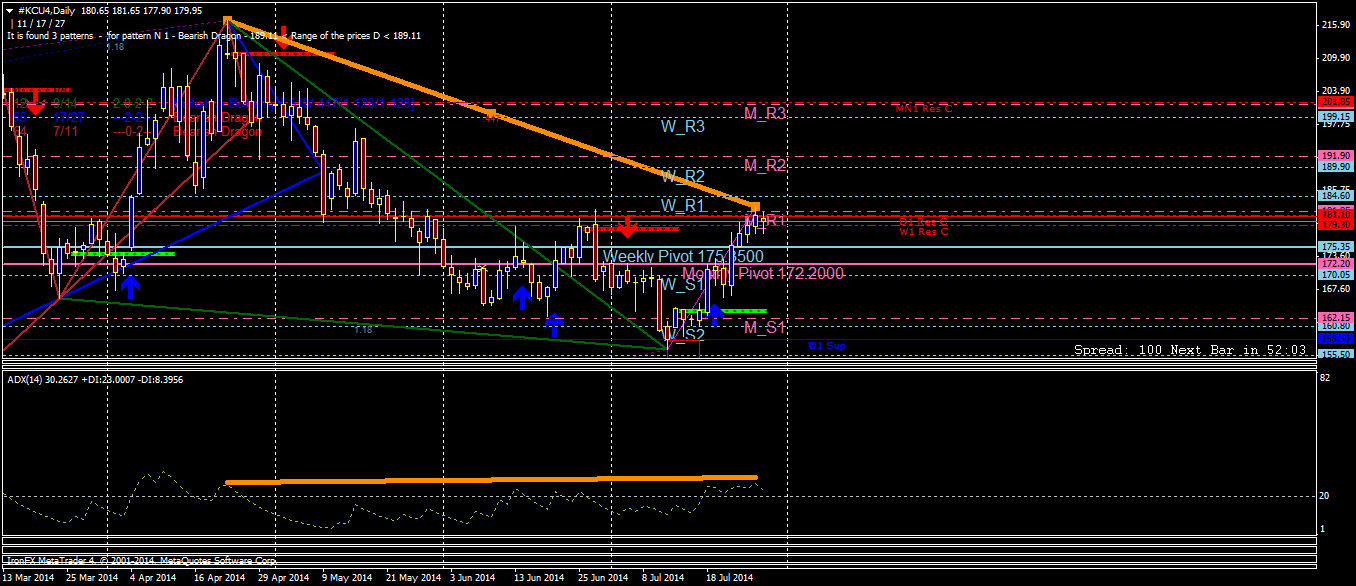
#KCU4 Daily chart ( September 2014 Arabica Coffee Futures ) Bearish Divergence (ADX) Month Resistance at 181.85 Week Resistance at 179.3

mazen nafee

mazen nafee
Konuya yorum yap Indices Technical Analysis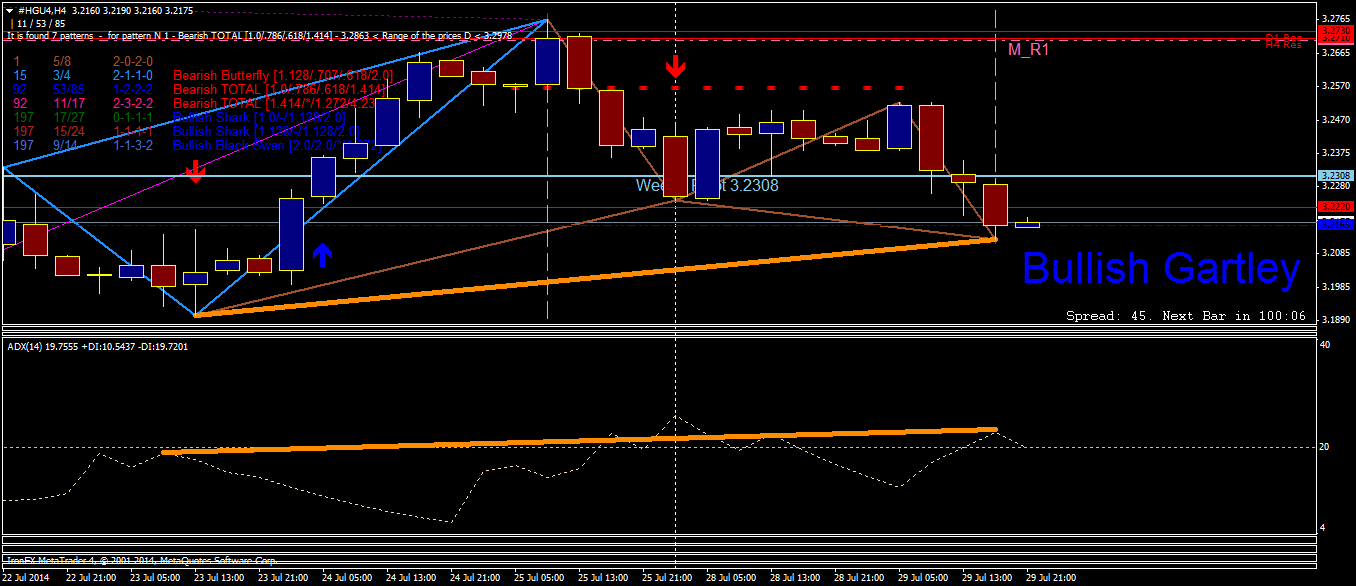
#HGU4 H4 chart ( September 2014 High Grade Copper ) Bullish Gartley [.707/.618/.5/1.414] pattern Bullish Divergence (ADX) two possible Support H4 at 3.2165

mazen nafee

mazen nafee
Konuya yorum yap Indices Technical Analysis
#HGU4 H1 chart ( September 2014 High Grade Copper ) Bullish White Swan [.618/.618/2.0/.707] Pattern Bullish TOTAL 3 [.707/*/1.128/2.236] pattern Bullish Gartley [.707/.618/.5/1.414] pattern Bullish

mazen nafee

mazen nafee
Konuya yorum yap Indices Technical Analysis
#KCU4 H4 ( September 2014 Arabica Coffee Futures ) Bearish Dragon Pattern Bearish Divergence (ADX) Month Resistance at 181.85 Week Resistance at 179.3

: