Oliver Hinrichs / Satıcı
Yayınlanmış ürünler
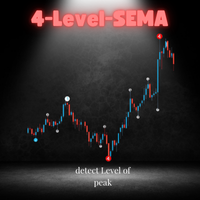
Well known to most, this indicator identifies the chart peaks and assigns the level of the peak. By classifying the peaks into levels, not only is a possible consolidation indicated but also the possible strength up to the highest level that indicates that a trend reversal is likely.
While most SEMA indicators work with 3 levels, this indicator has 4 levels.
This indicator is part of the OH-Strategy. You can view other indicators of this strategy if you click on my name as a seller.

The Gann Hi-Lo indicator is a powerful tool for trend analysis.
This modified version colors the signal line and chart candles according to the trend direction.
In an uptrend, the candles and the line appear in a bullish color, while in a downtrend, they are displayed in a bearish shade.
This makes it easier to visually identify trend changes and provides traders with clear guidance.
Thanks to the simple interpretation of the indicator, traders can quickly react to market movements and make wel
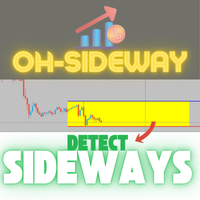
The indicator continuously calculates the current ATR value and displays it on the chart. If an adjustable threshold is undershot, a channel is automatically drawn to indicate a possible sideways movement. As soon as this threshold is exceeded again, the channel is removed from the chart. This is intended to show that the current market movements are weak and the channel shows a possible direction of a sideways movement in the market.
In addition to the threshold, the scaling of the ATR value
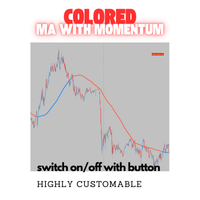
The indicator generates buy and sell signals based on a combination of a modified moving average with a trend momentum algorithm.
To ensure clarity on the chart, this indicator can be switched on and off using a freely positionable button.
Note: If you use this indicator multiple times, e.g. to display different MA periods, then you must change the "button label (ID)" in addition to the period to ensure it works. The label when pressed should also be changed accordingly for a clear overview.
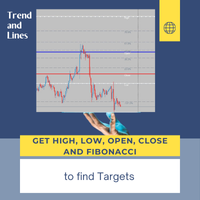
This indicator draws lines at the open, close, high and low price of the last chart candle from the set timeframe.
In addition, a label shows whether it was an up or down candle.
The standard settings follow the original idea of getting the price data from the daily timeframe for day trading/scalping, but
since this indicator is fully customizable, you can also set a different timeframe.
Based on the drawn price lines, you can then also display Fibonacci levels.
This function can also be
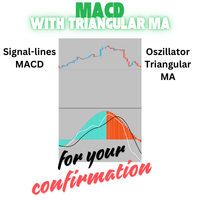
This indicator uses the signal lines of the MACD and uses Triangular MA as Oscillator. It is a good addition to trading decisions and part of the OH strategy.
Optimal trade confirmation occurs when the signal lines of the MACD coincide with the trend color of the Triangular Oscillator.
Of course everything important can be changed.
This indicator is part of the OH-Strategy, you can view other indicators of this strategy if you click on my name as a seller.
In trading, it is important to trade at the right time, which is why it is advantageous to use this indicator to display the opening of the foreign exchange markets. Define your personal trading times by setting these times with an adjustable background color. You can switch this indicator on and off using a button on the chart. This indicator is part of the OH strategy; you can view other indicators of this strategy by clicking on my name as a seller.
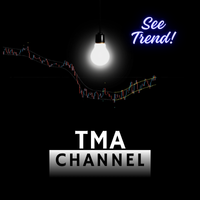
Two modified triangular MA as upper and lower bands that show the trend by changing color. If both MAs show the same color, a confirmed trend is present. The indicator can be switched on and off using a button on the chart. This indicator is part of the OH strategy. You can view other indicators of this strategy if you click on my name as a seller.
Take a look to my other indicator....
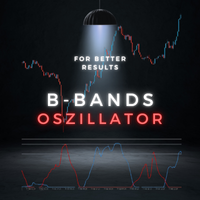
An indicator based on the Bollinger Bands principle, modified by scaled calculation of standard deviations and combined into oscillator bands make this indicator special. An up and down trend is displayed clearly and concisely and, in addition, the integrated levels 70 and 90 show the possible end of the trend or the possibility of consolidation. This indicator is part of the OH strategy. You can view other indicators of this strategy if you click on my name as a seller.

A trading robot and a manual trading panel for the Ichimoku indicator. The indicator, which was developed by Goichi Hosoda in 1930 and is essentially a complete trading system, is still used by many traders today.
I created this trading robot for this indicator.
The trading signals are monitored and clearly displayed. In addition, these trading signals can also be used from an adjustable second time frame. A trading signal is displayed depending on which signals have been activated for monito