Flavio Javier Jarabeck / Profil
- Bilgiler
|
6+ yıl
deneyim
|
87
ürünler
|
83
demo sürümleri
|
|
0
işler
|
0
sinyaller
|
0
aboneler
|
Our Motto: Disrupt. All Ways. Always.
🇳🇪🇼🇸 & 🇹🇪🇨🇭🇳🇮🇨🇦🇱 🇸🇺🇵🇵🇴🇷🇹
If you want to follow our latest additions to the MQL5 Marketplace or ask for Support on our products, follow and reach us on Telegram (English/Portuguese/Spanish language group):
https://t.me/MinionsLabsOfficial
Or, choose the way you can follow us in your own environment, at your own pace:
🇼🇪🇧 www.MinionsLabs.com
🇮🇳🇸🇹🇦🇬🇷🇦🇲 www.instagram.com/MinionsLabs
🇾🇴🇺🇹🇺🇧🇪 www.youtube.com/c/MinionsLabs
🇱🇮🇳🇰🇪🇩🇮🇳 www.linkedin.com/in/jarabeck
🇫🇦🇨🇪🇧🇴🇴🇰 www.facebook.com/MinionsLabs
🇹🇼🇮🇹🇹🇪🇷 www.twitter.com/MinionsLabs
🇷🇪🇩🇩🇮🇹 www.reddit.com/r/MinionsLabs/
🇻🇰 www.vk.com/MinionsLabs
🇲🇪🇩🇮🇺🇲 https://medium.com/@MinionsLabs
🇹🇺🇲🇧🇱🇷 http://minionslabs.tumblr.com/
🇹🇪🇱🇪🇬🇷🇦🇲 https://t.me/MinionsLabsOfficial
🇵🇮🇳🇹🇪🇷🇪🇸🇹 https://br.pinterest.com/MinionsLabs/news-from-minions-labs/
Live Long and Prosper.
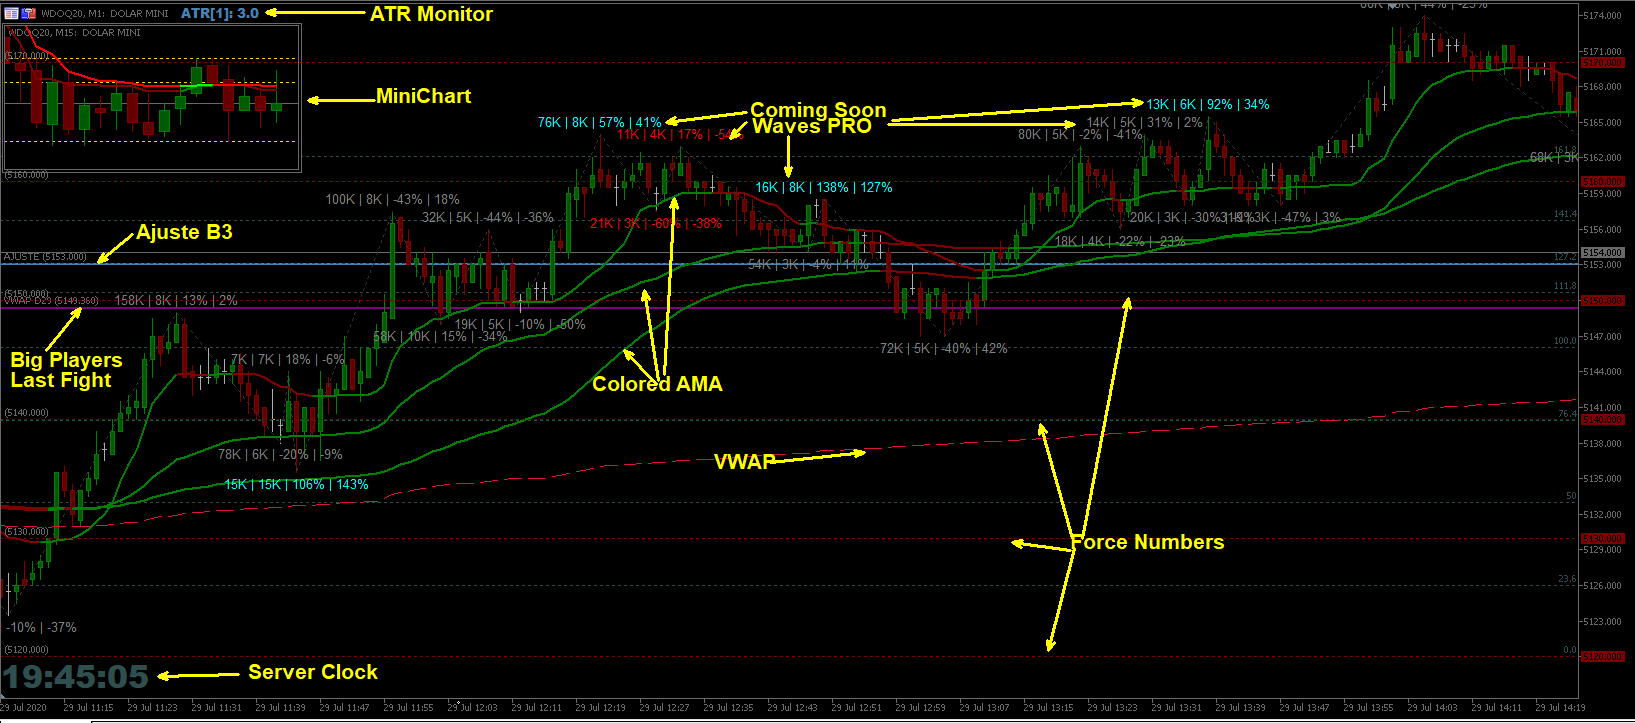
For those who appreciate Richard Wyckoff approach for reading the markets, we at Minions Labs designed a tool derived - yes, derived, we put our own vision and sauce into this indicator - which we called Waves PRO . This indicator provides a ZigZag controlled by the market volatility (ATR) to build its legs, AND on each ZigZag leg, we present the vital data statistics about it. Simple and objective. This indicator is also derived from the great book called " The Secret Science of Price and
It is the very same classic Stochastic indicator, but with a little twist: NO NAME and data is shown in the sub window. It could be stupid, BUT, if you are running out of space in Micro windows like Mini Charts, where the indicator's name is totally useless, you came to the right place. And that's it! I know it seems stupid but I needed the classical version of Stochastic indicator without that annoying name on my Mini Chart, so I did it that way... The original formula is right from Metaquote's



If you like to use traditional Moving Averages (like SMAs and EMAs) to provide your trades for dynamic levels of Support and Resistance, you will love the Adaptive Moving Average (AMA). Created in 1995 by Perry Kaufman and presented to the world in his book " Smarter Trading : Improving Performance in Changing Markets ", the Adaptive Moving Average (also known as KAMA - Kaufman Adaptive Moving Average) has the goal to be the perfect companion for
Qstick is a way to objectively quantify candlestick analysis and improve the interpretation of candlestick patterns. Qstick was developed by Tushar Chande and published in his book " The New Technical Trader - Boost Your Profit by Plugging Into the Latest Indicators (1994) ". Qstick is built based on a moving average of the difference between the Open and Close prices. The basis of the idea is that the Opening and Closing prices are the heart of candlestick analysis. We strongly recommend the
You probably heard about Candlesticks behaviors, which in most of the times could denote and trace Volume behaviors even if you are not watching Volume itself... Well, this indicator will do this. Naked traders love to rely solely on candlesticks patterns and with Candle Zones you can trap special patterns and DRAW THEM on your chart. As simple as that. There are several filters you can tweak in order to achieve the analysis you want. Just give it a try. After several months of testing, we think
The Metatrader 5 has a hidden jewel called Chart Object, mostly unknown to the common users and hidden in a sub-menu within the platform. Called Mini Chart, this object is a miniature instance of a big/normal chart that could be added/attached to any normal chart, this way the Mini Chart will be bound to the main Chart in a very minimalist way saving a precious amount of real state on your screen. If you don't know the Mini Chart, give it a try - see the video and screenshots below. This is a

The famous brazilian trader and analyst Didi Aguiar created years ago a study with the crossing of 3 Simple Moving Averages called "Agulhada do Didi", then later was also named Didi Index, as a separate indicator. The period of those SMAs are 3, 8 and 20. As simple as that, this approach and vision bring an easy analysis of market momentum and trend reversal to those traders looking for objective (and visual) information on their charts. Of course, as always, no indicator alone could be used
For those traders and students who follow the famous brazilian trader Igor Rodrigues (Mago Trader) here it is another tool he uses: a 2-line MACD specially set with Phi ratios. This MACD is packed with a twist: a Filling Area , to easily and visually spot the corresponding trend on the chart. Obviously, you can turn On and Off this filling feature. If you don't know Igor Rodrigues and you are a brazilian trader and student, just google for him... Very simple and useful indicator. If you are
For those traders and students who follow the famous brazilian trader Igor Rodrigues (Mago Trader) here it is his famous 2 EMAs - based on Phi ratios - and packed with a twist: a Filling Area , to easily and visually spot the corresponding trend on the chart. You can turn On and Off this filling. If you don't know Igor Rodrigues and you are a brazilian trader and student, just google for him... Very simple and useful indicator. If you are looking also for the MACD -based indicator of this
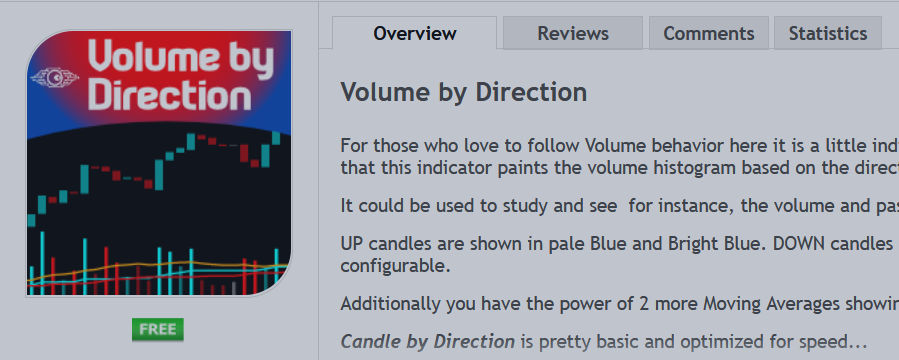
For those who love to follow Volume behavior here it is a little indicator that could be used as a replacement for the old and standard MT5 built-in volume indicator. The trick here is that this indicator paints the volume histogram based on the direction of the candle giving to the trader a quick "Heads Up" on what is happening, visually! It could be used to study and see for instance, the volume and past bars volume during (or, reaching) a peak (Tops and Bottoms). UP candles are shown in


