Young Ho Seo / Profil
- Bilgiler
|
10+ yıl
deneyim
|
62
ürünler
|
1182
demo sürümleri
|
|
4
işler
|
0
sinyaller
|
0
aboneler
|
Harmonic Pattern Indicator - Repainting + Japanese Candlestick Pattern Scanner + Automatic Channel + Many more
https://www.mql5.com/en/market/product/4488
https://www.mql5.com/en/market/product/4475
https://algotrading-investment.com/portfolio-item/harmonic-pattern-plus/
Non Repainting and Non Lagging Harmonic Pattern Indicator – Customizable Harmonic + Japanese Candlestic Pattern Scanner + Advanced Channel + Many more
https://www.mql5.com/en/market/product/41993
https://www.mql5.com/en/market/product/41992
https://algotrading-investment.com/portfolio-item/profitable-pattern-scanner/
Supply Demand Indicator – Multiple Timeframe Scanning Added + Non Repainting + Professional Indicator
https://www.mql5.com/en/market/product/40076
https://www.mql5.com/en/market/product/40075
https://algotrading-investment.com/portfolio-item/ace-supply-demand-zone/
Momentum Indicator – Path to Volume Spread Analysis
https://www.mql5.com/en/market/product/30641
https://www.mql5.com/en/market/product/30621
https://algotrading-investment.com/portfolio-item/excessive-momentum-indicator/
Elliott Wave Indicator for the Power User
https://www.mql5.com/en/market/product/16479
https://www.mql5.com/en/market/product/16472
https://algotrading-investment.com/portfolio-item/elliott-wave-trend/
Forex Prediction - Turn Support and Resistance to the Advanced Strategy
https://www.mql5.com/en/market/product/49170
https://www.mql5.com/en/market/product/49169
https://algotrading-investment.com/portfolio-item/fractal-pattern-scanner/
MetaTrader 4 and MetaTrader 5 Product Page: https://www.mql5.com/en/users/financeengineer/seller#products
Free Forex Prediction with Fibonacci Analysis: https://algotrading-investment.com/2020/10/23/forex-prediction-with-fibonacci-analysis/
Free Harmonic Pattern Signal: https://algotrading-investment.com/2020/12/17/harmonic-pattern-signal-for-forex-market/
============================================================================================================================
Here are the trading education books. We recommend reading these books if you are a trader or investor in Forex and Stock market. In the list below, we put the easy to read book on top. Try to read the easy to read book first and try to read the harder book later to improve your trading and investment.
First Link = amazon.com, Second Link = Google Play Books, Third Link = algotrading-investment.com, Fourth Link = Google Books
Technical Analysis in Forex and Stock Market (Supply Demand Analysis and Support Resistance)
https://www.amazon.com/dp/B09L55ZK4Z
https://play.google.com/store/books/details?id=pHlMEAAAQBAJ
https://algotrading-investment.com/portfolio-item/technical-analysis-in-forex-and-stock-market/
https://books.google.co.kr/books/about?id=pHlMEAAAQBAJ
Science Of Support, Resistance, Fibonacci Analysis, Harmonic Pattern, Elliott Wave and X3 Chart Pattern (In Forex and Stock Market Trading)
https://www.amazon.com/dp/B0993WZGZD
https://play.google.com/store/books/details?id=MME3EAAAQBAJ
https://algotrading-investment.com/portfolio-item/science-of-support-resistance-fibonacci-analysis-harmonic-pattern/
https://books.google.co.kr/books/about?id=MME3EAAAQBAJ
Profitable Chart Patterns in Forex and Stock Market (Fibonacci Analysis, Harmonic Pattern, Elliott Wave, and X3 Chart Pattern)
https://www.amazon.com/dp/B0B2KZH87K
https://play.google.com/store/books/details?id=7KrQDwAAQBAJ
https://algotrading-investment.com/portfolio-item/profitable-chart-patterns-in-forex-and-stock-market/
https://books.google.com/books/about?id=7KrQDwAAQBAJ
Guide to Precision Harmonic Pattern Trading (Mastering Turning Point Strategy for Financial Trading)
https://www.amazon.com/dp/B01MRI5LY6
https://play.google.com/store/books/details?id=8SbMDwAAQBAJ
http://algotrading-investment.com/portfolio-item/guide-precision-harmonic-pattern-trading/
https://books.google.com/books/about?id=8SbMDwAAQBAJ
Scientific Guide to Price Action and Pattern Trading (Wisdom of Trend, Cycle, and Fractal Wave)
https://www.amazon.com/dp/B073T3ZMBR
https://play.google.com/store/books/details?id=5prUDwAAQBAJ
https://algotrading-investment.com/portfolio-item/scientific-guide-to-price-action-and-pattern-trading/
https://books.google.com/books/about?id=5prUDwAAQBAJ
Predicting Forex and Stock Market with Fractal Pattern: Science of Price and Time
https://www.amazon.com/dp/B086YKM8BW
https://play.google.com/store/books/details?id=VJjiDwAAQBAJ
https://algotrading-investment.com/portfolio-item/predicting-forex-and-stock-market-with-fractal-pattern/
https://books.google.com/books/about?id=VJjiDwAAQBAJ
Trading Education Book 1 in Korean (Apple, Google Play Book, Google Book, Scribd, Kobo)
https://books.apple.com/us/book/id1565534211
https://play.google.com/store/books/details?id=HTgqEAAAQBAJ
https://books.google.co.kr/books/about?id=HTgqEAAAQBAJ
https://www.scribd.com/book/505583892
https://www.kobo.com/ww/en/ebook/8J-Eg58EDzKwlpUmADdp2g
Trading Education Book 2 in Korean (Apple, Google Play Book, Google Book, Scribd, Kobo)
https://books.apple.com/us/book/id1597112108
https://play.google.com/store/books/details?id=shRQEAAAQBAJ
https://books.google.co.kr/books/about?id=shRQEAAAQBAJ
https://www.scribd.com/book/542068528
https://www.kobo.com/ww/en/ebook/X8SmJdYCtDasOfQ1LQpCtg
About Young Ho Seo
Young Ho Seo is an Engineer, Financial Trader, and Quantitative Developer, working on Trading Science and Investment Engineering since 2011. He is the creator of many technical indicators, price patterns and trading strategies used in the financial market. He is also teaching the trading practice on how to use the Supply Demand Analysis, Support, Resistance, Trend line, Fibonacci Analysis, Harmonic Pattern, Elliott Wave Theory, Chart Patterns, and Probability for Forex and Stock Market. His works include developing scientific trading principle and mathematical algorithm in the work of Benjamin Graham, Everette S. Gardner, Benoit Mandelbrot, Ralph Nelson Elliott, Harold M. Gartley, Richard Shabacker, William Delbert Gann, Richard Wyckoff and Richard Dennis. You can find his dedicated works on www.algotrading-investment.com . His life mission is to connect financial traders and scientific community for better understanding of this world and crowd behaviour in the financial market. He wrote many books and articles, which are helpful for understanding the technology and application behind technical analysis, statistics, time series forecasting, fractal science, econometrics, and artificial intelligence in the financial market.
If you are interested in our software and training, just visit our main website: www.algotrading-investment.com
Young Ho Seo

USDJPY Market Outlook
Current snapshot of USDJPY Market Outlook.
USDJPY have just been outside triangle. It is testing adjacent demand zone currently.
Nearest round number is 102.00 and the next one down is 101.00.
https://algotradinginvestment.wordpress.com/2016/09/19/usdjpy-market-outlook-4/
http://algotrading-investment.com/

Young Ho Seo

EURUSD Market Outlook
Sharp fall across triangle. Then interesting bounce off at the round number 1.3000.
Again EURUSD is back to inside triangle.
Please find attached screenshot.
http://algotrading-investment.com/
https://algotradinginvestment.wordpress.com/2016/09/19/eurusd-market-outlook-4/
Sharp fall across triangle. Then interesting bounce off at the round number 1.3000.
Again EURUSD is back to inside triangle.
Please find attached screenshot.
http://algotrading-investment.com/
https://algotradinginvestment.wordpress.com/2016/09/19/eurusd-market-outlook-4/

Young Ho Seo

Microsoft Corp Trend Analysis
Technical analysis on Popular US Stock Microsoft Corp
Still showing expectation on upward movements.
http://algotrading-investment.com/
https://algotradinginvestment.wordpress.com/2016/09/18/micro-soft-corp-trend-analysis/
Data from: http://finance.yahoo.com/quote/MSFT?ltr=1
Technical analysis on Popular US Stock Microsoft Corp
Still showing expectation on upward movements.
http://algotrading-investment.com/
https://algotradinginvestment.wordpress.com/2016/09/18/micro-soft-corp-trend-analysis/
Data from: http://finance.yahoo.com/quote/MSFT?ltr=1

Young Ho Seo

Trendy Stock Analysis
Portfolio Analysis of Following popular stock:
•American Realty Investors ARL
•Community Health Systems CYH
•Comfort Systems USA FIX
•Mechel ADR MTL
•Citizens Cl A CIA
•Lions Gate Entertainment LGF
•Universal American UAM
•North American Energy Partners NOA
•Morgan Stanley Asia-Pacific Fund APF
Stock data was taken from Wall Street Journal.
http://online.wsj.com/mdc/public/page/2_3021-gainnyse-gainer.html
https://algotradinginvestment.wordpress.com/2016/09/18/trendy-stock-analysis/
http://algotrading-investment.com/

Young Ho Seo

S&P 500 Market Outlook
Extrapolative Forecasting of S&P500 monthly data using
Damped Trend Multiplicative seasonal method
Damped Trend Additive Seasonal Method.
This is for your reference only.
https://algotradinginvestment.wordpress.com/2016/09/17/sp-500-market-outlook/
http://algotrading-investment.com/
Extrapolative Forecasting of S&P500 monthly data using
Damped Trend Multiplicative seasonal method
Damped Trend Additive Seasonal Method.
This is for your reference only.
https://algotradinginvestment.wordpress.com/2016/09/17/sp-500-market-outlook/
http://algotrading-investment.com/

Young Ho Seo

GBPUSD Market Outlook
Another big drop in GBPUSD. Currently it just went outside triangles formed in H1. It is Heading to Demand Zone now.
https://algotradinginvestment.wordpress.com/2016/09/17/gbpusd-market-outlook-12/
http://algotrading-investment.com/
Another big drop in GBPUSD. Currently it just went outside triangles formed in H1. It is Heading to Demand Zone now.
https://algotradinginvestment.wordpress.com/2016/09/17/gbpusd-market-outlook-12/
http://algotrading-investment.com/

Young Ho Seo

USDJPY Market outlook
Current snapshot of USDJPY Market Outlook.
USDJPY is currently inside three triagle formed from H1, H4 and D1 timeframe.
Interesting breakout is expected quite soon.
https://algotradinginvestment.wordpress.com/2016/09/16/usdjpy-market-outlook-3/
http://www.algotrading-investment.com/
Current snapshot of USDJPY Market Outlook.
USDJPY is currently inside three triagle formed from H1, H4 and D1 timeframe.
Interesting breakout is expected quite soon.
https://algotradinginvestment.wordpress.com/2016/09/16/usdjpy-market-outlook-3/
http://www.algotrading-investment.com/

Young Ho Seo
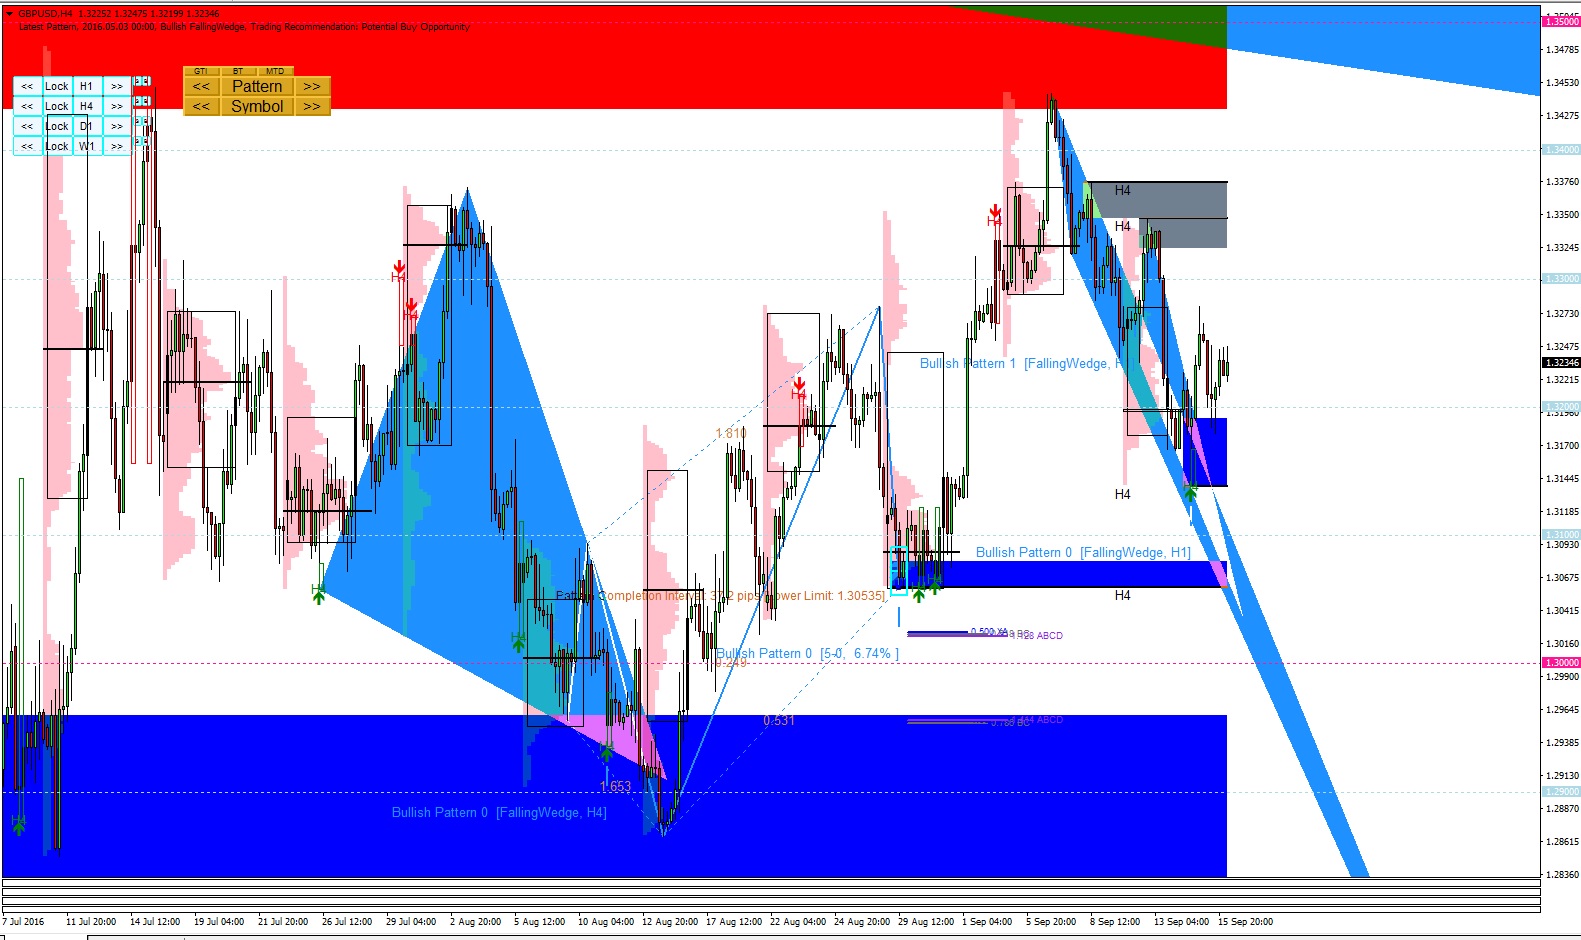
GBPUSD Market Outlook
GBPUSD Bounce over another Demand Zone Today. Note that turning point detector gave us quite early bullish turning point signal too.
For your information, Price Breakout pattern Scanner version 6.6 are available to download from mql5.com
https://www.mql5.com/en/market/product/4859
https://www.mql5.com/en/market/product/4858
Of course it is already available for download from our mother website: http://algotrading-investment.com/
https://algotradinginvestment.wordpress.com/2016/09/16/gbpusd-market-outlook-11/

Young Ho Seo
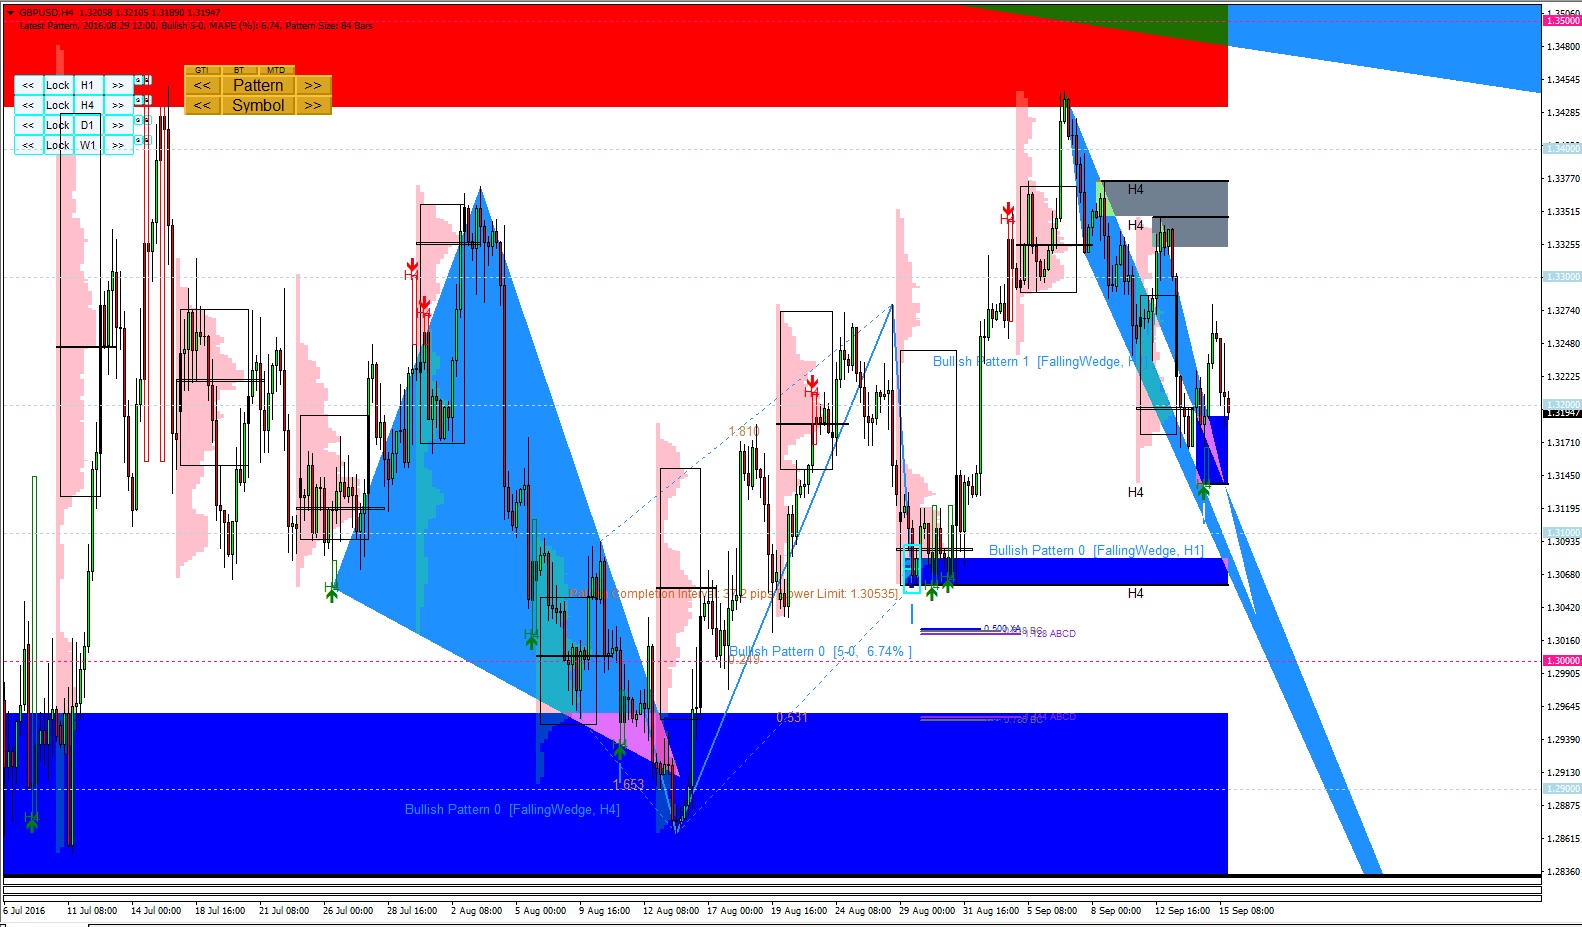
Price Breakout Pattern Scanner Version 6.6 Update completed.
Finally we have Price Breakout Pattern Scanner updated to version 6.6 on mql5.com site.
Please check it out.
Thanks for your patience.
https://algotradinginvestment.wordpress.com/2016/09/15/price-breakout-pattern-scanner-version-6-6-update-completed/
http://algotrading-investment.com
https://www.mql5.com/en/market/product/4859
https://www.mql5.com/en/market/product/4858

Young Ho Seo
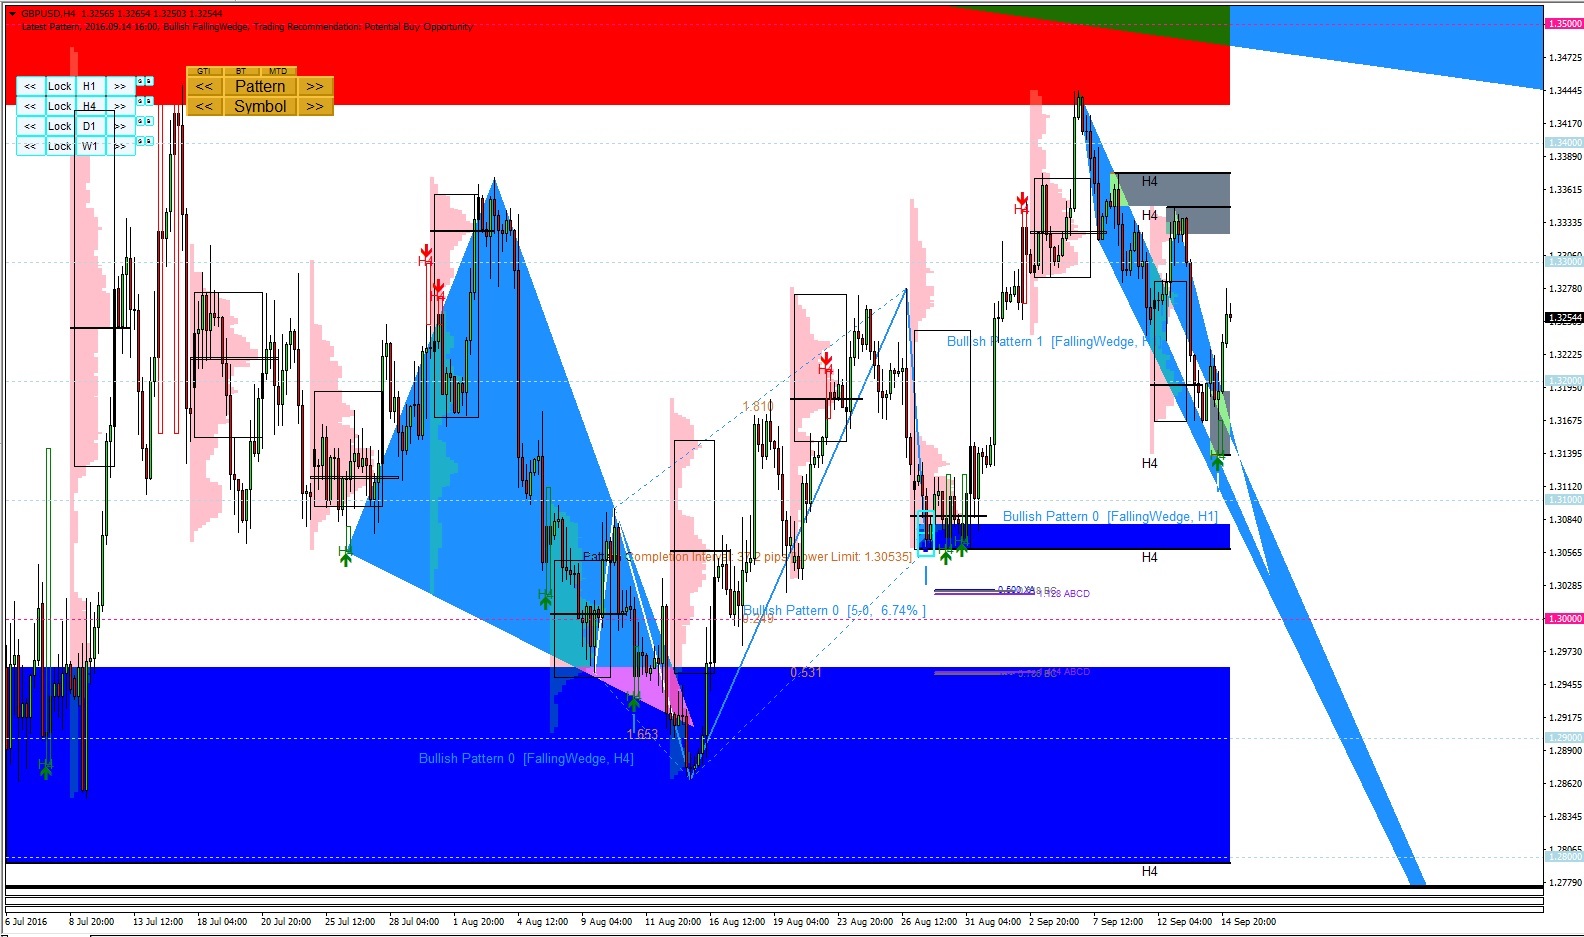
GBPUSD Market Outlook
Currently snap shot of GBPUSD. As expected, GBPUSD had high volatile movement last few days. I have printed two patterns at the same time in H1 timeframe to give you the clear view on the current market movement on GBPUSD.
Of course, version 8.6 of Price Breakout pattern scanner is ready on http://algotrading-investment.com. However, sorry for the late update on our price Breakout Pattern Scanner version 8.6 on mql5.com. We will send them message again for fast processing.
https://algotradinginvestment.wordpress.com/2016/09/15/gbpusd-market-outlook-10/
http://algotrading-investment.com/
Kind regards.

Young Ho Seo
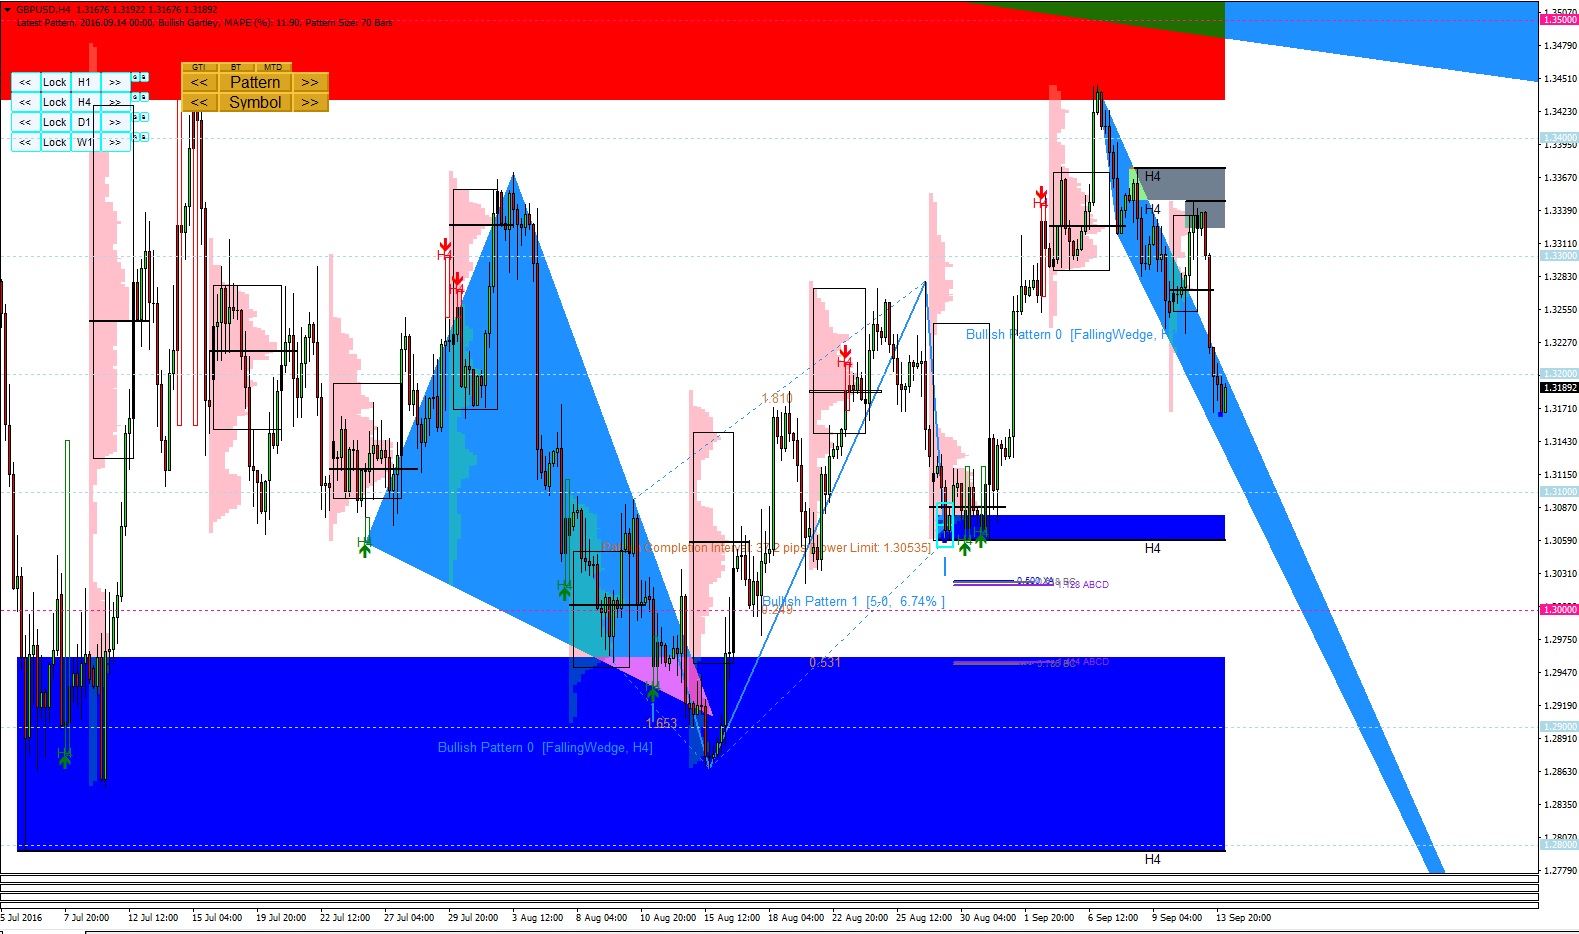
GBPUSD Market Outlook
Following from Yesterday's Volatility Movement, Currently GBPUSD came back to triangle again and resting inside triangle for now.
https://algotradinginvestment.wordpress.com/2016/09/14/gbpusd-market-outlook-9/
http://algotrading-investment.com/
Following from Yesterday's Volatility Movement, Currently GBPUSD came back to triangle again and resting inside triangle for now.
https://algotradinginvestment.wordpress.com/2016/09/14/gbpusd-market-outlook-9/
http://algotrading-investment.com/

Young Ho Seo
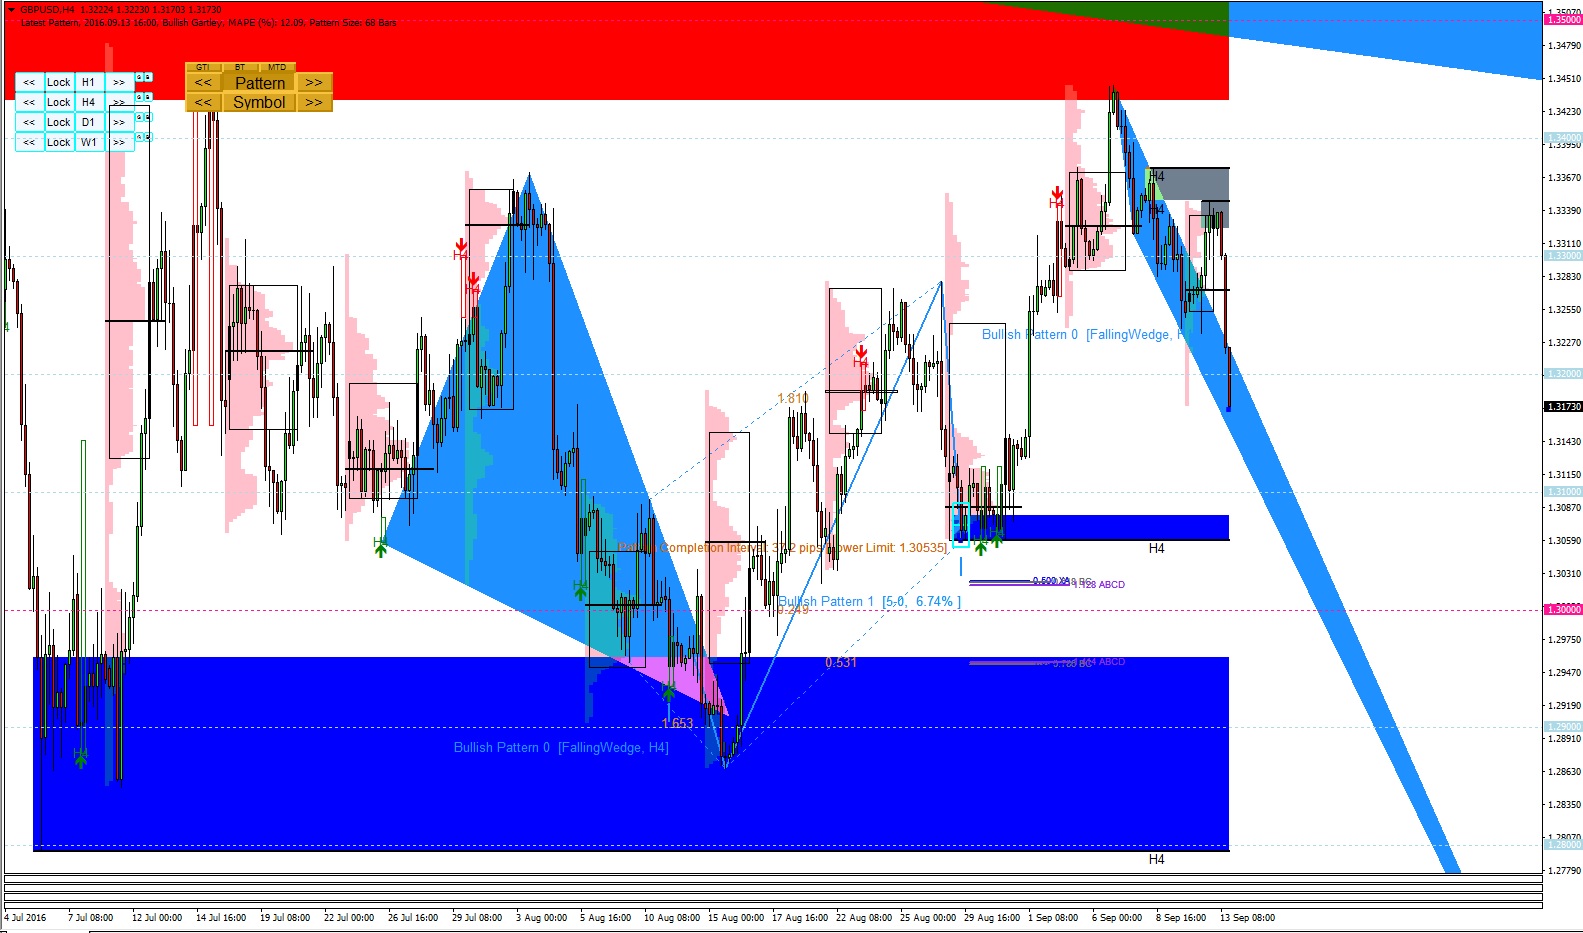
GBPUSD Market outlook
After GBPUSD touched supply area, GBPUSD gone down widely.
Now GBPUSD are staying on the other end of weekly Market Profile.
https://algotradinginvestment.wordpress.com/2016/09/13/gbpusd-market-outlook-8/
http://algotrading-investment.com/
After GBPUSD touched supply area, GBPUSD gone down widely.
Now GBPUSD are staying on the other end of weekly Market Profile.
https://algotradinginvestment.wordpress.com/2016/09/13/gbpusd-market-outlook-8/
http://algotrading-investment.com/

Young Ho Seo
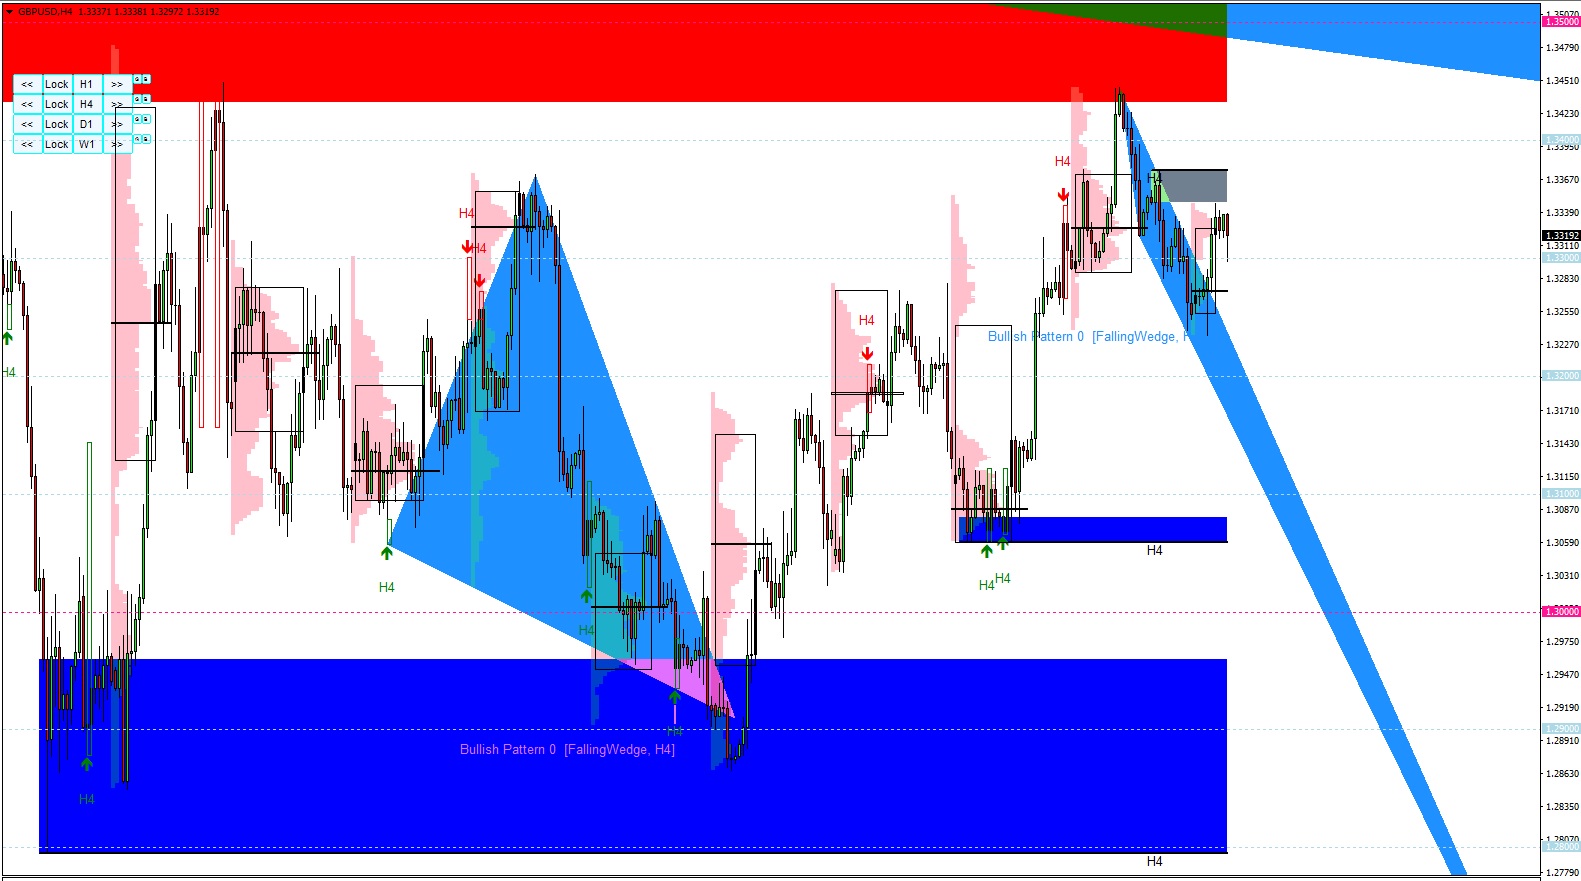
GBPUSD Market Outlook
Current market snapshot with GBPUSD.
Finally GBPUSD come out of the triangle. Almost touched supply level but not quite.
https://algotradinginvestment.wordpress.com/2016/09/13/gbpusd-market-outlook-7/
http://algotrading-investment.com/
Current market snapshot with GBPUSD.
Finally GBPUSD come out of the triangle. Almost touched supply level but not quite.
https://algotradinginvestment.wordpress.com/2016/09/13/gbpusd-market-outlook-7/
http://algotrading-investment.com/

Young Ho Seo
Input Description for Price Breakout Pattern Scanner
http://algotrading-investment.com/portfolio-item/price-breakout-pattern-scanner/#toggle-id-2
https://algotradinginvestment.wordpress.com/2016/09/12/input-description-for-price-breakout-pattern-scanner/
We are pushing hard for MQL5.com to fast process our new update on version 6.6 for price breakout pattern scanner. Below is the detailed description on input setting for our price breakout pattern scanner.
Input Description for Price Breakout Pattern Scanner (applicable from version 6.6)
Price Breakout Pattern Parameters 1 (User Option)
This inputs controls general functionality of Price Breakout Pattern Scanner. You can use Price Breakout Pattern Scanner for many different mode. If support and resistance are important for your trading, then you can run the Price Breakout Pattern scanner in Support Resistance mode. For that, set “Display As Support Resistance” = true. If you set “Display As Support Resistance” = false, then Price Breakout pattern scanner will show patterns drawn in triangles. With Price Breakout pattern scanner, it is possible to apply them in custom timeframe. This means that you can apply several price breakout pattern scanner in one chart. To apply price breakout pattern scanner in custom timeframe, set “Timeframe to detect Price Breakout Patterns” to your preferred one including H1, H4, D1, W1 or MN1, etc.
•Set false to switch off Price Breakout Pattern Scanning:
•Use Renko Filter for Pattern detection : true or false only
•Timeframe to detect Price Breakout Patterns
•Display As Support Resistance (true = support resistance, false = triangle)
•Max number of patterns to display: Control this input if you want to see more than one pattern simultaneously. For example, set this to 3, then price breakout pattern scanner will show 3 latest patterns at the same time.
•Pattern Index from which to display: 0 = default
•Enable sound alert: set to true to get sound alert
•Send email if pattern is found: set to true to receive email alert
•Send notification if pattern is found: set to true to receive push notification. Push notification is recommended over email notification.
•Print pattern in expert journals:
•Write patterns in text files: set to true if you wish to write patterns in text file
•File name when save pattern info
•Allowable margin when matching patterns (0.1 = 10% allowance)
•Use white background for chart: set false if you want to use default black background chart
•Max Bars to search pattern: use default
•Search Step ( 1: fine, >1: coarse) : use default
•Amount of bars to scan for pattern search (1500 = default): set this to more if you like to study and develop your own trading strategy
•Pattern Size Filter by Number of Candles: Filter out small patterns if you wish. If you want to see any size pattern, then set this to 0
Price Breakout Pattern Parameters 2 (Display Option)
This input controls interface of Price Breakout pattern scanner. For example, you can control color of each patterns, text size for pattern name, etc. You can also control the size of buttons from here. Especially if you wish to apply multiple Price Breakout Pattern Scanner in one chart, then you need to change the location of the button here. For example, set Button Coordinate Y to 80 if you want to offset the second button sets below your first button set from your previous Price Breakout Pattern Scanner. Likewise, you can set button coordinate Y to 100 if you want to offset the third button sets below your second button sets assuming that you are using button height 20.
•Bullish Breakout Pattern color
•Bearish Breakout Pattern color
•Bothway Breakout Pattern color
•Bullish Breakout Locked Pattern color
•Bearish Breakout Locked Pattern color
•Bothway Breakout Locked Pattern color
•Text size for name (0 = disable)
•Text size for trade instruction (0 = disable)
•How long the line should be projected (default = 2)
•Fill patterns with color
•Change size of ray for line object
•Support Resistance Line Width
•Use Small Button (G & B buttons): true or false only
•Button Coordinate X: 10
•Button Coordinate Y: 60 (80, 100, 120, 140 for next timeframe)
•Button Width: 60
•Button Height: 20
•Text size for button: 10
Price Breakout Pattern Parameters 3 (Search Option)
With this input, you can enable and disable pattern type. For example, if you do not want to see Triple Top Pattern, then set “Triple Top Pattern” = false.
•Search Triangle Pattern
•Search Falling Wedge Pattern
•Search Rising Wedge Pattern
•Search Head and Shoulder Pattern
•Search Reverse Head and Shoulder Pattern
•Search Double Top Pattern
•Search Double Bottom Pattern
•Search Triple Top Pattern
•Search Triple Bottom Pattern
Price Breakout Pattern Parameters 4 (Custom Risk Control)
With this input, you can set to see guided trading instruction. While you are trading, check this guided trading instruction to set your profit goal realistically.
•Use Custom Stop Loss and Take Profit
•Risk Reward Ratio (Reward/Risk): user more than 1.0
•Custom Take Profit and Stop Loss Line Length
•Custom Take Profit and Stop Loss Line Width
•Custom Take Profit and Stop Loss Text Size
•Custom Take Profit Color
•Custom Stop Loss Color
•Custom Open Price Color
•Show Guided Trading Instruction
•Guided Trading Instruciton X Coordination
•Guided Trading Instruction Y Coordination
•Your Target Success Rate: 55%(0.55) = default
•Your Risk per Trade: 2% (0.02) = default
•Your Target Trade Number: 100 = default
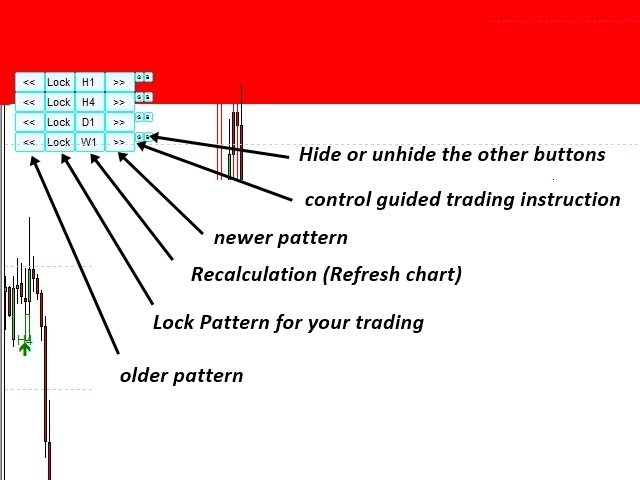
Button Description in your chart
There are six buttons in chart for your convenience. Price breakout pattern scanner scans many historical bars and store patterns in the memory. Depending on your data, sometime, it can store as many as 100 patterns and sometimes, there can be no pattern at all. Price breakout pattern scanner will show pattern one by one in time order for your optimal analysis. However, you might want to see previous patterns for your analysis. In that case, you can press the button “<<” once. Click the button “<>”. Sometime, you want to trade with a particular pattern. You may need to observe the patterns for some times. In that case, click the button “Lock” to lock the pattern from your chart. The locked pattern will remain even new pattern is found in the future. To unlock the pattern, just click the button “Lock” once more. Next to “Lock” button, you can see timeframe button like H1, H4, D1, etc. This button is there to show that these buttons are controlling the price breakout pattern scanner for the time frame. In fact, when you click this time frame button, Price breakout pattern scanner will recalculate over all the historical bars again. Sometime, when you believe that recalculation is necessary, then just click this timeframe button. The small button “G” can control the appearance of guided trading instruction. The small button “B” can hide or unhide all the other buttons from chart.

Young Ho Seo
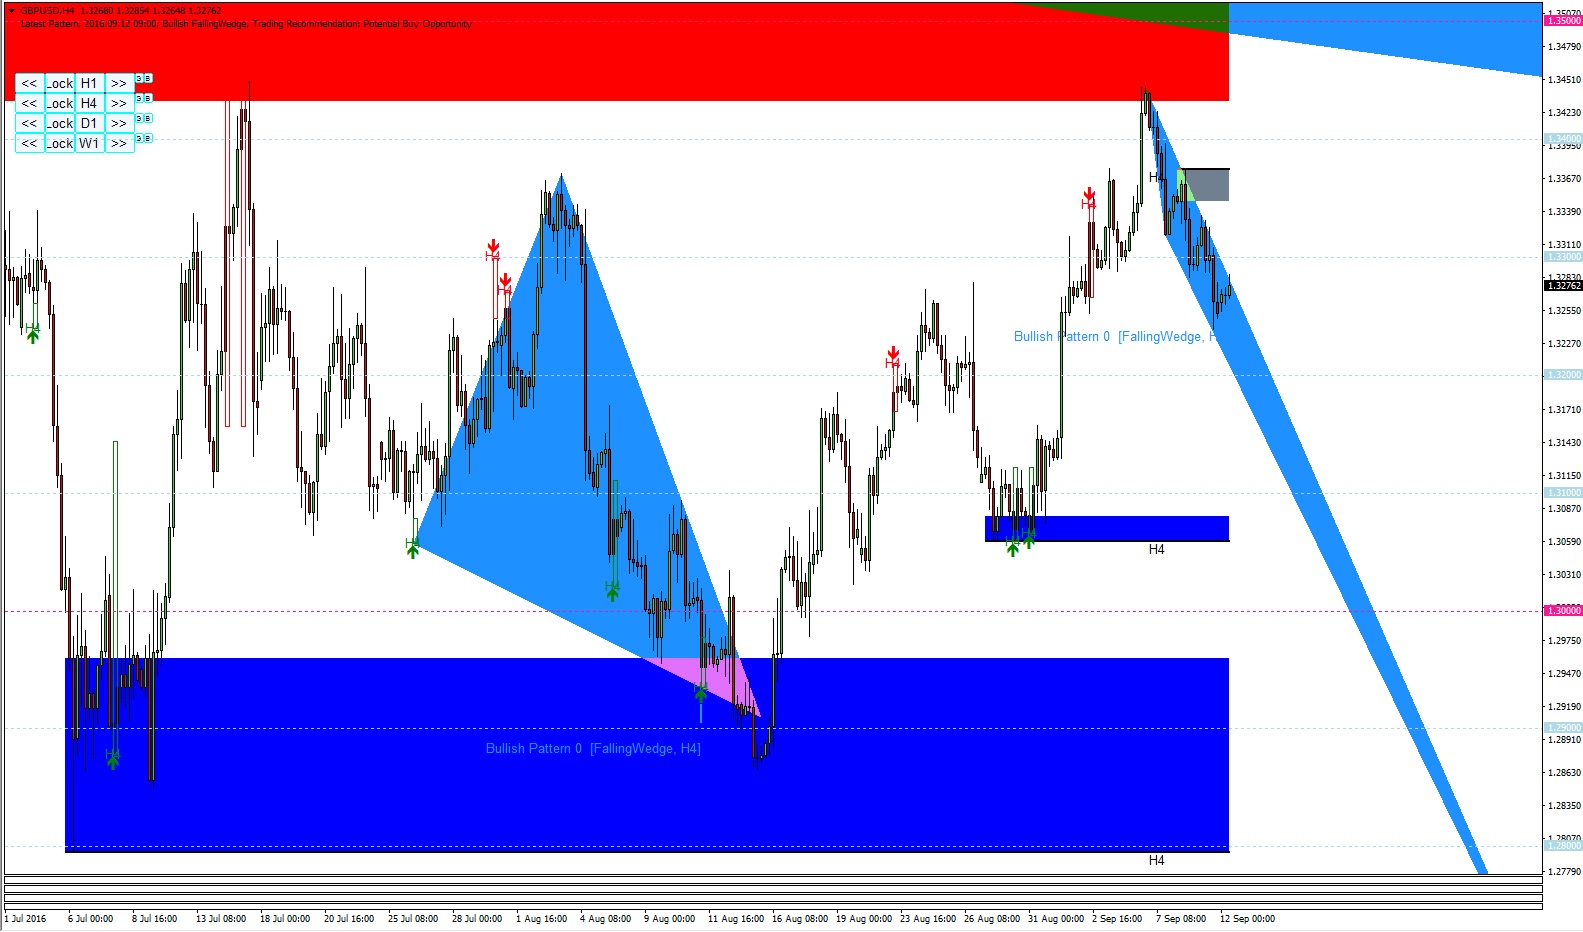
GBPUSD Market Outlook
On Monday, GBPUSD is still inside the triangle. It is making very slow progress.
However, it is definitely showing few signs for high volatility in the near future.
https://algotradinginvestment.wordpress.com/2016/09/12/gbpusd-market-outlook-6/
http://algotrading-investment.com/
On Monday, GBPUSD is still inside the triangle. It is making very slow progress.
However, it is definitely showing few signs for high volatility in the near future.
https://algotradinginvestment.wordpress.com/2016/09/12/gbpusd-market-outlook-6/
http://algotrading-investment.com/

Young Ho Seo
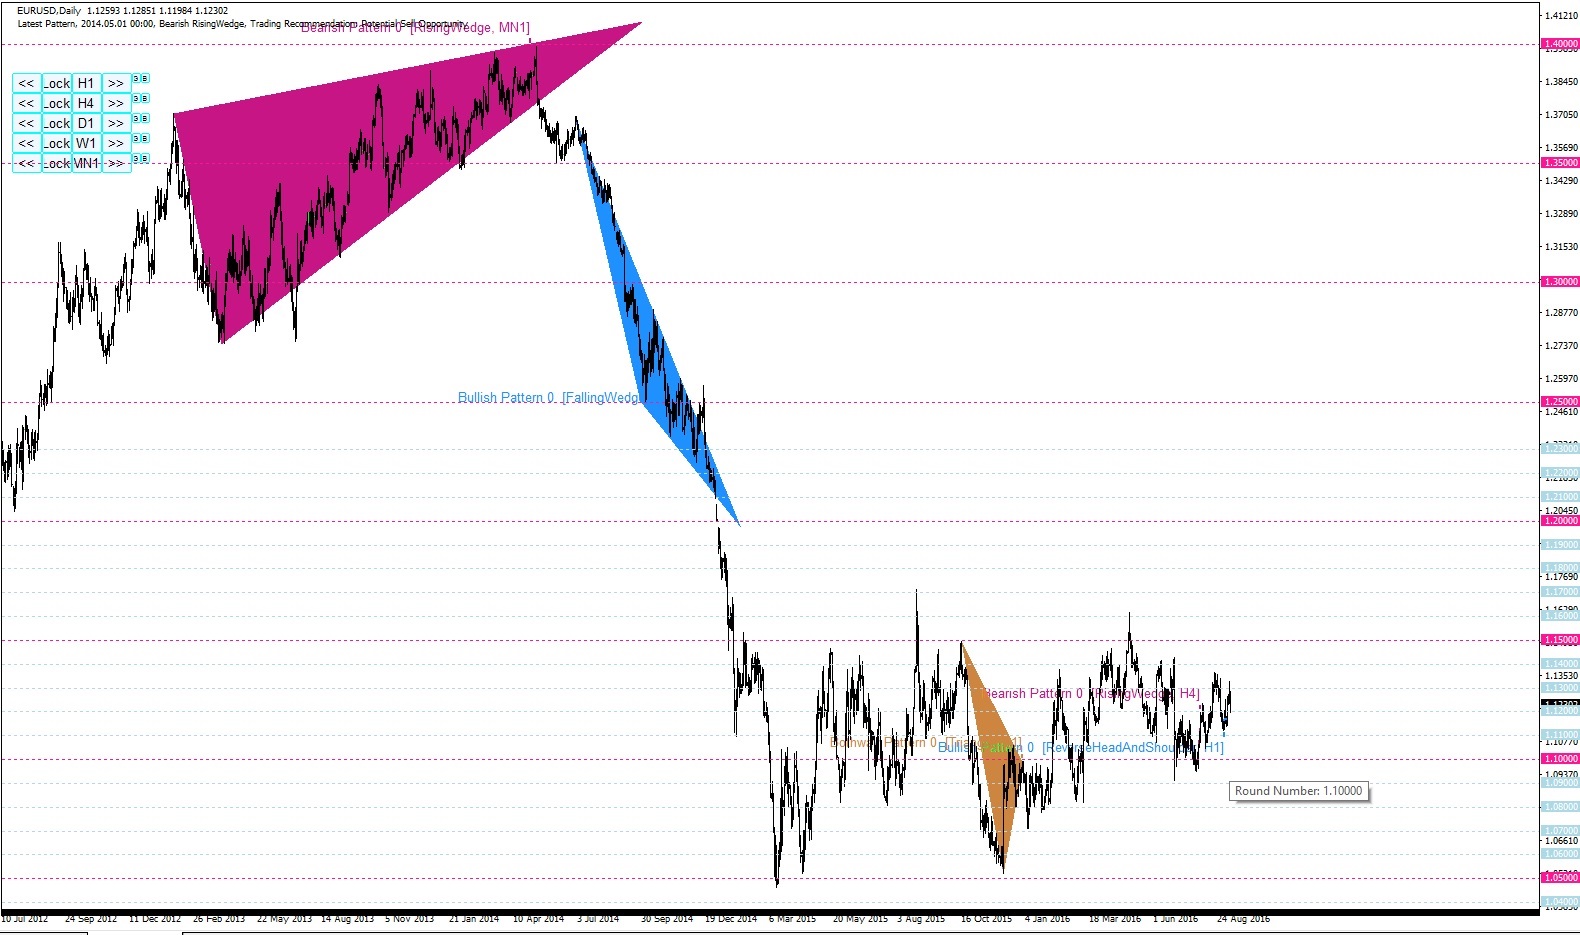

EURUSD Market Outlook
Current market snap shot on EURUSD.
This screenshots give some picture of EURUSD about where we are now.
One strange thing to note is that even after Brexit, the market look like still in sideways movement in big picture.
http://algotrading-investment.com/
https://algotradinginvestment.wordpress.com/2016/09/11/eurusd-market-outlook-3/

[Silindi]
2016.09.11
currently sitting @ 1.1225 in a range. We are looking for a continuation to the top. First stop is @ 1.1330 and the second the Range top @ 1.1470.
Young Ho Seo

Precision Support Resistance Product page is enabled from our website just for your information.
http://algotrading-investment.com/portfolio-item/precision-support-resistance/
http://algotrading-investment.com
http://algotrading-investment.com/portfolio-item/precision-support-resistance/
http://algotrading-investment.com

Young Ho Seo
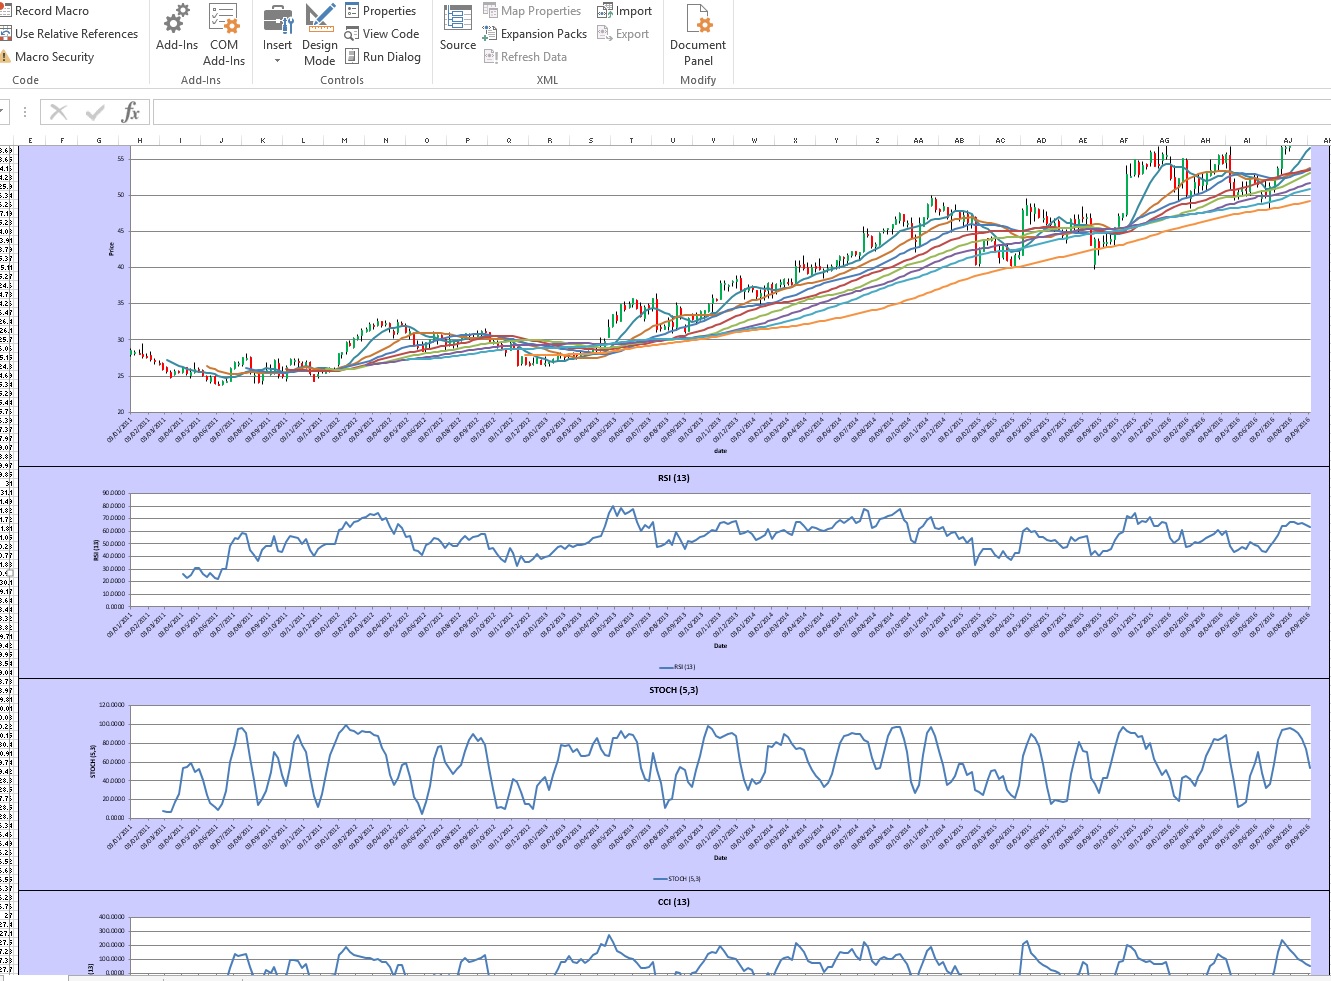
Technical Analysis Feature in Excel
Now with our Algo Investment Tool, you can perform powerful technical analysis in one click in fully automatic manner.
The screenshots shows that 8 moving average with RSI, CCI, Stock aligned together.
We post this screenshots for some curious users for our current development.
In addition to that you can perform all the powerful statistical analysis to your technical analysis.
https://algotradinginvestment.wordpress.com/2016/09/10/technical-analysis/
http://algotrading-investment.com/

Young Ho Seo
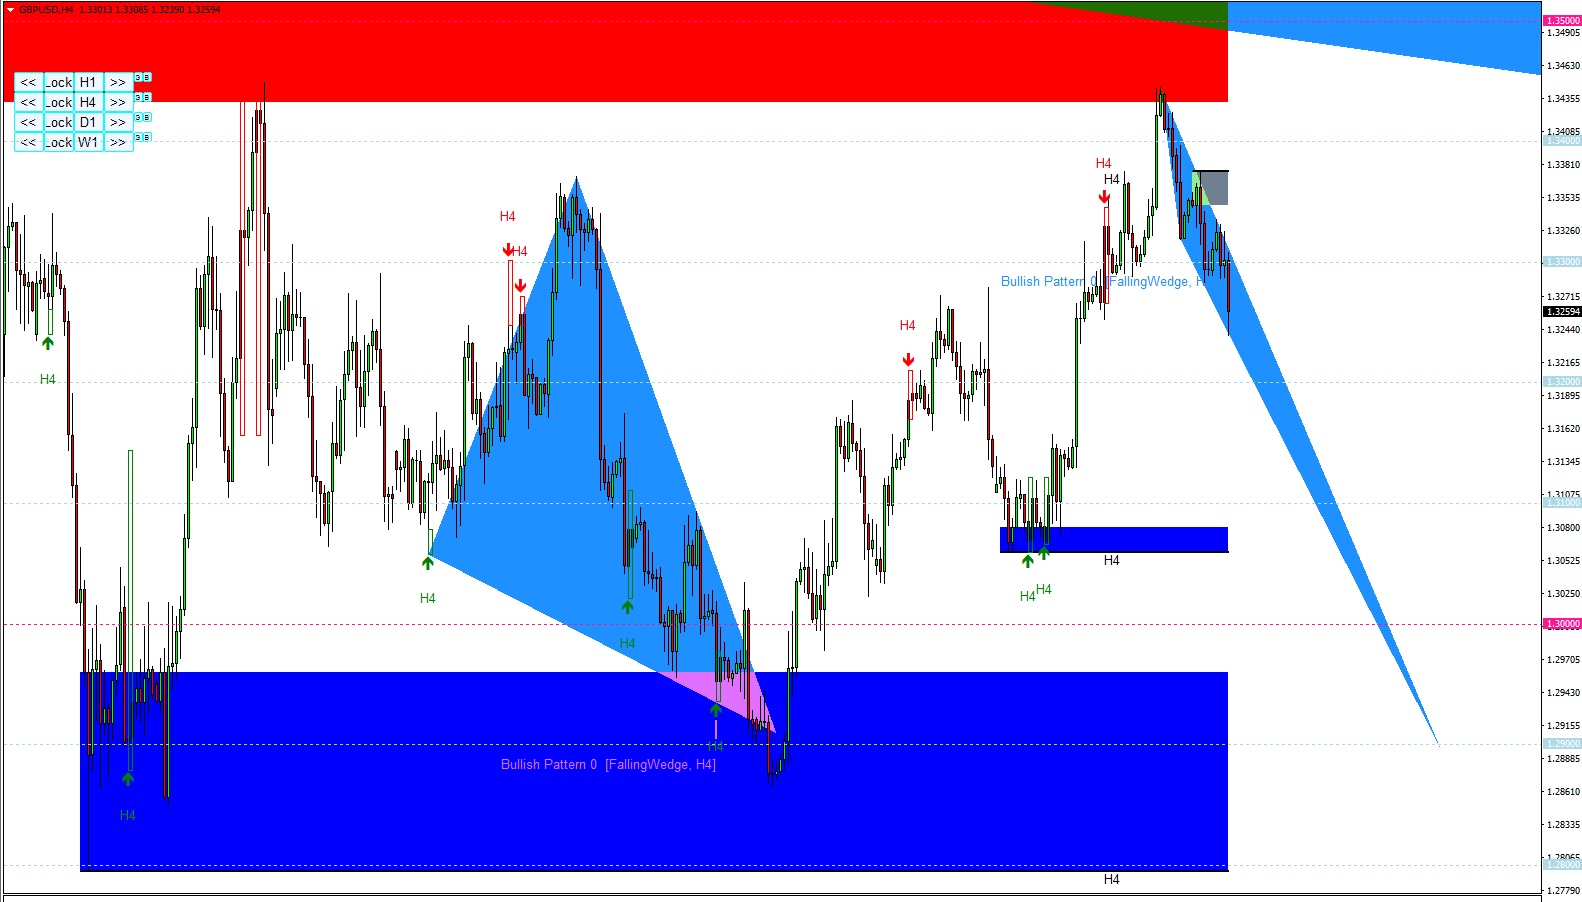
GBPUSD Market Outlook
Current snap shot of market outlook on GBPUSD.
GBPUSD touched again on supply zone once more and then follows sharp fall.
https://algotradinginvestment.wordpress.com/2016/09/09/gbpusd-market-outlook-5/
http://algotrading-investment.com/
Current snap shot of market outlook on GBPUSD.
GBPUSD touched again on supply zone once more and then follows sharp fall.
https://algotradinginvestment.wordpress.com/2016/09/09/gbpusd-market-outlook-5/
http://algotrading-investment.com/

Young Ho Seo
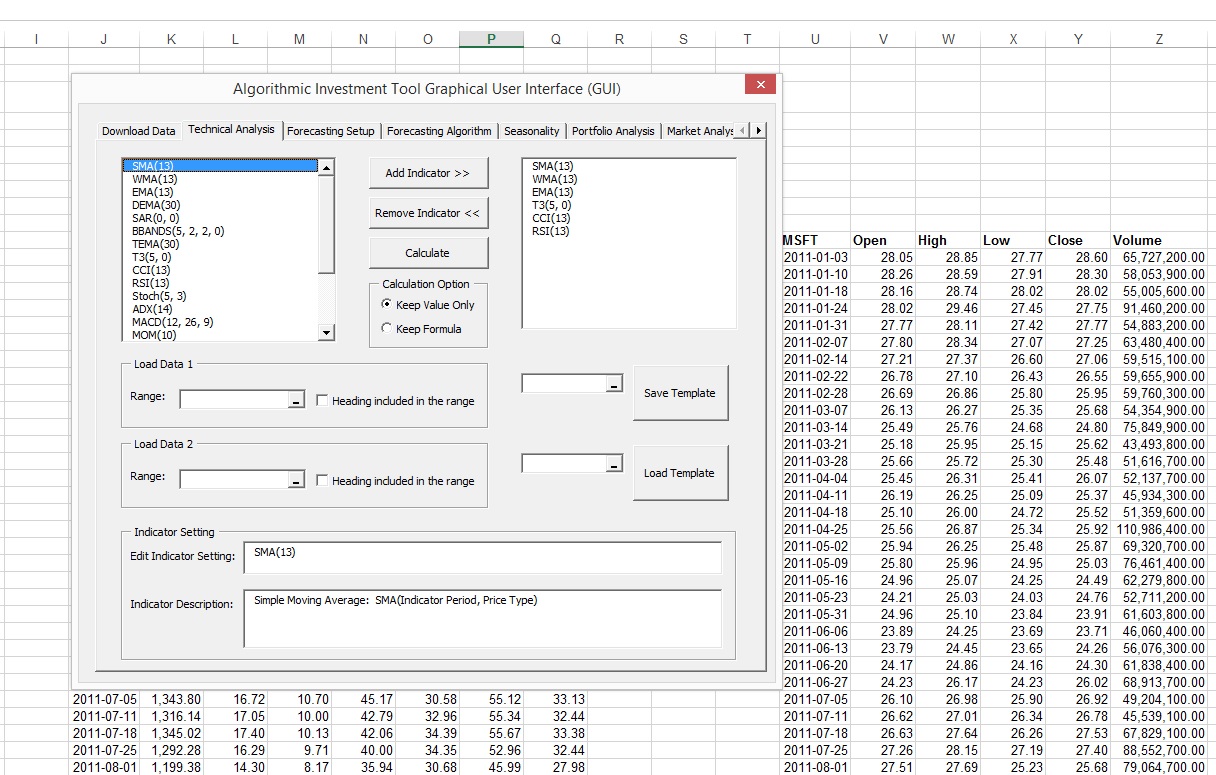

Algo Investment Tool Development News
With our Algo Investment Tool, you can now load over 30 different technical indicators in just one click in your excel spreadsheets.
Stay tuned for further news on our development.
https://algotradinginvestment.wordpress.com/2016/09/09/algo-investment-tool-development-news/
http://algotrading-investment.com

: