|
6+ yıl
deneyim
|
32
ürünler
|
137
demo sürümleri
|
|
0
işler
|
0
sinyaller
|
0
aboneler
|
👑 Teorik fizikçi, programcı.
On beş yıldır piyasanın matematiksel modellerini araştırmaya odaklanarak ticaret yapıyorum.
----------------------------------------------------------------------------------------------------------------------------------
💰 Sunulan ürünler:
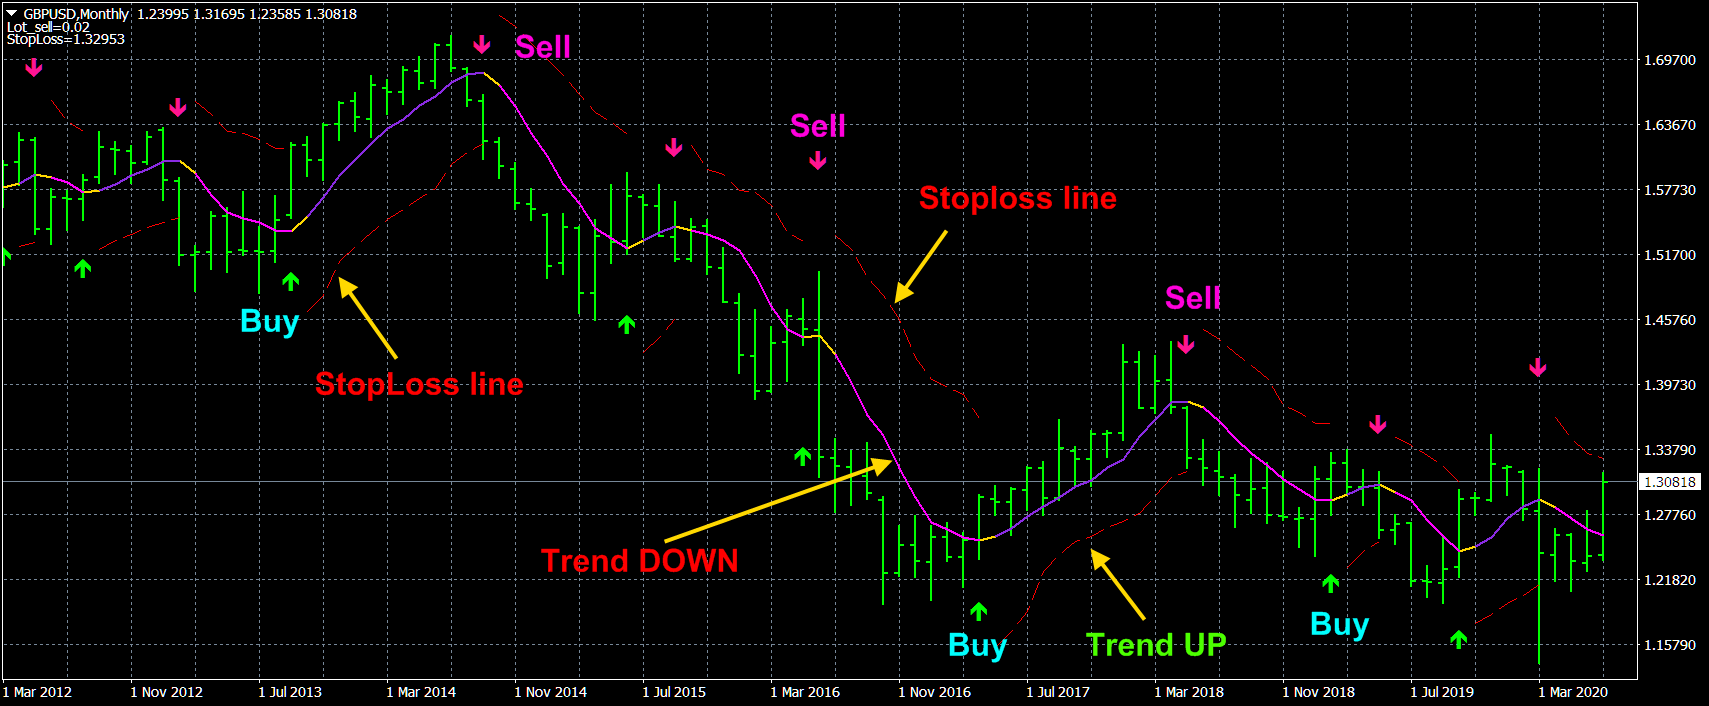
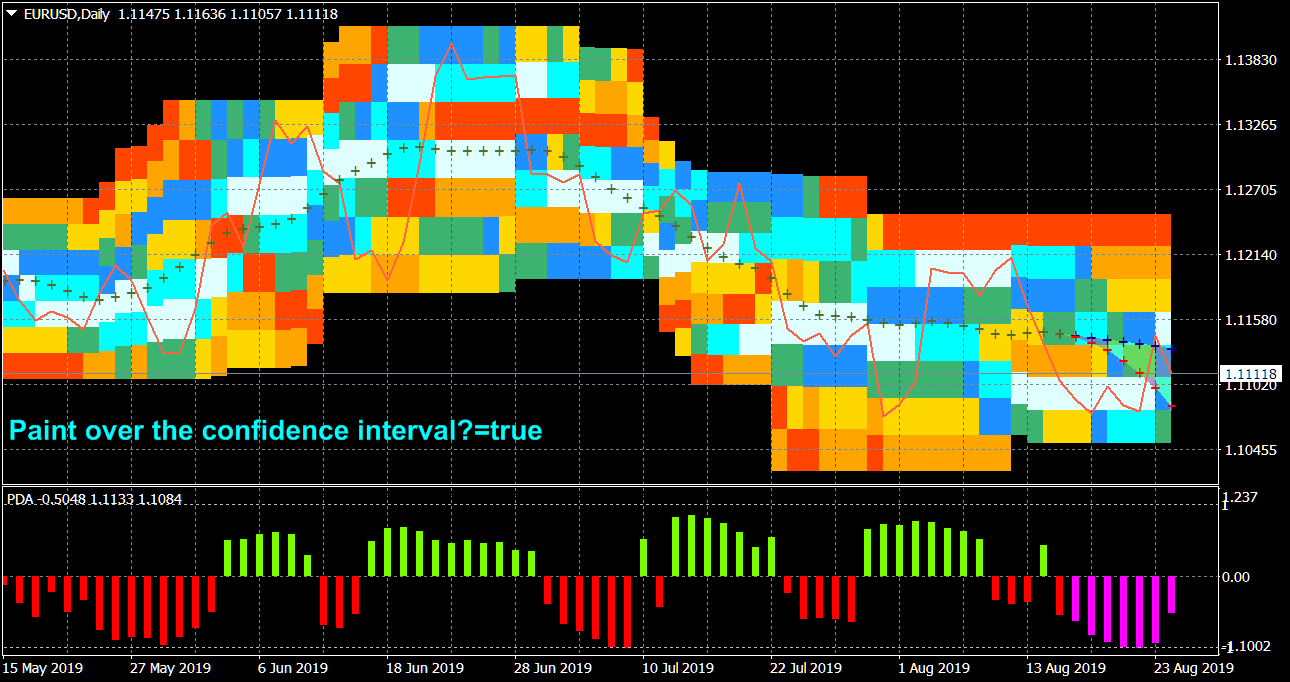
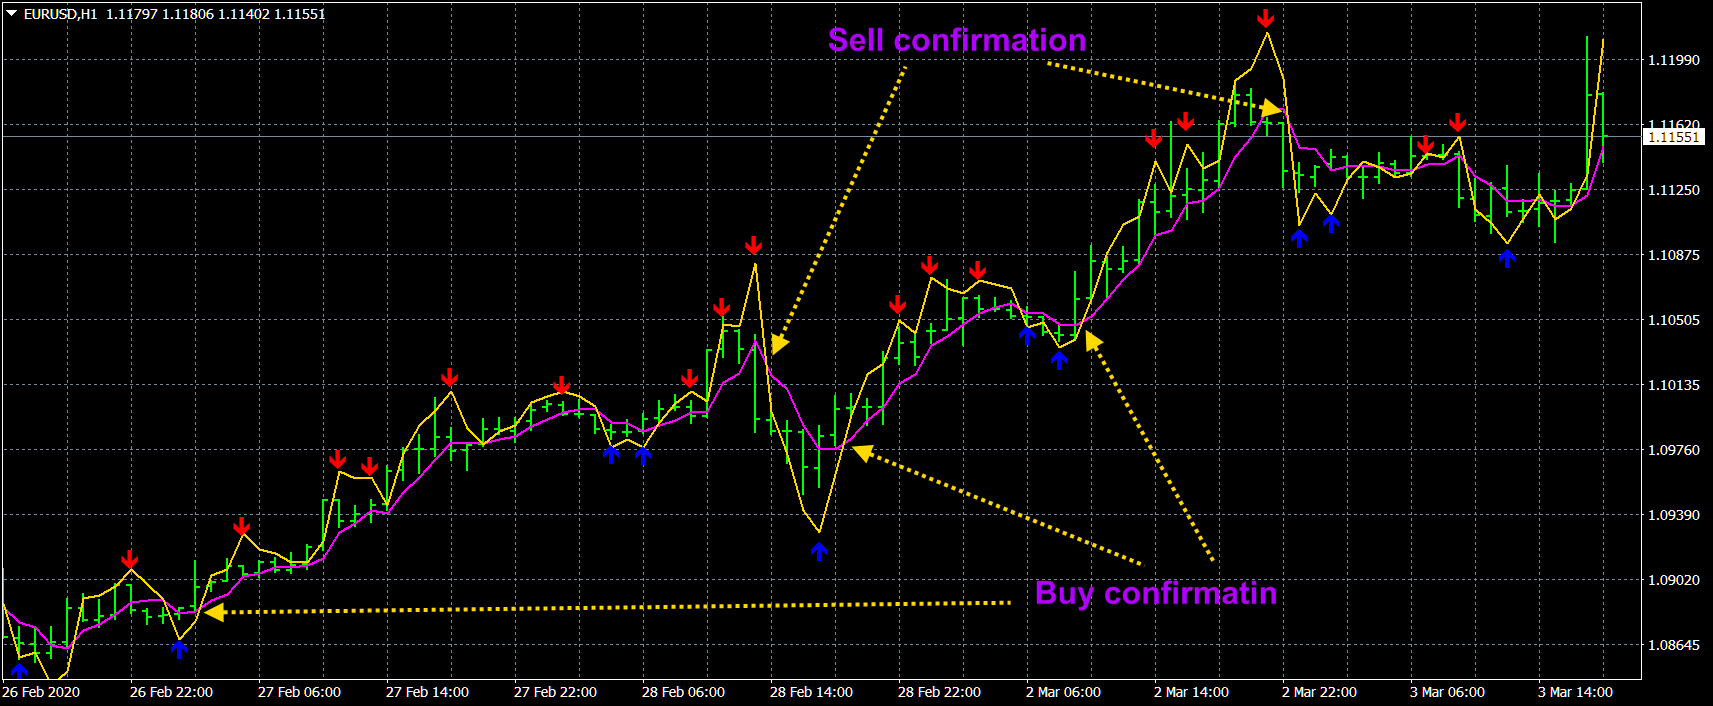
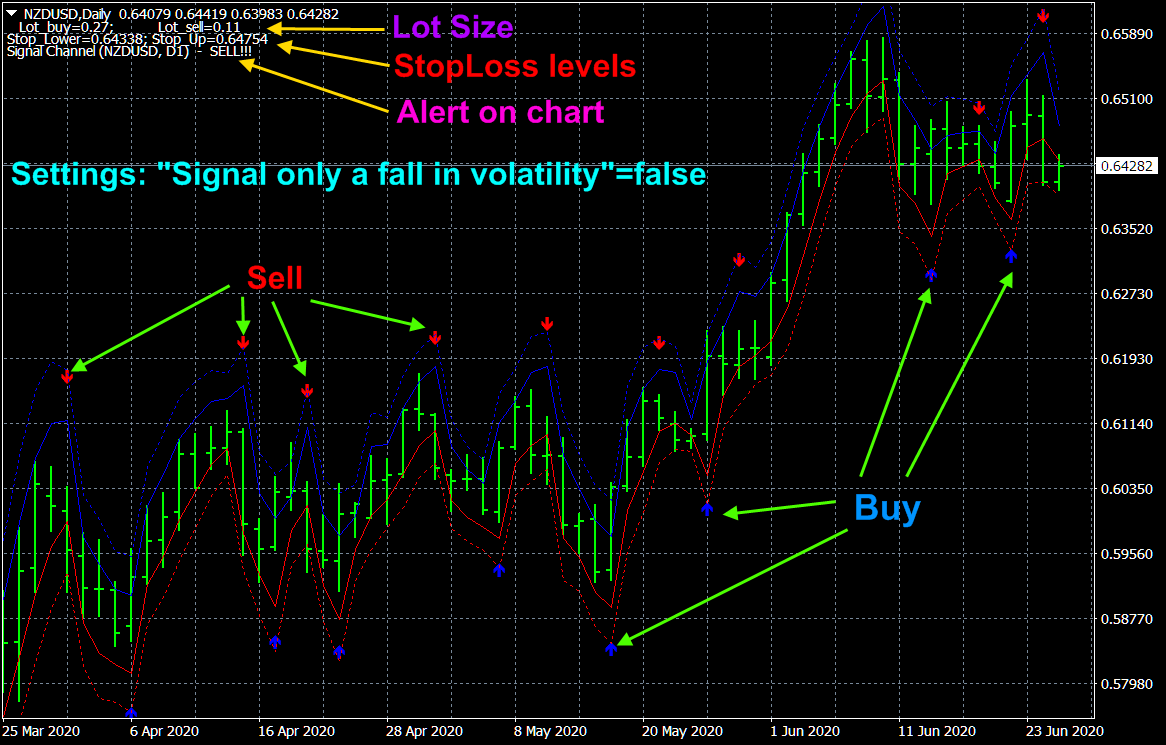
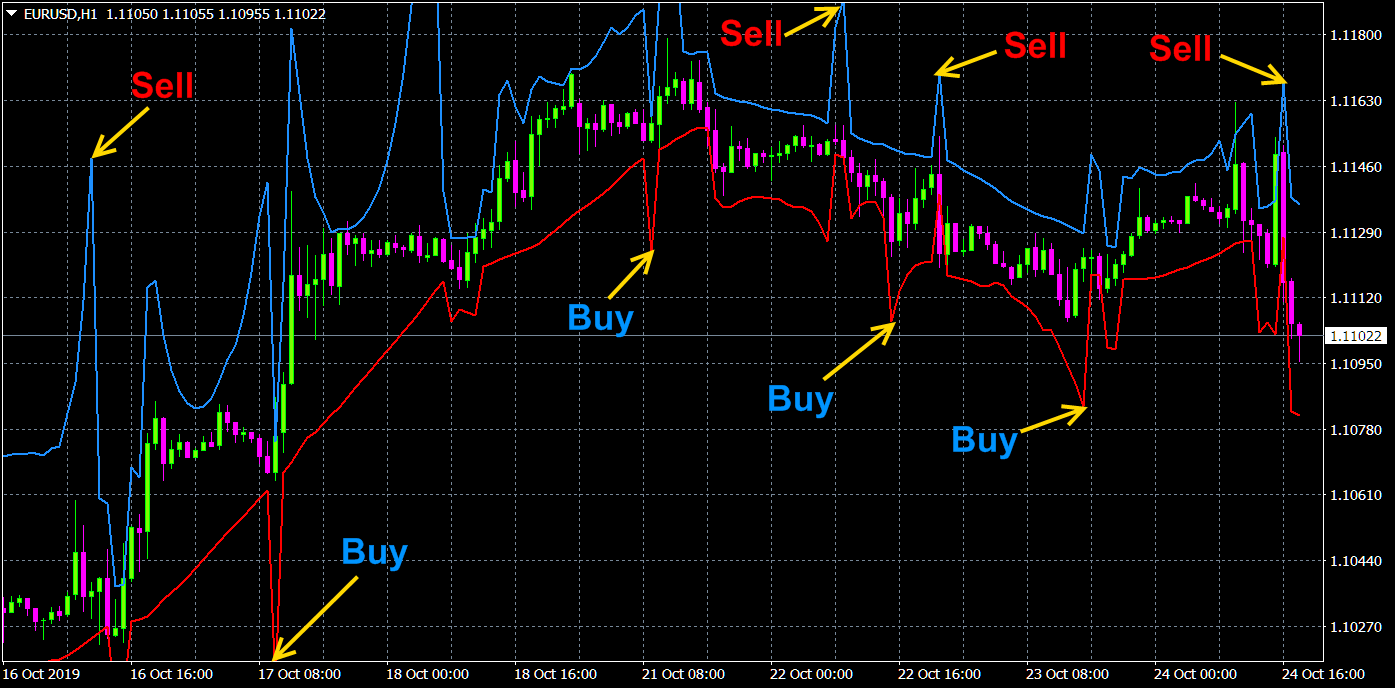
1) 🏆 Piyasa gürültüsünün optimal filtrelenmesine sahip göstergeler (açılış ve kapanış pozisyonları için noktaları seçmek için).
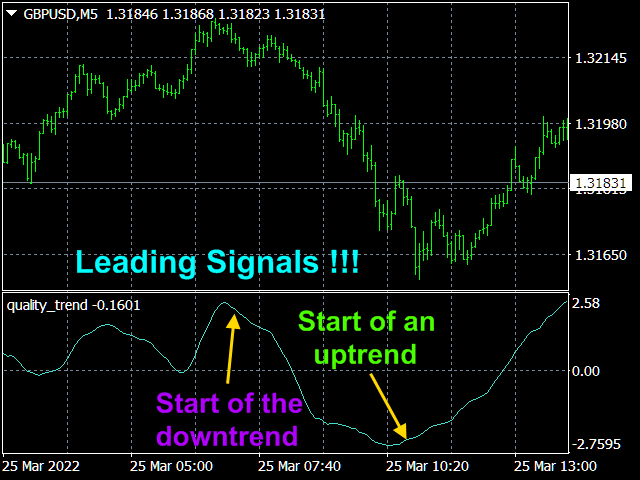
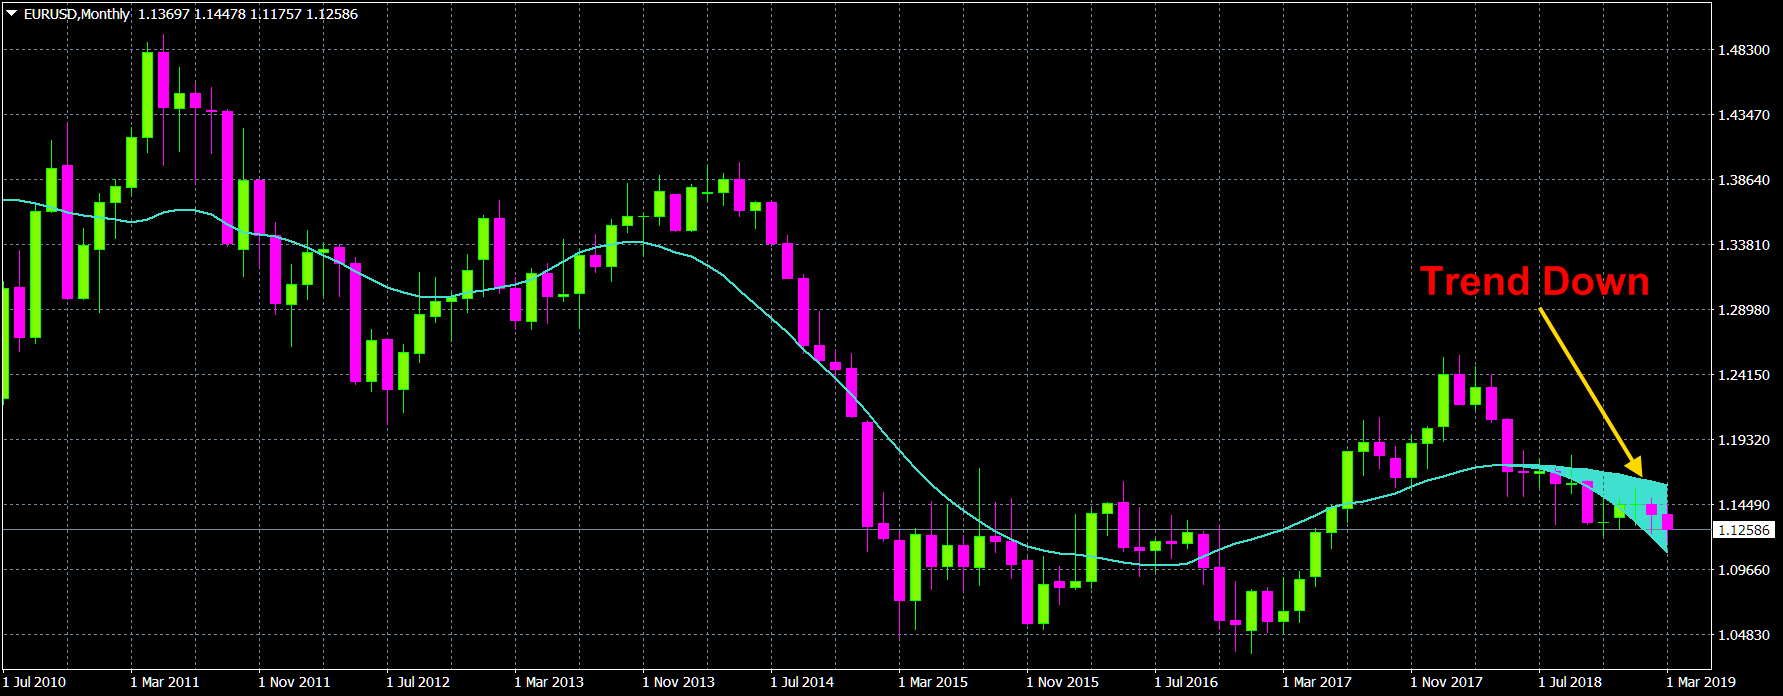
2) 🏆 İstatistiksel göstergeler (küresel eğilimi belirlemek için).
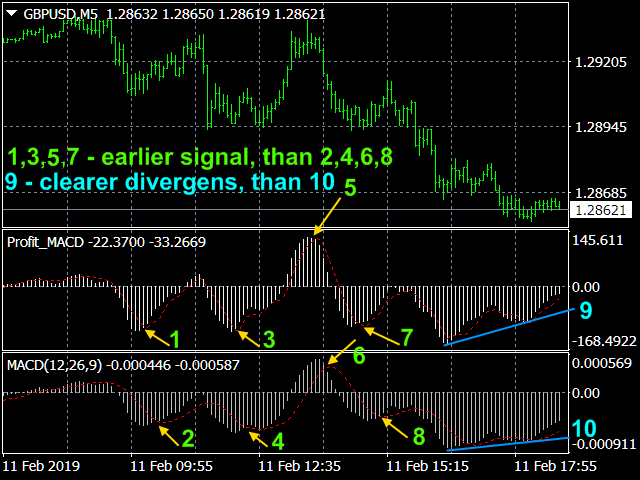
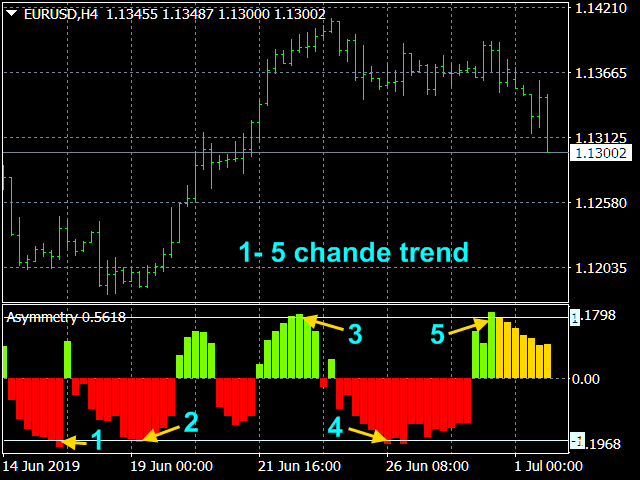
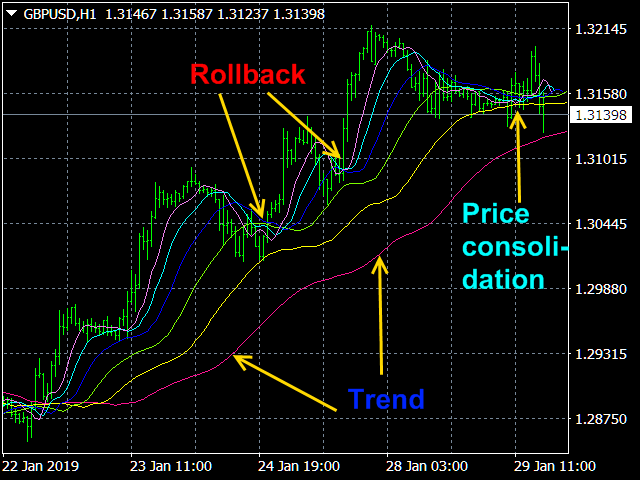
3) 🏆 Pazar araştırması göstergeleri (fiyat mikro yapısını netleştirmek, kanallar oluşturmak, trend dönüşleri ve geri çekilmeler arasındaki farkları belirlemek için).
----------------------------------------------------------------------------------------------------------------------------------
☛ Blogda daha fazla bilgi https://www.mql5.com/en/blogs/post/741637
On beş yıldır piyasanın matematiksel modellerini araştırmaya odaklanarak ticaret yapıyorum.
----------------------------------------------------------------------------------------------------------------------------------
💰 Sunulan ürünler:
1) 🏆 Piyasa gürültüsünün optimal filtrelenmesine sahip göstergeler (açılış ve kapanış pozisyonları için noktaları seçmek için).
2) 🏆 İstatistiksel göstergeler (küresel eğilimi belirlemek için).
3) 🏆 Pazar araştırması göstergeleri (fiyat mikro yapısını netleştirmek, kanallar oluşturmak, trend dönüşleri ve geri çekilmeler arasındaki farkları belirlemek için).
----------------------------------------------------------------------------------------------------------------------------------
☛ Blogda daha fazla bilgi https://www.mql5.com/en/blogs/post/741637

Aleksey Ivanov

· 1
votija.63
2023.02.28
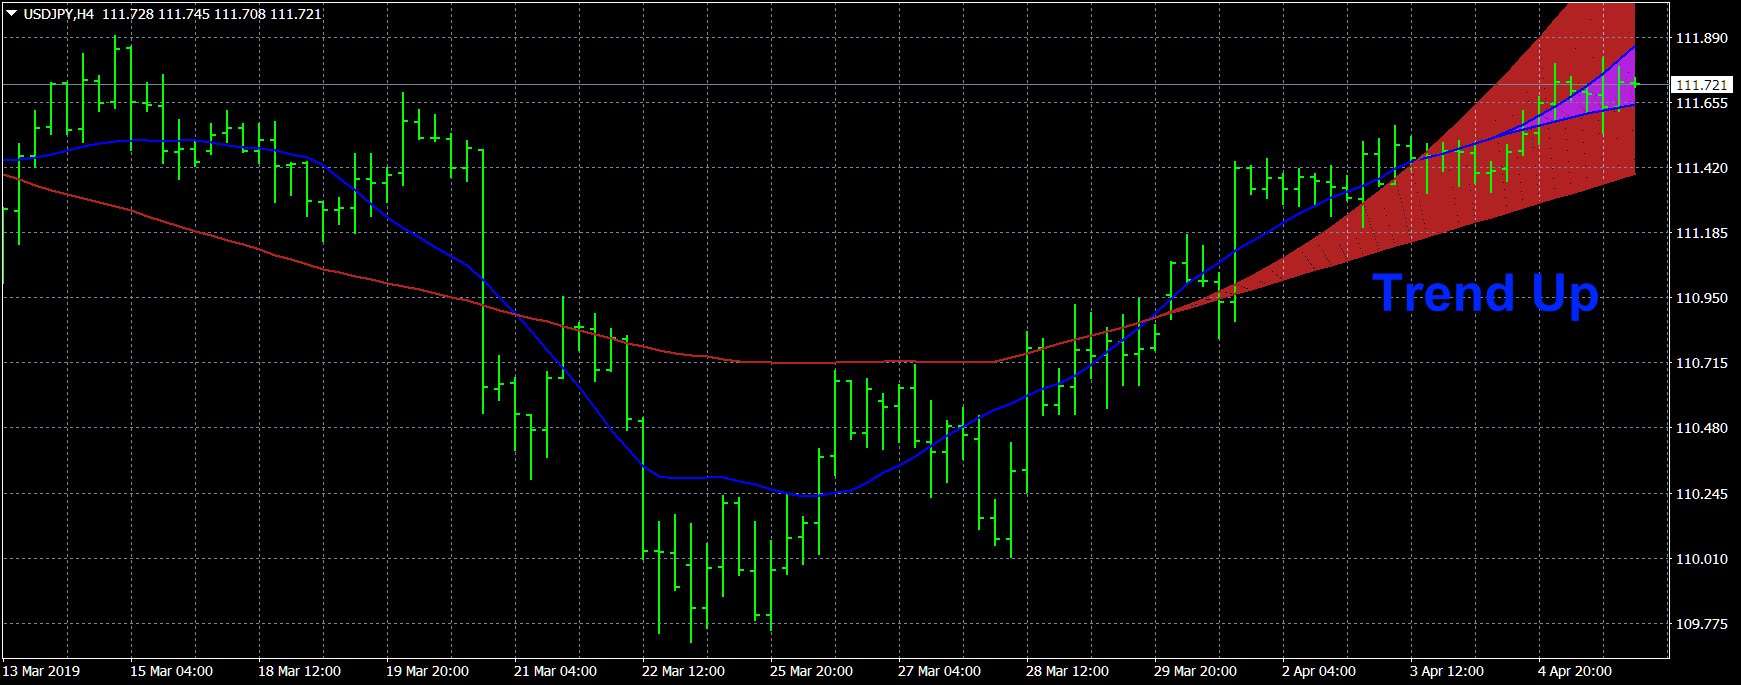
I don't know about you!! but red, everyone associates it with sell, and blue or green with buy!!! I don't want to think how good it is!!
Aleksey Ivanov
2023.03.01
The red line is the lower border of the channel. The blue line is the upper border of the channel.