Price Matrix
- Göstergeler
- Shellard Securities (Pty) Ltd
- Sürüm: 1.0
- Etkinleştirmeler: 5
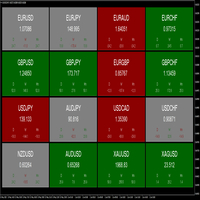
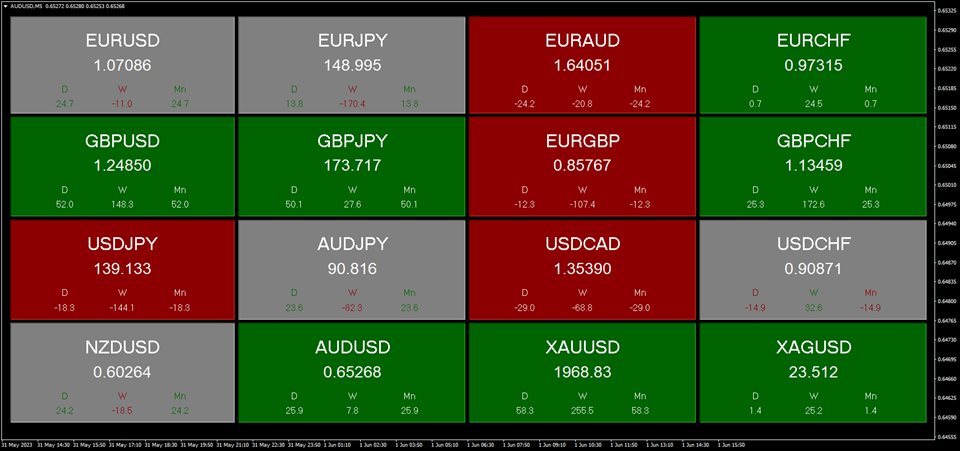
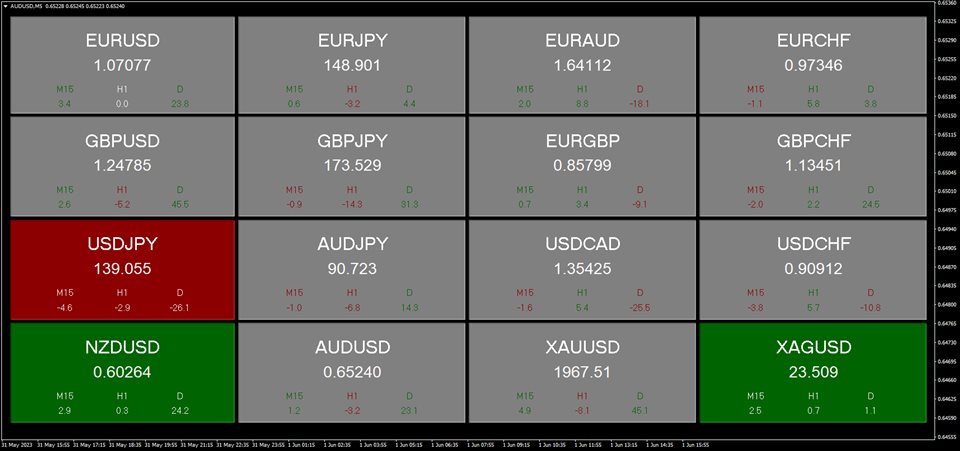
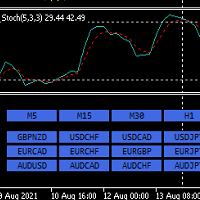
The dashboard indicator has been designed to quickly show the trader the price movements of various currency pairs.
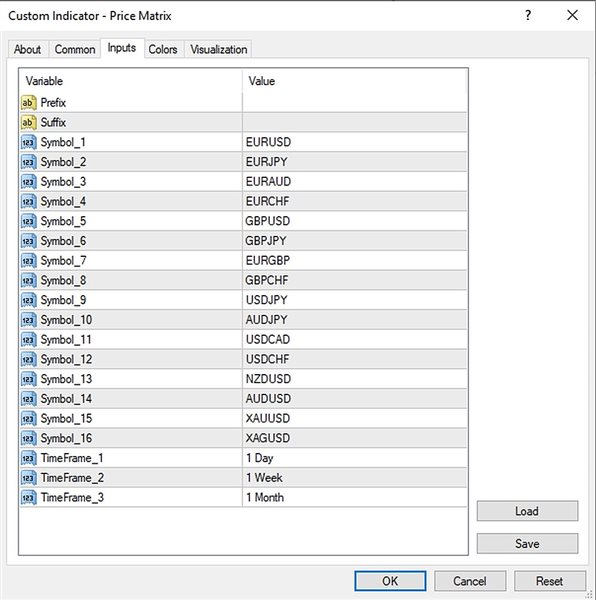
The user is able to select 3 different timeframes to analyse. When the pip difference for each respective timeframe is either positive or negative, the pair block will be coloured green or red respectively. This allows the trader to view which timeframes are in agreement, as well as the pip movements therein.
A good visual tool to view multiple pairs and timeframes at once.
This indicator will only display the main 28 Currency Pairs, as well as Gold and Silver.
