• Genel bakış
  • İncelemeler
  • Yorumlar (1)

DeMarker Smooth

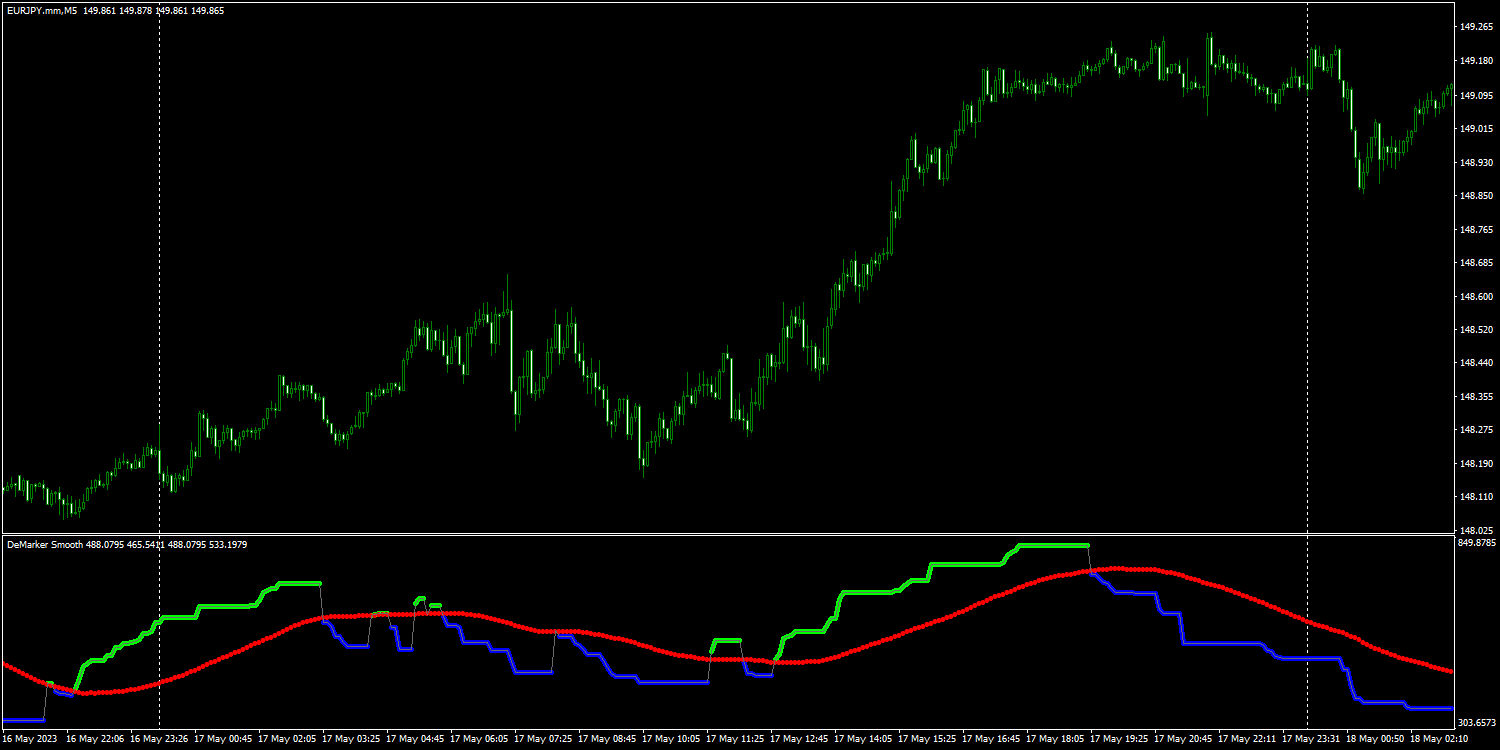
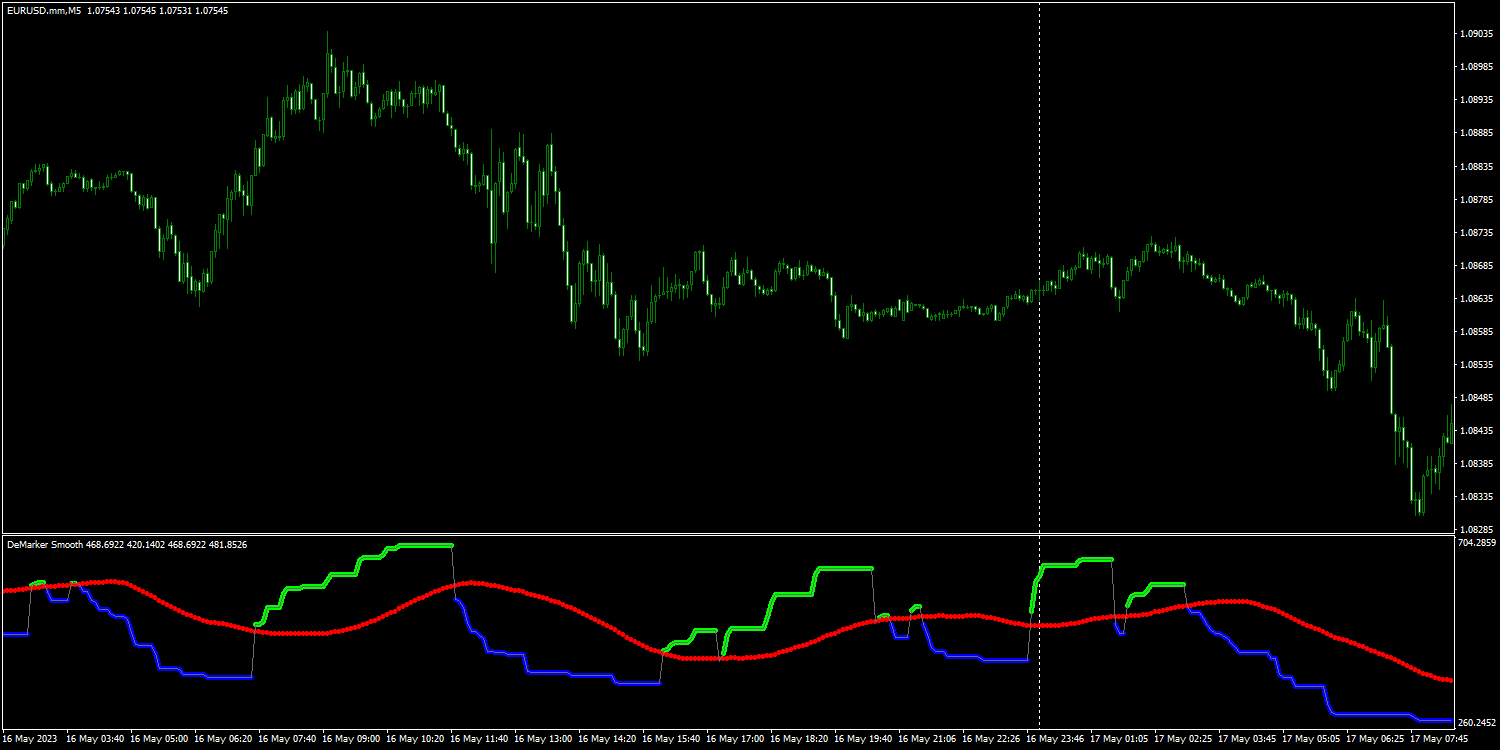
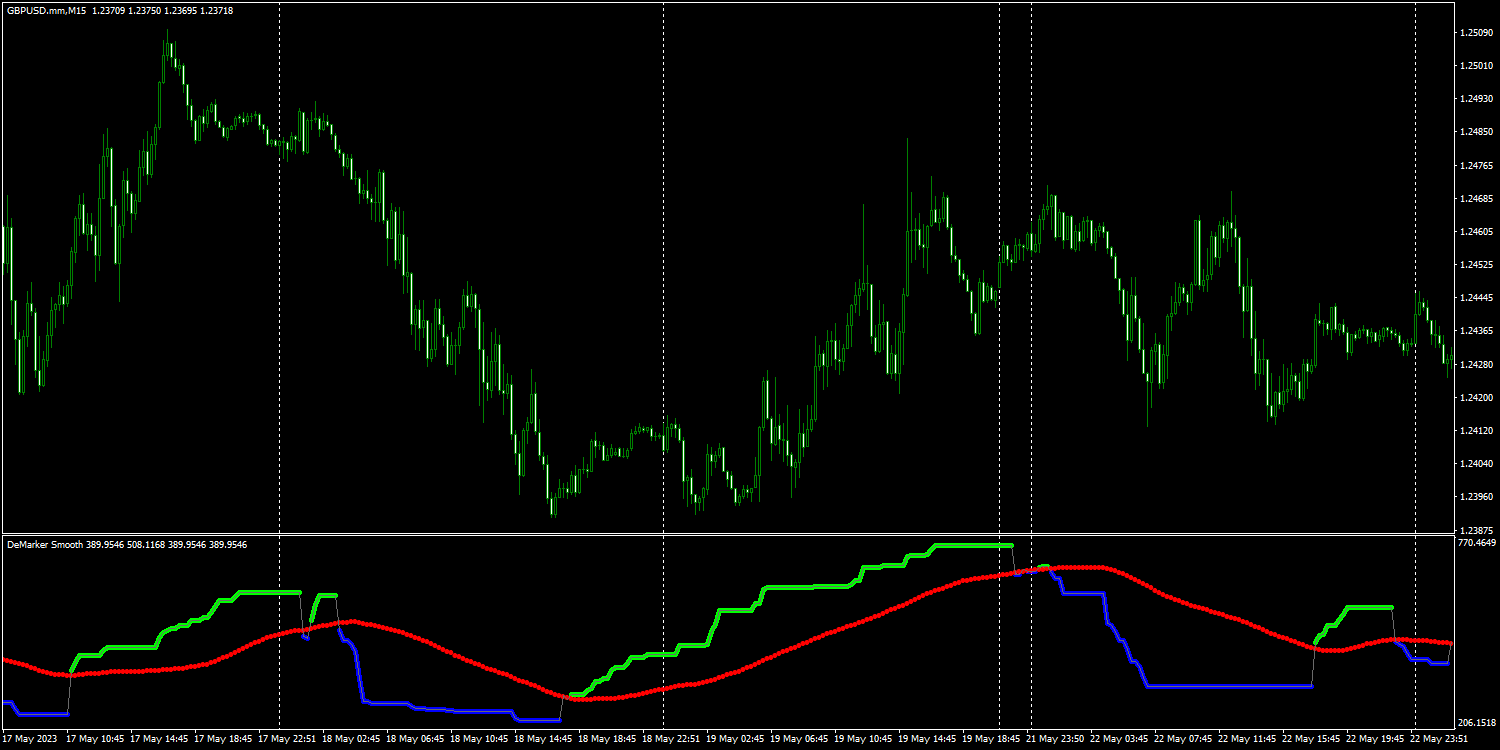
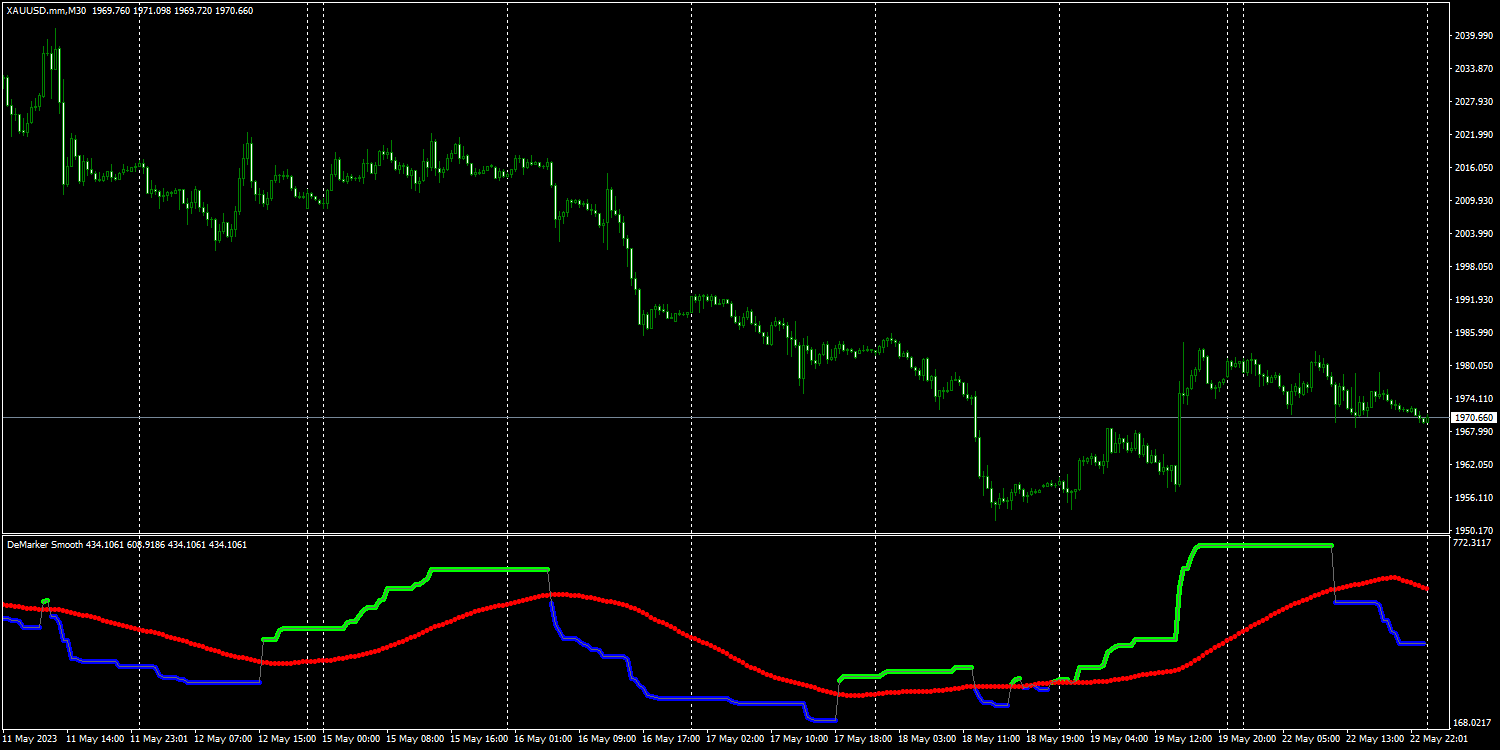
Smoothed oscillator based on basic DeMarker indicators. Shows the volatility of the price direction. Can be used to determine intraday entry and exit points from the market.
Suitable for use on all time frames and trading instruments. It is recommended to use on M5, M15 and M30.
The green line shows the price direction up, the blue line shows the price direction down. The red line is a smoothed representation of the price.

Input parameters

  •      Period - Period of the main indicator DeMarker
  •      Number Bars - The number of indicator bars on the chart.
Önerilen ürünler
Wise Men Indicator demo
Bohdan Kasyanenko
2 (1)
The indicator displays signals according to the strategy of Bill Williams on the chart. Demo version of the indicator has the same features as the paid, except that it can work only on a demo account . Signal "First Wise Man" is formed when there is a divergent bar with angulation.  Bullish divergent bar - with lower minimum and closing price in the upper half. Bearish divergent bar - higher maximum and the closing price at the bottom half. Angulation is formed when all three lines of Alligat
FREE
With the MACD Multi Time Frame indicator, you can spot divergences of higher timeframes while you are searching for pinpointed entries on lower timeframes. This FREE version of the indicator works only on EURUSD and GBPUSD. The full version of the indicator can be found here: MACD Multi Time Frame This blog post gives you REAL-TIME MACD Divergence Analysis for FREE and tips how to trade the divergences: REAL-TIME MACD Divergence Analysis The MACD Multi Time Frame gives you a very good overview o
FREE
Introducing the Consecutive Green/Red Candle Alert Indicator for MT4 - Your Trend Spotting Companion! Are you ready to take your trading to the next level? We present the Consecutive Green/Red Candle Alert Indicator, a powerful tool designed to help you spot trends and potential reversals with ease. Whether you're a new trader looking for clarity in the market or an experienced pro seeking additional confirmation, this indicator is your trusted companion. Key Features of the Consecutive Green/Re
FREE
PZ The Zone
PZ TRADING SLU
4.33 (3)
This indicator displays buy or sell signals according to Bill Williams' definition of the Trading Zone. [ Installation Guide | Update Guide | Troubleshooting | FAQ | All Products ] Easy to use and understand Avoid trading flat markets Deterministic indicator with clear rules The indicator is non-repainting It implements alerts of all kinds It has straightforward trading implications. A blue arrow is a buy signal A red arrow is a sell signal According to Bill Williams trading in the zone helps to
FREE
The Commitments of Traders Ratio Indicator is one of these things you never thought about it before you really see the magic behind it. The indicator shows the Ratio of long/short positions released by the CFTC once a week. If you have a look on the Sreenshot you can see two (three) zones of interest. Zone 1: The Switches (Red -> Green, Green -> Red) Zone 2: MA cross Zone 3: If you combine this with the COX indicator an additional zone will appear. You also can experiment with Ratio crossing M
FREE
TrendPlus
Sivakumar Subbaiya
4 (11)
Trend Plus   Trendplus  Indicator   Time Frame: Suitable for any time frame.  Purpose: Trend Prediction. Blue and red candle indicate the buy and sell call respectively. Buy: When the blue candle is formed buy call is initiated. close the buy trades when the next red candle will formed.   Sell: When the Red candle is formed Sell call is initiated. close the Sell trades when the next blue candle will formed.   Happy trade!!
FREE
TrueChannel
Aleksey Ivanov
5 (5)
The TrueChannel   indicator shows us the true price movement channels. This indicator resembles Donchian Channel   in its appearance, but is built on the basis of completely different principles and gives (in comparison with Donchian Channel , which is better just to use to assess volatility) more adequate trading signals.              As shown in the article , the price actually moves in channels parallel to the time axis and jumps abruptly from the previous channels to the subsequ
FREE
Triple RSI
Pablo Leonardo Spata
1 (1)
LOOK AT THE FOLLOWING STRATEGY WITH THIS INDICATOR. Triple RSI is a tool that uses the classic Relative Strength Indicator, but in several timeframes to find market reversals.    1.  ️ Idea behind the indicator and its strategy: In Trading, be it Forex or any other asset, the ideal is to keep it simple, the simpler the better . The triple RSI strategy is one of the simple strategies that seek market returns. In our experience, where there is more money to always be won, is in the marke
FREE
The Moving Average Convergence Divergence (MACD) işlem stratejisi, momentum ve trend yönündeki değişiklikleri belirlemek için kullanılan popüler bir teknik analiz aracıdır. MACD, 26 periyotlu üssel hareketli ortalamanın (EMA) 12 periyotlu EMA'dan çıkarılmasıyla hesaplanır. Ardından, "sinyal çizgisi" olarak adlandırılan 9 periyotlu EMA MACD'nin üzerine çizilir ve alım satım sinyalleri için bir tetikleyici olarak görev yapar. MACD, MACD hattı sinyal çizgisinin üzerindeyken boğa bölgesinde ve altın
FREE
MTF Fractals
Krisztian Kenedi
5 (3)
Multi timeframe fractal indicator which shows the higher timeframe's fractal point on lower timeframes. Parameters Fractal_Timeframe : You can set the higher timeframes for fractals. Maxbar : You can set the maximum number of candles for the calculations. Up_Fractal_Color, Up_Fractal_Symbol, Down_Fractal_Color, Down_Fractal_Symbol : Color and style settings of the fractal points. Extend_Line : Draws a horizontal line from the previous fractal point until a candle closes it over or a user-speci
FREE
Discover the power of precision and efficiency in your trading with the " Super Auto Fibonacci " MT4 indicator. This cutting-edge tool is meticulously designed to enhance your technical analysis, providing you with invaluable insights to make informed trading decisions. Key Features: Automated Fibonacci Analysis: Say goodbye to the hassle of manual Fibonacci retracement and extension drawing. "Super Auto Fibonacci" instantly identifies and plots Fibonacci levels on your MT4 chart, saving you tim
FREE
This indicator is a perfect tool able to compare which brokers have the lower latency. It shows us immediately which brokers are slower or faster. When you see the dot icon on the line, it means this broker is the faster one and the red line (Broker_A) is the slower one. See the example on the screenshot. How It Works? This indicator shares the prices information to and from the "shared" common data folder. It compares all the prices. The price is based on average by (Ask + Bid) / 2. There are
FREE
Adjustable Fractal MT4
Dmitry Timin
4.74 (19)
Adjustable Fractal MT4 is a modification of Bill Williams' Fractals indicator. The fractal consists of a two sets of arrows - up (upper fractals) and down (lower fractals). Each fractal satisfies the following conditions: Upper fractal - maximum (high) of a signal bar exceeds or is equal to maximums of all bars from the range to the left and to the right; Lower fractal - minimum (low) of a signal bar is less or equal to minimums of all bars from the range to the left and to the right. Unlike a s
FREE
Follow The Line
Oliver Gideon Amofa Appiah
4 (13)
FOLLOW THE LINE GET THE FULL VERSION HERE: https://www.mql5.com/en/market/product/36024 This indicator obeys the popular maxim that: "THE TREND IS YOUR FRIEND" It paints a GREEN line for BUY and also paints a RED line for SELL.  It gives alarms and alerts of all kinds. IT DOES NOT REPAINT and can be used for all currency pairs and timeframes. Yes, as easy and simple as that. Even a newbie can use it to make great and reliable trades. NB: For best results, get my other premium indicators for more
FREE
Trend Based Fibo MT4
Nguyen Tuan Son
3 (1)
The most Flexible & Reliable   Trend-Based Fibonacci indicator by Safe Trading. This indicator helps you calculate Trend-Based Fibonacci levels base on the main and retracement trends to predict future price . If you just looking for a simple Fibonacci Retracement indicator, please use  this Free indicator . ### FEATURES ### Auto-calculate up to 7 Trend-Based Fibonacci levels on adjustable frame. Adjust Fibonacci levels as your need. Adjust the start and the end of calculated frame in indicato
FREE
Gösterge, grafikteki terminal RSI osilatörüne dayalı sinyalleri gösterir. Tekrarlanan sinyalleri filtrelemek mümkündür. Burada osilatör bir ters sinyal aramak için kullanılır. Salıncak stratejilerinde ve seviyelerden alım satımda bir giriş noktası olarak önerilir. Çok para birimli gösterge tablosu mevcuttur. Bununla birlikte, grafikler arasında kolayca geçiş yapabilirsiniz. Ürün tartışmalarında, panoyu yerleştirebileceğiniz bir algoritma önerebilirsiniz. Giriş parametreleri. Ana Ayarlar
FREE
MACD Double
Dorian Baranes
5 (3)
This indicator calculates buy and sell signals by using MACD indicator on two timeframes. MACD is a trend-following showing the relationship between two moving averages of the closing price. The MACD is calculated by subtracting the 26-period Exponential Moving Average (EMA) from the 12-period EMA.The result of that calculation is the MACD line. A nine-day EMA of the MACD called the "signal line". This indicator has 2 modes to calculate the buy/sell signals: - MACD crosses 0 line - MACD cro
FREE
RSI divergence indicator finds divergences between price chart and RSI   indicator and informs you with alerts (popup, mobile notification or email). Its main use is to find trend reversals in the chart. Always use the divergence indicators with other technical assets like support resistance zones, candlestick patterns and price action to have a higher possibility to find trend reversals. Three confirmation type for RSI   divergences: RSI   line cross 50 level Price returns to previous H/L Creat
FREE
Download the free version   here. Divergence Divergence refers to when the price of a currency pair moves in one direction while the trend indicator is moving in the opposite direction. With divergence, there can be positive and negative signals. Divergences in Forex trading are quite common signals of technical analysis. These are basic early Forex signals indicating the trend reversal and filter false signals. Application of this indicator It is usually not easy to detect divergences by the t
FREE
PZ Oscillator
PZ TRADING SLU
3.17 (6)
This is a smooth and responsive accelerometer which reveals the market trend and strength. [ Installation Guide | Update Guide | Troubleshooting | FAQ | All Products ] Two moving averages indicate trend direction The histogram represents strength of the price movement It draws buy and sell zones as colored vertical lines Should be used as a confirmation indicator Customizable line widths and colors It implements alerts of all kinds This indicator is similar to MACD but aims to react faster t
FREE
Awesome MACD Indicator
Komang Putra Riswanjaya
Awesome MACD Indicator is a powerful trading tool that combines the strengths of Moving Average (MA) and Moving Average Convergence Divergence (MACD) to provide accurate and reliable trading signals. Designed for forex and stock traders, this indicator simplifies the identification of trading opportunities by detecting significant crosses in price movements. Key Features: MA and MACD Combination: Awesome MACD leverages the power of Moving Averages (MA) to identify short-term and long-term trends
FREE
QualifiedEngulfing
Ashkan Hazegh Nikrou
QualifiedEngulfing, ProEngulfing Göstergesi'nin ücretsiz sürümüdür. ProEngulfing , Advance Engulf Göstergesi'nin ücretli sürümüdür. İndirin buradan. ProEngulfing'in ücretsiz ve ücretli sürümleri arasındaki fark nedir? Ücretsiz sürümünde bir gün içinde bir sinyal kısıtlaması bulunmaktadır. QualifiedEngulfing Tanıtımı - MT4 İçin Profesyonel Engulf Deseni Göstergeniz QualifiedEngulfing ile precision gücünü serbest bırakın; forex piyasasındaki nitelikli engulf desenlerini belirlemek ve vurgulamak i
FREE
PREVIOUS INDICATOR’S DATA MA CROSSOVER https://www.mql5.com/en/users/earobotkk/seller#products P/S: If you like this indicator, please rate it with 5 stars in the review section, this will increase its popularity so that other users will be benefited from using it. This indicator notifies and draws an arrow on the chart whenever    the MA line has crossed over its previous indicator’s data MA filtered by MA Trend.   It also displays total pips gained from all the entry set-ups. Setting ·   You
FREE
MACD Max Free
John Louis Fernando Diamante
5 (1)
A flexible 2-Line MACD indicator The default MACD indicator inside MT4, limits you to using the MACD with a fast-EMA, slow-EMA, and signal-SMA. This MACD indicator allows you to set your own MA-Method choices for these 3 components, separately! You can select from SMA-EMA-SMMA-LWMA, and can even use a separate method for each 3 fast-slow-signal periods. A more featured version is available with colored candles+conditions, full alerts+conditions, line coloring, DEMA and TEMA options; MACD MAX
FREE
Signals and Alerts for Accelerator/Decelerator indicator based on these MQL5 posts: Accelerator Oscillator and Signals of the Indicator Accelerator Oscillator . Note : this tool is based on the code of Accelerator indicator developed by MetaQuotes Software Corp. Features The signals are triggered at   closing   of last bar/opening of a new bar; Any kind of alerts can be enabled: Dialog Box, Email message, SMS notifications for smartphones and tablets, and Sound alerts; Customizable arrows. By
FREE
Multi Divergence Indicator for MT4 - User Guide Introduction Overview of the Multi Divergence Indicator and its capabilities in identifying divergences across multiple indicators. Importance of divergence detection in enhancing trading strategies and decision-making. List of Indicators RSI CCI MACD STOCHASTIC AWSOME MFI ACCELERATOR OSMA MOMENTUM WPR( Williams %R) RVI Indicator Features Indicator Selection: How to enable/disable specific indicators (RSI, CCI, MACD, etc.) for divergence detection.
FREE
GTAS STrend
Riviera Systems
5 (1)
GTAS S-Trend is a momentum indicator that helps to determine trends using combination of MACD, RSI and moving averages. This indicator was created by Bernard Prats Desclaux, proprietary trader and ex-hedge fund manager, founder of E-Winvest. Description The indicator oscillates between -65 and +65 with a neutral zone between -25 and +25 around a 0 equilibrium line. S-Trend between -25 and +25 indicates congestion zones with a bullish bias between 0 and +25, and a bearish bias between 0 and -25
FREE
FFx OsMA
Eric Venturi-Bloxs
5 (1)
The purpose of this new version of the MT4 standard indicator provided in your platform is to display in a sub-window multiple timeframes of the same indicator. See the example shown in the picture below. But the display isn’t like a simple MTF indicator. This is the real display of the indicator on its timeframe. Here's the options available in the FFx indicator: Select the timeframes to be displayed (M1 to Monthly) Define the width (number of bars) for each timeframe box Alert pop up/sound/ema
FREE
FFx MACD
Eric Venturi-Bloxs
4.25 (4)
The purpose of this new version of the MT4 standard indicator provided in your platform is to display in a sub-window multiple timeframes of the same indicator. See the example shown in the picture below. But the display isn’t like a simple MTF indicator. This is the real display of the indicator on its timeframe. Here's the options available in the FFx indicator: Select the timeframes to be displayed (M1 to Monthly) Define the width (number of bars) for each timeframe box Alert pop up/sound/ema
FREE
RSI Color and Notification Setting Usages :: 1. Set value Oversold and Overbought 2. Set period RSI 3. Set Color 4. Notify to Alert, Email and Mobile. For Trading :: Forex and Binary option 1. When the color alarm occurs in the OVB area, do the preparation. To enter a Sell order 2. When the color alarm occurs in the OVS area, do the preparation. To enter a Buy order 3. When RSI is between OVB and OVS, consider another indicator to trade.
FREE
Bu ürünün alıcıları ayrıca şunları da satın alıyor
Gann Made Easy
Oleg Rodin
4.84 (58)
Gann Made Easy , bay teorisini kullanarak ticaretin en iyi ilkelerine dayanan, profesyonel ve kullanımı kolay bir Forex ticaret sistemidir. WD Gann. Gösterge, Zararı Durdur ve Kâr Al Seviyeleri dahil olmak üzere doğru SATIN AL ve SAT sinyalleri sağlar. PUSH bildirimlerini kullanarak hareket halindeyken bile işlem yapabilirsiniz. Lütfen satın aldıktan sonra benimle iletişime geçin! Alım satım ipuçlarımı ve harika bonus göstergelerini ücretsiz olarak sizinle paylaşacağım! Muhtemelen Gann ticaret y
Atomic Analyst
Issam Kassas
5 (2)
Öncelikle belirtmek gerekir ki bu Ticaret Göstergesi Yeniden Çizim Yapmaz, Gecikmez ve Gecikme Göstermez, bu da hem manuel hem de robot ticareti için ideal hale getirir. Kullanıcı kılavuzu: ayarlar, girişler ve strateji. Atom Analisti, Piyasada Daha İyi Bir Avantaj Bulmak İçin Fiyatın Gücünü ve Momentumunu Kullanan PA Fiyat Hareketi Göstergesidir. Gürültüleri ve Yanlış Sinyalleri Kaldırmaya ve Ticaret Potansiyelini Artırmaya Yardımcı Olan Gelişmiş Filtrelerle Donatılmıştır. Birden fazla katma
TPSpro RFI Levels
Roman Podpora
4.8 (20)
Reversal First Impulse levels (RFI)    INSTRUCTIONS        RUS       -       ENG              R ecommended to use with an indicator   -   TPSpro  TREND PRO -  Version MT5 A key element in trading is zones or levels from which decisions to buy or sell a trading instrument are made. Despite attempts by major players to conceal their presence in the market, they inevitably leave traces. Our task was to learn how to identify these traces and interpret them correctly. Main functions: Displaying activ
Scalper Inside PRO
Alexey Minkov
4.69 (49)
An exclusive indicator that utilizes an innovative algorithm to swiftly and accurately determine the market trend. The indicator automatically calculates opening, closing, and profit levels, providing detailed trading statistics. With these features, you can choose the most appropriate trading instrument for the current market conditions. Additionally, you can easily integrate your own arrow indicators into Scalper Inside Pro to quickly evaluate their statistics and profitability. Scalper Inside
Trend Punch
Mohamed Hassan
5 (13)
This indicator is unstoppable when combined with our other indicator called  Support & Resistance . After purchase, send us a message and you will get it   for  FREE as a BONUS! Introducing Trend Punch , the revolutionary forex trend indicator that will transform the way you trade! Trend Punch is uniquely designed to provide precise buy and sell arrows during strong market trends, making your trading decisions clearer and more confident. Whether you're trading major currency pairs or exotic sym
Gold Stuff
Vasiliy Strukov
4.89 (202)
Gold Stuff, özellikle altın için tasarlanmış bir trend göstergesidir ve herhangi bir finansal enstrümanda da kullanılabilir. Gösterge yeniden çizilmez ve gecikmez. Önerilen zaman dilimi H1. Bu göstergede tam otomatik Uzman Danışman EA Gold Stuff çalışır. Profilimde bulabilirsiniz. Ayarları ve kişisel bir bonusu almak için satın alma işleminden hemen sonra benimle iletişime geçin!  Güçlü Destek ve Trend Tarayıcı göstergemizin ücretsiz bir kopyasını pm'den alabilirsiniz. Ben! AYARLAR Ok Ç
Trend Screener
STE S.S.COMPANY
4.79 (81)
Trend Göstergesi, Trend Alım Satım ve Filtreleme için Çığır Açan Benzersiz Çözüm, Tüm Önemli Trend Özellikleriyle Tek Bir Araç İçinde Yerleştirildi! Forex, emtialar, kripto para birimleri, endeksler ve hisse senetleri gibi tüm sembollerde/araçlarda kullanılabilen %100 yeniden boyamayan çoklu zaman çerçevesi ve Çoklu para birimi göstergesidir. SINIRLI SÜRELİ TEKLİF: Destek ve Direnç Tarama Göstergesi sadece 100$ ve ömür boyu mevcuttur. (Orijinal fiyat 250$) (teklif uzatıldı) Trend Screener, grafi
Trend Pulse
Mohamed Hassan
5 (2)
Please contact me after purchase to immediately get your PDF strategy + documentation for Trend Pulse !  Official release price of $89  (3 /50 copies left). Next price is $199 . Introducing Trend Pulse , a unique and robust indicator capable of detecting bullish, bearish, and even ranging trends! Trend Pulse uses a special algorithm to filter out market noise with real precision. If the current symbol is moving sideways, Trend Pulse will send you a ranging signal, letting you know that it'
TPSproTREND PrO
Roman Podpora
4.79 (19)
TPSpro TREND PRO,   piyasayı otomatik olarak analiz eden, trend ve değişimlerinin her biri hakkında bilgi sağlayan, ayrıca yeniden çizmeden işlemlere girme sinyalleri veren bir trend göstergesidir! Gösterge her mumu ayrı ayrı analiz ederek kullanır. farklı dürtülere atıfta bulunur - yukarı veya aşağı dürtü. Para birimleri, kripto paralar, metaller, hisse senetleri ve endeksler için işlemlere tam giriş noktaları! Sürüm MT5                   GÖSTERGENİN TAM AÇIKLAMASI       Bunu -   RFI SEVİYELER
FX Power MT4 NG
Daniel Stein
5 (12)
Sabah Brifingimiz burada mql5 ve on Telegram! FX Power MT4 NG , uzun zamandır çok popüler olan döviz gücü ölçerimiz FX Power'ın yeni neslidir. Peki bu yeni nesil güç ölçer ne sunuyor? Orijinal FX Power hakkında sevdiğiniz her şey PLUS GOLD/XAU güç analizi Daha da hassas hesaplama sonuçları Ayrı ayrı yapılandırılabilir analiz dönemleri Daha da iyi performans için özelleştirilebilir hesaplama limiti Özel çokluDaha fazlasını görmek isteyenler için örnek ayarlar Her grafikte en sevdiğiniz renkler i
ŞU ANDA %26 INDIRIMLI Yeni Başlayanlar veya Uzman Tüccarlar için En İyi Çözüm! Bu Gösterge benzersiz, yüksek kaliteli ve uygun fiyatlı bir ticaret aracıdır çünkü bir dizi tescilli özellik ve yeni bir formül ekledik. Sadece BİR grafik ile 28 Forex çifti için Döviz Gücünü okuyabilirsiniz! Yeni bir trendin veya scalping fırsatının tam tetik noktasını belirleyebildiğiniz için ticaretinizin nasıl gelişeceğini hayal edin? Kullanım kılavuzu: buraya tıklayın Bu ilk olan, orijinal! Değersiz bir
Advanced Supply Demand
Bernhard Schweigert
4.9 (271)
CURRENTLY 26% OFF !! Best Solution for any Newbie or Expert Trader! This indicator is a unique, high quality and affordable trading tool because we have incorporated a number of proprietary features and a new formula. With this update, you will be able to show double timeframe zones. You will not only be able to show a higher TF but to show both, the chart TF, PLUS the higher TF: SHOWING NESTED ZONES. All Supply Demand traders will love it. :) Important Information Revealed Maximize the potenti
Tanıtım       Kuantum Trend Keskin Nişancı Göstergesi   , trend tersine dönmeleri belirleme ve ticaret yapma şeklinizi değiştiren çığır açan MQL5 Göstergesi! 13 yılı aşkın ticaret tecrübesine sahip deneyimli tüccarlardan oluşan bir ekip tarafından geliştirilmiştir.       Kuantum Trend Keskin Nişancı Göstergesi       trend dönüşlerini son derece yüksek doğrulukla belirlemenin yenilikçi yolu ile ticaret yolculuğunuzu yeni zirvelere taşımak için tasarlanmıştır. ***Kuantum Trend Keskin Nişancı Gö
Şu anda %20 İNDİRİMLİ! Herhangi bir Acemi veya Uzman Tüccar için En İyi Çözüm! Bu gösterge paneli yazılımı 28 döviz çifti üzerinde çalışıyor. Ana göstergelerimizden 2'sine (Gelişmiş Para Birimi Gücü 28 ve Gelişmiş Para Birimi Dürtüsü) dayanmaktadır. Tüm Forex piyasasına harika bir genel bakış sağlar. Gelişmiş Para Birimi Gücü değerlerini, para birimi hareket hızını ve tüm (9) zaman dilimlerinde 28 Forex çifti için sinyalleri gösterir. Trendleri ve / veya scalping fırsatlarını belirlemek içi
ŞU ANDA %31 INDIRIMLI !!! Yeni Başlayanlar veya Uzman Tüccarlar için En İyi Çözüm! Bu gösterge benzersiz, yüksek kaliteli ve uygun fiyatlı bir ticaret aracıdır çünkü bir dizi tescilli özellik ve gizli bir formül ekledik. Yalnızca BİR grafikle 28 döviz çiftinin tümü için Uyarılar verir. Yeni bir trendin veya scalping fırsatının tam tetik noktasını belirleyebildiğiniz için ticaretinizin nasıl gelişeceğini hayal edin! Yeni temel algoritmalar üzerine inşa edilen bu sistem, potansiyel işlemler
Bomb Bank Signal
Igor Pereira Calil
Bomb Bank Signal: Your Trusted Indicator for MetaTrader 4 The Bomb Bank Signal is a powerful indicator for MetaTrader 4, designed to identify the most relevant trends in the financial market. If you are looking for a tool that accurately anticipates movements, Bomb Bank is the ally you need. How it Works: This indicator combines three distinct methods – volume analysis, candle closes and symmetrical trend – to detect and signal buying and selling opportunities. Bomb Bank is like a "bomb"
- Real price is 80$ - 40% Discount ( It is 49$ now ) Contact me for instruction, any questions! Related EA Product: Bitcoin Expert Introduction The breakout and retest strategy is traded support and resistance levels. it involves price breaking through a previous level.  The break and retest strategy is designed to help traders do two main things, the first is to avoid false breakouts. Many false breakouts start with a candlestick that breaks out of a level but ends with an immediate candlestic
Öncelikle, bu Ticaret Aracının Non-Repainting, Non-Redrawing ve Non-Lagging Gösterge olduğunu vurgulamakta fayda var, bu da onu profesyonel ticaret için ideal hale getiriyor. Çevrimiçi kurs, kullanıcı kılavuzu ve demo. Akıllı Fiyat Hareketi Kavramları Göstergesi, hem yeni hem de deneyimli tüccarlar için çok güçlü bir araçtır. İleri ticaret fikirlerini, Inner Circle Trader Analizi ve Smart Money Concepts Ticaret Stratejileri gibi 20'den fazla kullanışlı göstergeyi bir araya getirerek bir araya g
Currency Strength Wizard , başarılı ticaret için size hepsi bir arada çözüm sağlayan çok güçlü bir göstergedir. Gösterge, birden çok zaman dilimindeki tüm para birimlerinin verilerini kullanarak şu veya bu forex çiftinin gücünü hesaplar. Bu veriler, şu veya bu para biriminin gücünü görmek için kullanabileceğiniz, kullanımı kolay para birimi endeksi ve para birimi güç hatları biçiminde temsil edilir. İhtiyacınız olan tek şey, işlem yapmak istediğiniz tabloya göstergeyi eklemektir ve gösterge size
Fiyat tersine döndükçe ve geri çekildikçe piyasa yapısından elde edilen kâr değişir. Piyasa yapısını tersine çevirme uyarısı göstergesi, bir trendin veya fiyat hareketinin ne zaman tükenmeye yaklaştığını ve tersine dönmeye hazır olduğunu tanımlar. Genellikle bir geri dönüş veya büyük bir geri çekilme meydana gelmek üzereyken meydana gelen piyasa yapısındaki değişiklikler konusunda sizi uyarır. Gösterge, olası bir tükenme noktasının yakınında her yeni yüksek veya düşük oluştuğunda, başlangıçta
Order Block Hunter
Noha Mohamed Fathy Younes Badr
5 (1)
Order block hunter indicator is the best indicator for  hunt the order blocks that area where there has been a large concentration of limit orders waiting to be executed Order blocks are identified on a chart by observing previous price action and looking for areas where the price experienced significant movement or sudden changes in direction .This indicator does that for you by using very complicated codes and helps you to take the best areas To buy and sell because it make marks at the best a
Scalper Vault
Oleg Rodin
5 (22)
Scalper Vault , başarılı bir scalping için ihtiyacınız olan her şeyi size sağlayan profesyonel bir scalping sistemidir. Bu gösterge, forex ve ikili opsiyon tüccarları tarafından kullanılabilecek eksiksiz bir ticaret sistemidir. Önerilen zaman çerçevesi M5'tir. Sistem size trend yönünde doğru ok sinyalleri sağlar. Ayrıca size üst ve alt sinyaller ve Gann piyasa seviyeleri sağlar. Göstergeler, PUSH bildirimleri dahil her türlü uyarıyı sağlar. Göstergeyi satın aldıktan sonra lütfen benimle iletişim
Özel MT4 göstergemizle başarılı forex ticaretinin sırrını keşfedin! Forex piyasasında nasıl başarıya ulaşacağınızı hiç merak ettiniz, riski en aza indirirken sürekli olarak kar kazandınız mı? İşte aradığınız cevap! Ticaret yaklaşımınızda devrim yaratacak tescilli MT4 göstergimizi tanıtmamıza izin verin. Benzersiz çok yönlülük Göstergemiz, Renko ve RangeBar Mum oluşumlarını tercih eden kullanıcılar için özel olarak tasarlanmıştır. Bu grafik türlerinin birçok deneyimli tüccar tarafından ter
TakePropips Donchian Trend Pro
Eric John Pajarillaga Aldana
5 (11)
TakePropips Donchian Trend Pro   (MT4), Donchian Kanalı'nı kullanarak trendin yönünü otomatik olarak tespit eden ve size ticarete giriş ve çıkış sinyalleri sağlayan güçlü ve etkili bir araçtır! Bu çok işlevli gösterge, bir trend tarayıcı, ticaret sinyalleri, istatistiksel panel, tarayıcı, ticaret oturumları ve uyarı geçmişi panosu içerir. Size ticaret sinyalleri sağlamak ve çizelgeleri analiz ederek saatlerce tasarruf etmenizi sağlamak için tasarlanmıştır! Kullanım kılavuzunu ve kurulum kılavuzu
ÜRÜNÜ SATIN ALMADAN ÖNCE LÜTFEN AŞAĞIDAKİ BİLGİLERİ OKUYUNUZ! Apollo Pips PLUS SP benzersiz bir üründür! YENİ "APOLLO PIPS" GÖSTERGEMİ ARTI TÜM İŞLEM GÖSTERGELERİME ERİŞİM İLE "SÜPER PAKET" BONUSUNU ALMAK İSTEYENLER İÇİN! Apollo Pips PLUS SP ürününü satın alarak aslında Apollo Pips göstergemin tamamen yeni bir versiyonunu satın almış oluyorsunuz. Göstergenin bu sürümü, geliştirilmiş bir algoritmaya ve kullanımı kolay bir parametreye sahiptir; bu, size göstergeyi herhangi bir piyasada ve herhangi
FX Volume
Daniel Stein
4.48 (27)
Sabah Brifingimiz aracılığıyla ayrıntılar ve ekran görüntüleri ile günlük piyasa güncellemenizi alın burada mql5 ve on Telegram ! FX Volume, bir brokerin bakış açısından piyasa duyarlılığı hakkında GERÇEK bir fikir veren İLK ve TEK hacim göstergesidir. COT raporlarından çok daha hızlı bir şekilde, brokerlar gibi kurumsal piyasa katılımcılarının Forex piyasasında nasıl konumlandıklarına dair harika bilgiler sağlar. Bu bilgileri doğrudan grafiğinizde görmek, ticaretiniz için gerçek oyun değiştir
Currency Strength Exotics
Bernhard Schweigert
4.86 (29)
ŞU ANDA %20 INDIRIMLI! Herhangi bir Acemi veya Uzman Tüccar için En İyi Çözüm! Bu Gösterge, Egzotik Çiftler Emtialar, Endeksler veya Vadeli İşlemler gibi herhangi bir sembol için para birimi gücünü göstermek için uzmanlaşmıştır. Türünün ilk örneğidir, Altın, Gümüş, Petrol, DAX, US30, MXN, TRY, CNH vb. gerçek para birimi gücünü göstermek için 9. satıra herhangi bir sembol eklenebilir. Bu benzersiz, yüksek kaliteli ve uygun fiyatlı bir ticaret aracıdır çünkü bir dizi tescilli özelliği ve yeni
IX Power MT4
Daniel Stein
5 (5)
IX Power nihayet FX Power'ın rakipsiz hassasiyetini Forex dışı sembollere getiriyor. En sevdiğiniz endeksler, hisse senetleri, emtialar, ETF'ler ve hatta kripto para birimlerindeki kısa, orta ve uzun vadeli eğilimlerin yoğunluğunu doğru bir şekilde belirler. Terminalinizin sunduğu her şeyi analiz edebilirsiniz. Deneyin ve işlem yaparken zamanlamanızın nasıl önemli ölçüde iyileştiğini deneyimleyin. IX Power Temel Özellikler 100 hassas, yeniden boyanmayan hesaplama sonuçları - terminalini
Entry Points Pro
Yury Orlov
4.55 (143)
Yeniden boyamadan bir ticarete girmek için doğru sinyaller sağlayan MT5 için en iyi gösterge! Herhangi bir finansal varlığa uygulanabilir: forex, kripto para birimleri, metaller, hisse senetleri, endeksler. MT5 versiyonu burada Oldukça doğru alım satım sinyalleri sağlayacak ve bir alım satımı açıp kapatmanın en iyi zamanını size söyleyecektir. Göstergeyi ödeyen yalnızca bir sinyali işleme örneğiyle videoyu (6:22) izleyin! Çoğu tüccar, Giriş Noktaları Pro göstergesinin yardımıyla ilk işl
Grafiğinizde otomatik olarak destek ve direnç seviyeleri PLUS itici mum boşlukları çizin, böylece fiyatın nereye gidebileceğini ve / veya potansiyel olarak tersine dönebileceğini görebilirsiniz. Bu gösterge, web sitemde (The Market Structure Trader) öğretilen pozisyon ticareti metodolojisinin bir parçası olarak kullanılmak üzere tasarlanmıştır ve hedefleme ve potansiyel girişler için temel bilgileri görüntüler. Göstergede 2 TEMEL özellik ve 4 ek özellik bulunmaktadır: TEMEL ÖZELLİK 1 - Günl
Yazarın diğer ürünleri
Candle Binary Scalper , forex ve ikili opsiyonlar için teknik analiz ürünüdür. Bir ticaret sisteminde birleştirilmiş birkaç teknik gösterge içerir. Ölçeklendirme ve ikili opsiyonlar için bir trend içinde manuel ticaret için uygundur. Tüm zaman dilimlerinde ve ticaret enstrümanlarında çalışır. Yüksek volatilite durumunda M15, M30, H1 ve H4, M5 ve M1 ticareti için Önerilen Zaman Çerçeveleri kullanılmalıdır. Birkaç uyarı türü vardır. ürün nasıl kullanılır Her Zaman Çerçevesi için en uygun ay
Scalping and Binary Signal Detector - Trend boyunca pozisyon açmak için yön sinyalleri veren Scalping göstergesi. Gösterge, Forex ve ikili opsiyonlar için kullanılabilecek eksiksiz bir ticaret sistemidir. Algoritma sistemi, birbirini takip eden birkaç çubuktaki yoğun fiyat hareketlerini tanımanıza olanak tanır. Gösterge, oklar için çeşitli uyarı türleri sağlar. Tüm alım satım enstrümanları ve zaman dilimleri üzerinde çalışır (M5 veya Üzeri önerilir). Ticaret için nasıl kullanılır Sarı b
Volatility Trend System , girişler için sinyaller sağlayan bir ticaret sistemidir. Volatilite sistemi, trend yönünde doğrusal ve nokta sinyallerinin yanı sıra, yeniden çizme veya gecikme olmadan trendden çıkış sinyallerini de verir. Trend göstergesi orta vadeli trendin yönünü izler, yönünü ve değişimini gösterir. Sinyal göstergesi oynaklıktaki değişikliklere dayanır ve piyasaya girişleri gösterir. Gösterge çeşitli uyarı türleri ile donatılmıştır. Çeşitli ticaret araçlarına ve zaman diliml
Volatility Trend System - girişler için sinyaller veren bir ticaret sistemi. Oynaklık sistemi, trend yönünde doğrusal ve noktasal sinyaller ve ayrıca yeniden çizme ve gecikme olmaksızın trendden çıkmak için sinyaller verir. Trend göstergesi, orta vadeli trendin yönünü izler, yönünü ve değişimini gösterir. Sinyal göstergesi volatilitedeki değişikliklere dayalıdır ve piyasa girişlerini gösterir. Gösterge, çeşitli uyarı türleri ile donatılmıştır. Çeşitli alım satım araçlarına ve zaman dilimler
Özellikle scalping için tasarlanmış, volatilite dürtülerini tanımlayabilen ve sürelerini gösterebilen teknik bir gösterge. Göstergenin işlevselliğini herhangi bir ticaret aracına uygulamanıza olanak tanıyan, manuel ayarlar için esnek parametrelere sahiptir. Kullanılması Önerilen Zaman Çerçeveleri M5, M15, M30, H1 ve H4'tür. Birkaç tür uyarı vardır. Mumun kapanışında tüm sinyaller asla değişmez veya yeniden renklenmez. Gösterge yukarıdan aşağıya parametrelerle yapılandırılır. Trend Lengt
" ZigZag on Trend " göstergesi, fiyat hareketinin yönünü belirlemenin yanı sıra bir çubuk ve pip hesaplayıcıdır. Zikzak şeklinde sunulan bir trend çizgisi ile fiyatın yönünü izleyen bir trend göstergesi ve trend yönünde geçen çubuk sayısını ve dikey ölçekteki nokta sayısını hesaplayan bir sayaçtan oluşur. (Hesaplamalar çubuğun açılmasıyla yapılır) Gösterge yeniden çizilmez. Kolaylık sağlamak için renkli çubuklar veya çizgiler şeklinde tasarlanmıştır. Tüm TF'lerde kullanılabilir, ancak en iyisi M
Dönüm noktalarını tanıyan bir dizi gösterge. İki MA'dan çıkarıldıktan sonra mum çubuğu kombinasyonlarının üst ve alt seviyelerini tespit eder. Erken girişlerin kullanıldığı ticaret sistemleri için geçerlidir. Ölçeklendirme ve gün içi ticaret için trend boyunca kullanılabilir ve erken aşamalarda trendin tersine döndüğünü tespit etmek için kullanılabilir. Olasılıklar Parametreler, herhangi bir zaman dilimi ve ticaret aracı için esnek ayarlar sağlar. Sinyaller için çeşitli uyarı türleri vard
Scalping Entry Points - fiyat hareketlerine uyum sağlayabilen ve yeniden çizmeden alım satımları açmak için sinyaller verebilen manuel bir alım satım sistemidir. Gösterge, merkezi destek ve direnç seviyesine göre trendin yönünü belirler. Nokta göstergesi, girişler ve çıkışlar için sinyaller sağlar. Manuel gün içi ticaret, ölçeklendirme ve ikili opsiyonlar için uygundur. Tüm zaman dilimlerinde ve ticaret enstrümanlarında çalışır. Gösterge birkaç türde uyarı verir. ürün nasıl kullanılır Mavi
Dönüm noktalarını tanıyan bir dizi gösterge. İki MA'dan çıkarıldıktan sonra mum çubuğu kombinasyonlarının üst ve alt seviyelerini tespit eder. Erken girişlerin kullanıldığı ticaret sistemleri için geçerlidir. Ölçeklendirme ve gün içi ticaret için trend boyunca kullanılabilir ve erken aşamalarda trendin tersine döndüğünü tespit etmek için kullanılabilir. Olasılıklar Parametreler, herhangi bir zaman dilimi ve ticaret aracı için esnek ayarlar sağlar. Sinyaller için çeşitli uyarı türleri vard
Forex için manuel ticaret ve teknik analiz göstergesi. İşlem gününün açılış seviyesini gösteren bir trend göstergesi ve giriş noktalarını belirlemek için bir ok göstergesinden oluşur. Gösterge yeniden renklenmez; mum kapandığında çalışır. Sinyal okları için çeşitli uyarı türleri içerir. Herhangi bir grafikte, alım satım aracında veya zaman diliminde çalışacak şekilde yapılandırılabilir. Çalışma stratejisi trend boyunca fiyat hareketlerini aramaya dayanmaktadır.  " Buy " işlemleri ya
Ticaret ve piyasa yönünü tahmin etmek için döngüsel gösterge. Fiyatın döngüsel davranışını osilatör biçiminde gösterir. Osilatörün üst ve alt sınırlarından bir geri dönüş olduğunda, işlem açılmasına yönelik sinyaller verir. Histogram biçiminde trendin yumuşatılmış gücünü gösterir.  Ölçeklendirmeden gün içi işlemlere kadar her türlü ticaret stratejisini tamamlayacak.  Gösterge yeniden çizilmez.  Tüm sembollerde/aletlerde kullanıma uygundur.  Kısa vadeli işlemler için uygun zaman dilimleri M5,
Wave Reversal Indicator - determines the direction of trend waves and price reversals. The indicator shows wave movements and trend directions. It gives recommendations where to follow the trader, helps to follow the trading strategy. It is an addition to an intraday or medium-term strategy. Almost all parameters are selected for each time frame and are changed automatically, the only parameter for manual adjustment is the wavelength. Works on various trading instruments and timeframes, rec
FREE
Zig-Zag indicator with additional signals for inputs. Visually easy to use: The red zig-zag line is an uptrend. The blue zig-zag line is a downward trend. Arrows in the form of additional signals. Works on any trading pairs. On any timeframe. Not redrawn. Input parameters Zig-Zag Period - Zig-zag period (from 5) Signal Period - period of signal arrows (from 3) Alerts for signals Play sound - Sound alert Display pop-up message - Notification by message on the screen Send push not
FREE
Candle Power Signals , ticaret kararları vermek için potansiyel değişken sinyalleri arama stratejisini kullanan bir trend göstergesidir. Gösterge, piyasayı analiz ederek, yönlü trend hareketi içinde artan ve azalan volatilite bölgelerini tanımlar. Ana sinyal oluşturma parametreleri halihazırda yapılandırılmıştır; geri kalan ayarlar ve periyotlar, manuel yapılandırma için 2 parametreye endekslenmiştir: 1. "Candle calculation method" - 2 sinyal oluşturma modu, zaman dilimlerinde normal olanın
Level Breakout Indicato r , üst ve alt sınırlardan çalışan, trendin yönünü belirleyebilen bir teknik analiz ürünüdür. Yeniden çizim veya gecikme olmadan mum 0 üzerinde çalışır. Çalışmasında, parametreleri önceden yapılandırılmış ve dönemlerin derecelendirmesini gerçekleştiren tek bir parametre olan " Scale " halinde birleştirilmiş farklı göstergelerden oluşan bir sistem kullanır. Göstergenin kullanımı kolaydır, herhangi bir hesaplama gerektirmez; tek bir parametre kullanarak, seçilen zaman dil
Max Min Reversal Arrows MT5 - an arrow reversal indicator for predicting price movement. The indicator is built on the support and resistance levels at the local lows and highs of the price. Product features Arrows appear on the current candle. The indicator does not redraw. Can be used on all time frames and trading instruments. Recommended timeframes to use M30, H1, H4. The dotted lines are the support and resistance levels within the signal. Price movement from these levels means a reve
BB Reversal Arrows Teknik Ticaret Sistemi, perakende kararları almak için ters noktaları tahmin etmek için geliştirilmiştir. Mevcut pazar durumu gösterge ile analiz edilir ve çeşitli kriterler için yapılandırılır: ters anlar beklentisi, potansiyel dönüm noktaları, satın alma ve satış sinyalleri. Gösterge fazla bilgi içermez, tüccarların makul kararlar vermesine izin veren görsel anlaşılabilir bir arayüze sahiptir. Tüm oklar mumu kapatıyor gibi görünüyor, yeniden çizim yapmadan, birkaç uyarı
Fiyat kanalının göstergesi ve içindeki kesme noktası oluşturucu. Kullanım süresine göre fiyatın konumu hakkında fikir verir. Giriş ve çıkış anlarını belirleyen kanal sınırları ve sıçrama noktaları boyunca oluşturulmuş düzleştirilmiş trend sıçrama çizgileri içerir. Çeşitli ticaret enstrümanları ve zaman dilimleri üzerinde çalışır. gösterge ile nasıl çalışılır Kanal kesme çizgisini takip edin, mavi çizgi yukarı girişler, pembe çizgi aşağı girişler. Giriş noktaları mevcut mum üzerinde oluşt
A trend indicator showing the strength of bulls and bears in a trading range. Consists of two lines: The green line is a balanced overbought/oversold condition. The red line is the direction of trading activity. Does not redraw calculations. Can be used on all Symbols/Instruments/Time Frames. Easy to use and set up. How to use the indicator and what it determines. The basic rule is to follow the direction of the red line: if it crosses the green line from the bottom up, the market i
FREE
Lines Channel Pro
Vitalyi Belyh
5 (1)
The "Lines Channel Pro" indicator determines price reversals from the High/Low channel. Contains a built-in trend finder, signal lines, entry and exit points. The recommended timeframe for M15 to work is D1. For each timeframe and trading instrument, depending on the volatility, it is necessary to select individual settings. Does not redraw calculations. Input parameters Use Channel trend filter - Turn on/off the trend filter Channel trend period - Trend filter period (from 8 and abov
Arrow indicator with trend filter. Generates trend input without delays or delays - on the emerging candle. Suitable for use on any trading tools and timeframes. Easy to use, contains the direction of the trend in the form of a histogram lines and signal generator. Input parameters Period Trend Line - Period of the Histogram Line Signal Generator Period - If the period is longer, then the arrows are less Play sound Display pop-up message Send push notification Send email Sound file signal -
An indicator that determines the point levels of price resistance. The arrows indicate price bounces in the indicated directions. Arrows are not redrawn formed on the current candle, shown on the previous candle for convenience.      It has one setting - the formation intensity: If the parameter is smaller, most of the signals are formed in a wide trend. If the parameter is larger, signals are formed in a narrower trend. Input parameters Formation Intensity - Arrow Formation Intensity Num
Channel Cluster
Vitalyi Belyh
5 (1)
Cluster indicator working in the price channel. For operation, the indicator builds a channel line - (dashed line). Inside the channel, cluster sections are determined that determine the direction of the price movement - (histograms in two directions), start with large arrows. Small arrows are plotted above / below each histogram - indicator increase volatility. The indicator does not redraw the values. Works on any tools and timeframes. Entrances are made when large arrows appear, inside s
A technical indicator that calculates its readings based on trading volumes. It has an oscillatory line that follows the change in volumes. Large arrows on the line indicate reversal values. A channel is built around the line with small arrows showing the strengthening of price movement in the direction of increasing volumes. The indicator does not redraw values. Works on any instrument and timeframe. It can complement any trading strategy by finding a trend or make entries in the direction of
Max Min Reversal Arrows - an arrow reversal indicator for predicting price movement. The indicator is built on the support and resistance levels at the local lows and highs of the price. Product features Arrows appear on the current candle. The indicator does not redraw. Can be used on all time frames and trading instruments. Recommended timeframes to use M30, H1, H4. The dotted lines are the support and resistance levels within the signal. Price movement from these levels means a reversal.
Scalping Entry Points - fiyat hareketlerine uyum sağlayabilen ve yeniden çizmeden alım satımları açmak için sinyaller verebilen manuel bir alım satım sistemidir. Gösterge, merkezi destek ve direnç seviyesine göre trendin yönünü belirler. Nokta göstergesi, girişler ve çıkışlar için sinyaller sağlar. Manuel gün içi ticaret, ölçeklendirme ve ikili opsiyonlar için uygundur. Tüm zaman dilimlerinde ve ticaret enstrümanlarında çalışır. Gösterge birkaç türde uyarı verir. ürün nasıl kullanılır Mavi
Alım satım yapmak, piyasa durumunu analiz etmek ve tahmin etmek için bir trend aracı. Gösterge, günlük veya haftalık trend dalgaları için kılavuz görevi gören bir kılavuz çizgi içerir. Ve işlem hacimlerini analiz eden özel bir osilatör. Aşırı alım ve satım piyasalarının dönemlerini gösterir ve olası bir fiyat hareketinin başlangıcında giriş noktalarını belirler. Gösterge yeniden çizilmez ve gecikmez. Herhangi bir enstrüman ve Zaman Çerçevesi üzerinde çalışır. Gösterge grafiği yüklemez, yaln
Binary Lines , para birimleri, emtialar, kripto para birimleri, hisse senetleri, endeksler ve herhangi bir finansal araç için teknik bir analiz göstergesidir. İkili opsiyonlar veya Forex ölçeklendirme için kullanılabilir. Giriş ve çıkış noktalarını sabit aralıklarla gösterir ve tüccarlar olası işlemlerin sonuçları hakkında gerekli bilgileri. Giriş noktaları, mumun en başında, MA çizgisi yönünde, süre boyunca oluşturulur. çubuklardaki işlemler manuel olarak ayarlanabilir ve herhangi bir finansal
İşlem hacimlerine ilişkin okumaları hesaplayan teknik bir gösterge. Histogram biçiminde, ticaret enstrümanının hareket gücünün birikimini gösterir. Yükseliş ve düşüş yönleri için bağımsız hesaplama sistemlerine sahiptir. Herhangi bir ticaret enstrümanı ve zaman dilimi üzerinde çalışır. Herhangi bir ticaret sistemini tamamlayabilir. Gösterge değerlerini yeniden çizmez, sinyaller mevcut mum üzerinde görünür. Kullanımı kolaydır ve grafiği yüklemez, ek parametre hesaplamaları gerektirmez. Değiştir
Line Breakouts - Trend ticareti için sistem. Dönem ve düzeltme işlevi kullanılarak herhangi bir grafiğe ve ticaret aracına uyarlanabilecek bir trend tanımlayıcı içerir. Ve destek ve direnç seviyelerinin belirleyicisi. Fiyat direnç çizgisinin altında olduğunda Satış işlemlerini açın ve fiyat destek çizgisinin üzerinde olduğunda Alım işlemlerini açın. Zararı durdur çizgilerden birkaç noktaya yerleştirilmelidir, Kâr Al zaman dilimine göre birkaç mumdan (3-10-15) sonra sabitlenmelidir. Gösterge y
Filtrele:
İnceleme yok
İncelemeye yanıt