• Genel bakış
  • İncelemeler
  • Yorumlar

Palantir

Palantir göstergesi, kullanıcının ayarlarda belirttiği puan sayısına göre fiyatın tersine döneceğini öngörür. İlgilendiğiniz trendin boyutunu seçersiniz ve gösterge, fiyatın en yakın uç noktadan belirtilen sayıda noktanın tersi yönde hangi olasılıkla hareket edeceğini tahmin eder.

Göstergenin işleyişi tarihsel eğilimlerin istatistiksel hesaplamasına dayanmaktadır. Palantir, ayarlarda belirtilen boyutla tarihteki trendleri analiz eder, istatistik toplar ve bunlara göre sonuçlar üretir. Örneğin trend boyutunu 500 pip olarak ayarladınız. Gösterge, düzeltmeleri 500 pips'i aşmayan trendleri analiz eder. Daha sonra son (güncel) trendi tarihsel trendlerle karşılaştırır ve mevcut trendin tarihteki yerini gösterir. %50'nin üzerindeki gösterge okumaları, mevcut eğilimin geçmiş eğilimlerin yarısından daha büyük olduğunu ve bunun tersini gösterir. Ek olarak %50 seviyesi, trendin tersine dönmesinin en sık meydana geldiği medyandır. %70/80/90 ve üzeri okumalar da yüksek trend gücünü gösterir. En son 300 tarihsel trend dikkate alınır. Tahmin edilen trendin boyutu yüklenen geçmişe bağlıdır. Çok büyük (binlerce nokta) bir trend için yeterli sayıda tarihsel alıntı olmayabilir. Bu nedenle göstergenin hesaplama için yeterli geçmişi yoksa günlükte bu konuda sizi bilgilendirecektir. Optimum trend büyüklüğü ortalama günlük fiyat oynaklığına eşittir. Örneğin EURUSD çifti için 120,0 puana kadar.

Dikkatlice!

Ortalamanın üzerindeki değerler de güçlü trendleri işaret edebilir; bu durumda gösterge okumaları yüksek olabilir ancak bu piyasanın gerçek resmini yansıtmayacaktır. Örneğin gösterge değerleri %95-99 ise bu, fiyatın hemen tersine döneceği anlamına gelmez. Bu, eğilimin nadir, çok güçlü ve dürtüsel olduğu anlamına gelir. Gösterge sadece tarihe dair gerçek istatistiklerden bahsediyor ancak piyasanın bu istatistiklere uyma zorunluluğu yok.

Ayrıca trend oluşturma kuralına da dikkat edin: Trend, belirttiğiniz nokta sayısı kadar ters yöne gidene kadar buna göre devam eder. Ve bu nedenle, geri dönüş yeni uç noktadan sayılır ve hedef de kayacaktır.

Panel

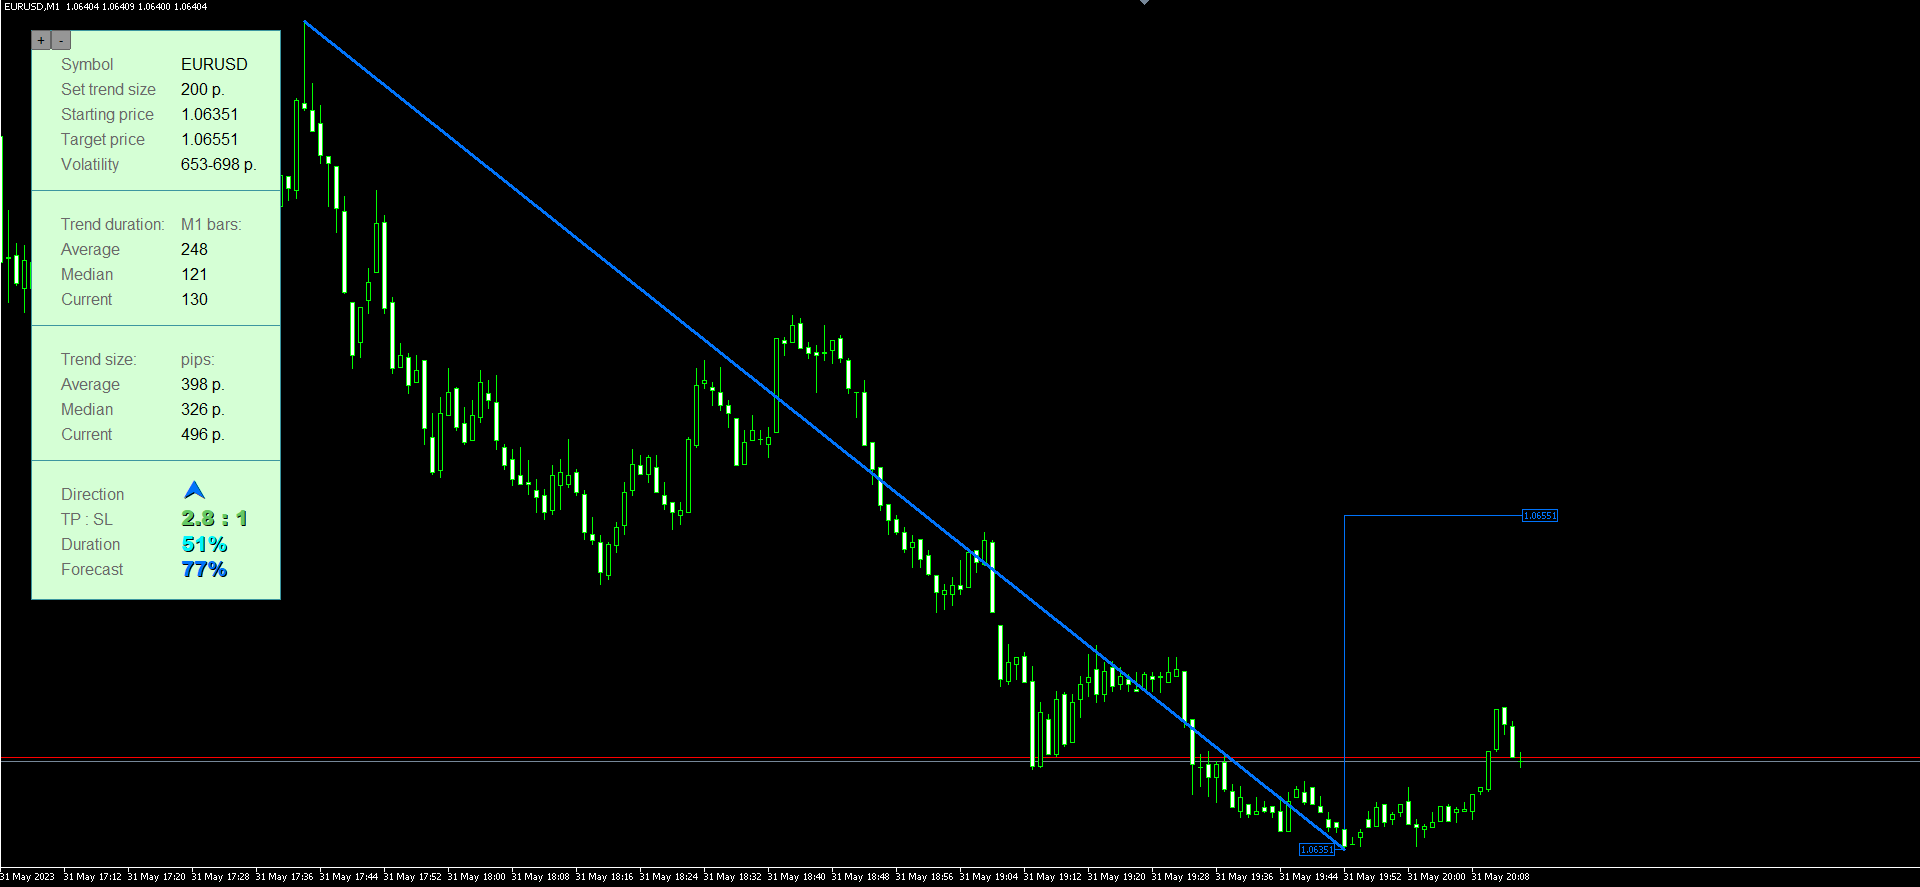
  • Symbol – mevcut finansal araç
  • Set trend size – ayarlarda ayarlanan trend boyutu
  • Starting price – Son hesaplanan (mevcut) trendin başlangıç ​​fiyatı
  • Target price – fiyatın hesaplanmış bir olasılıkla ulaşabileceği fiyat seviyesi
  • Volatility – Bu, bir finansal aracın ortalama günlük oynaklığıdır. İki sayıdan oluşur: 1 – medyan volatilite, 2 – ortalama volatilite
  • Average – bu, bir trendin ortalama süresinin aritmetik bir göstergesidir; bundan sonra ayarlarda belirtilen nokta sayısına göre bir tersine dönüş meydana gelir: geçmişte belirtilen tüm trendlerin süreleri hesaplanır ve sayılarına bölünür. Bilgileriniz için bilgi
  • Median – Bu, bir tersine dönüşün en sık meydana geldiği trendin süresidir. Örneğin 500 piplik bir trend belirlediniz. Gösterge 700 dakikalık ortalama değeri (M1 çubukları) hesaplar ve görüntüler. Bu, tarihteki 500 piplik belirli bir trend için çoğunlukla 700 dakika boyunca büyüdüğü ve sonrasında belirli bir 500 piplik tersine döndüğü anlamına gelir. Trendin tersine çevrilmesi için ek dahili sinyal
  • Current – Belirtilen trendin mevcut süresi. Trend, ayarlarda belirtilen nokta sayısı kadar ters yöne gidene kadar mevcut trend büyümeye devam edecektir.
  • Average – bu, bir trendin ortalama boyutunun aritmetik bir göstergesidir, ardından ayarlarda belirtilen nokta sayısına göre bir tersine dönüş meydana gelir: tarihte belirtilen tüm trendlerin boyutları hesaplanır ve sayılarına bölünür. Bilgileriniz için bilgi
  • Median – Bu, bir geri dönüşün meydana gelme ihtimalinin en yüksek olduğu trendin boyutudur. Örneğin 500 piplik bir trend belirlediniz. Gösterge 800 piplik ortalamayı hesaplar ve görüntüler. Bu, tarihteki 500 piplik belirli bir trend için çoğunlukla 800 pipse çıktığı ve ardından verilen 500 piplik geri dönüş olduğu anlamına gelir. Bu göstergenin ana sinyalidir. Ticaretin genel mantığı şuna dayanır: uygun bir fiyat bekleyin ve beklenen geri dönüş seviyesinde girin
  • Current – Belirtilen trendin mevcut boyutu. Trend, ayarlarda belirtilen nokta sayısı kadar ters yöne gidene kadar mevcut trend büyümeye devam edecektir.
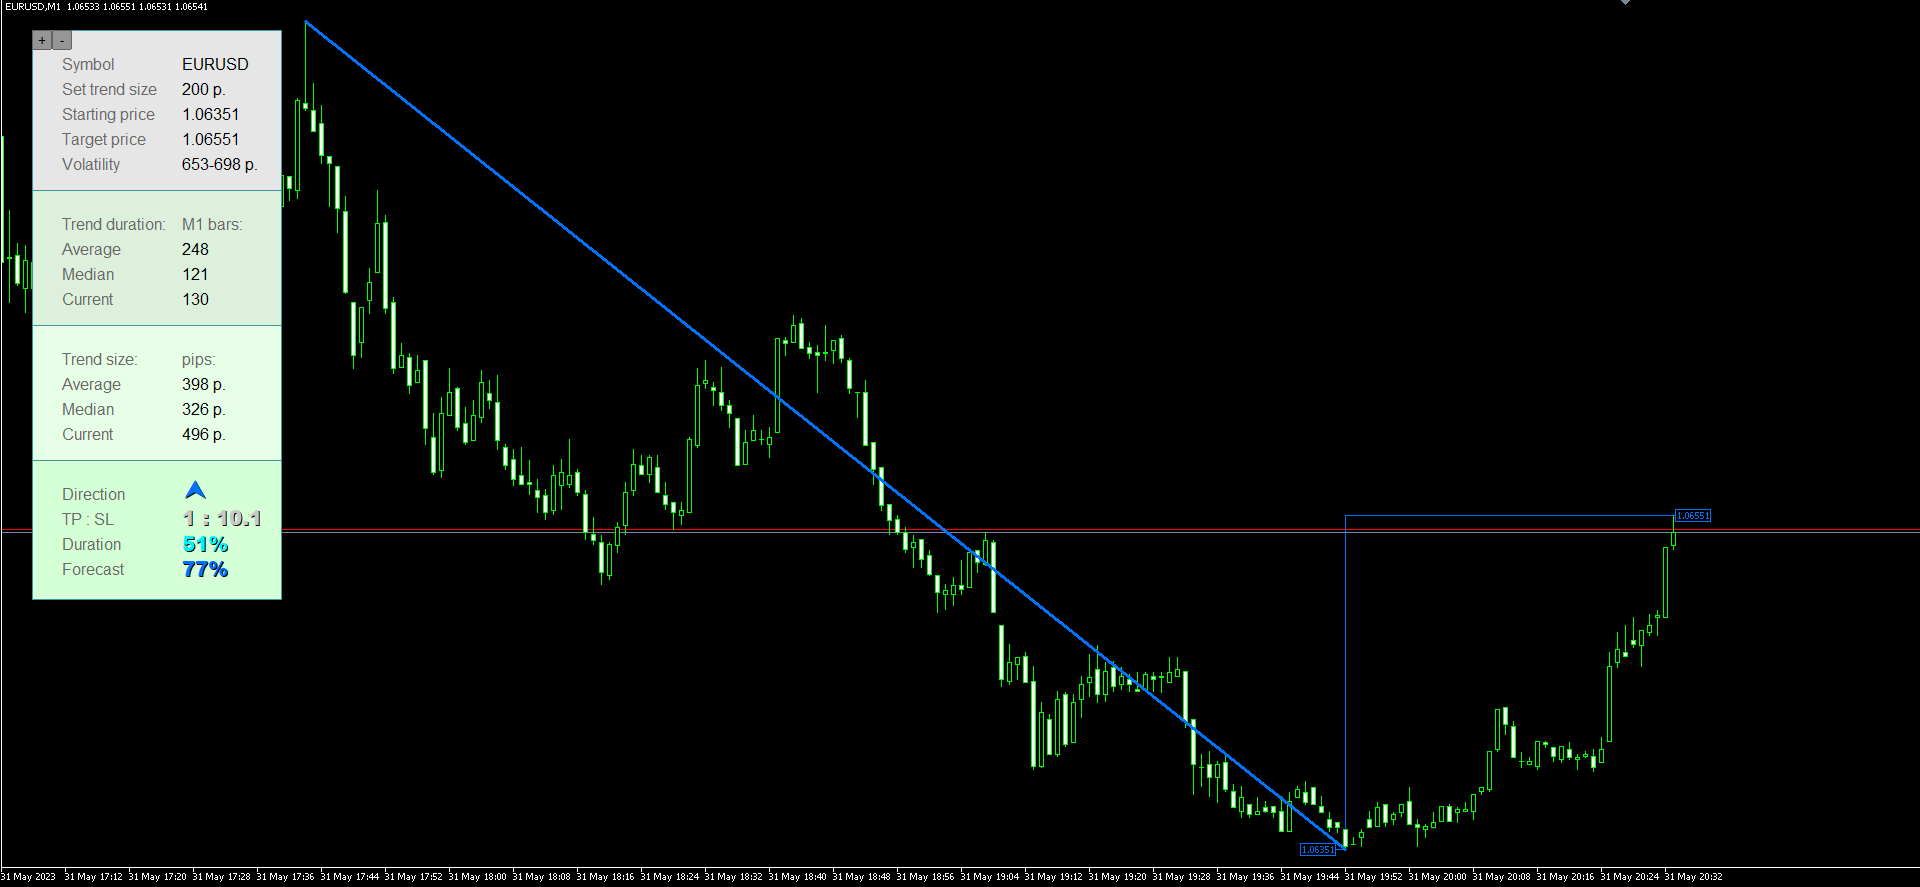
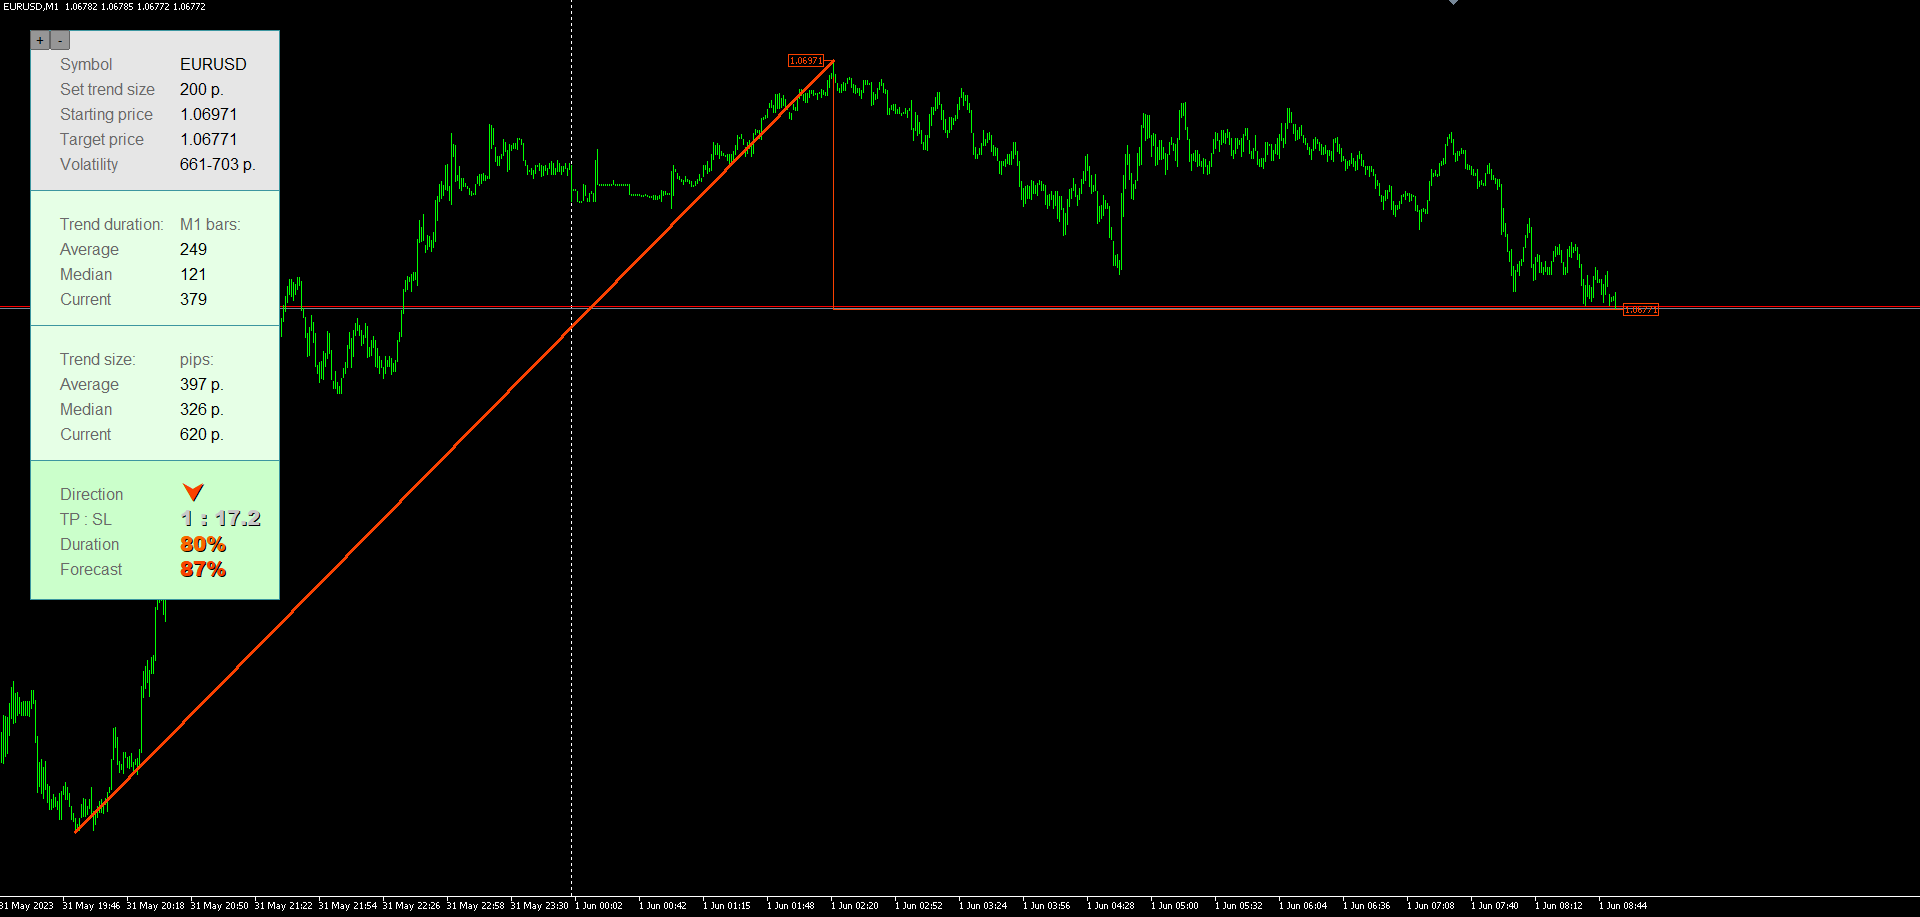
  • TP : SL – mevcut fiyatın mevcut trend doğrultusunda en yakın uç noktaya göre konumuna ve hesaplanan fiyata bağlı olarak potansiyel alım kârının potansiyel zarar durdurma oranına oranı. Fiyat uç noktaya ne kadar yakınsa, fiyat o kadar karlı olur ve bunun tersi de geçerlidir.
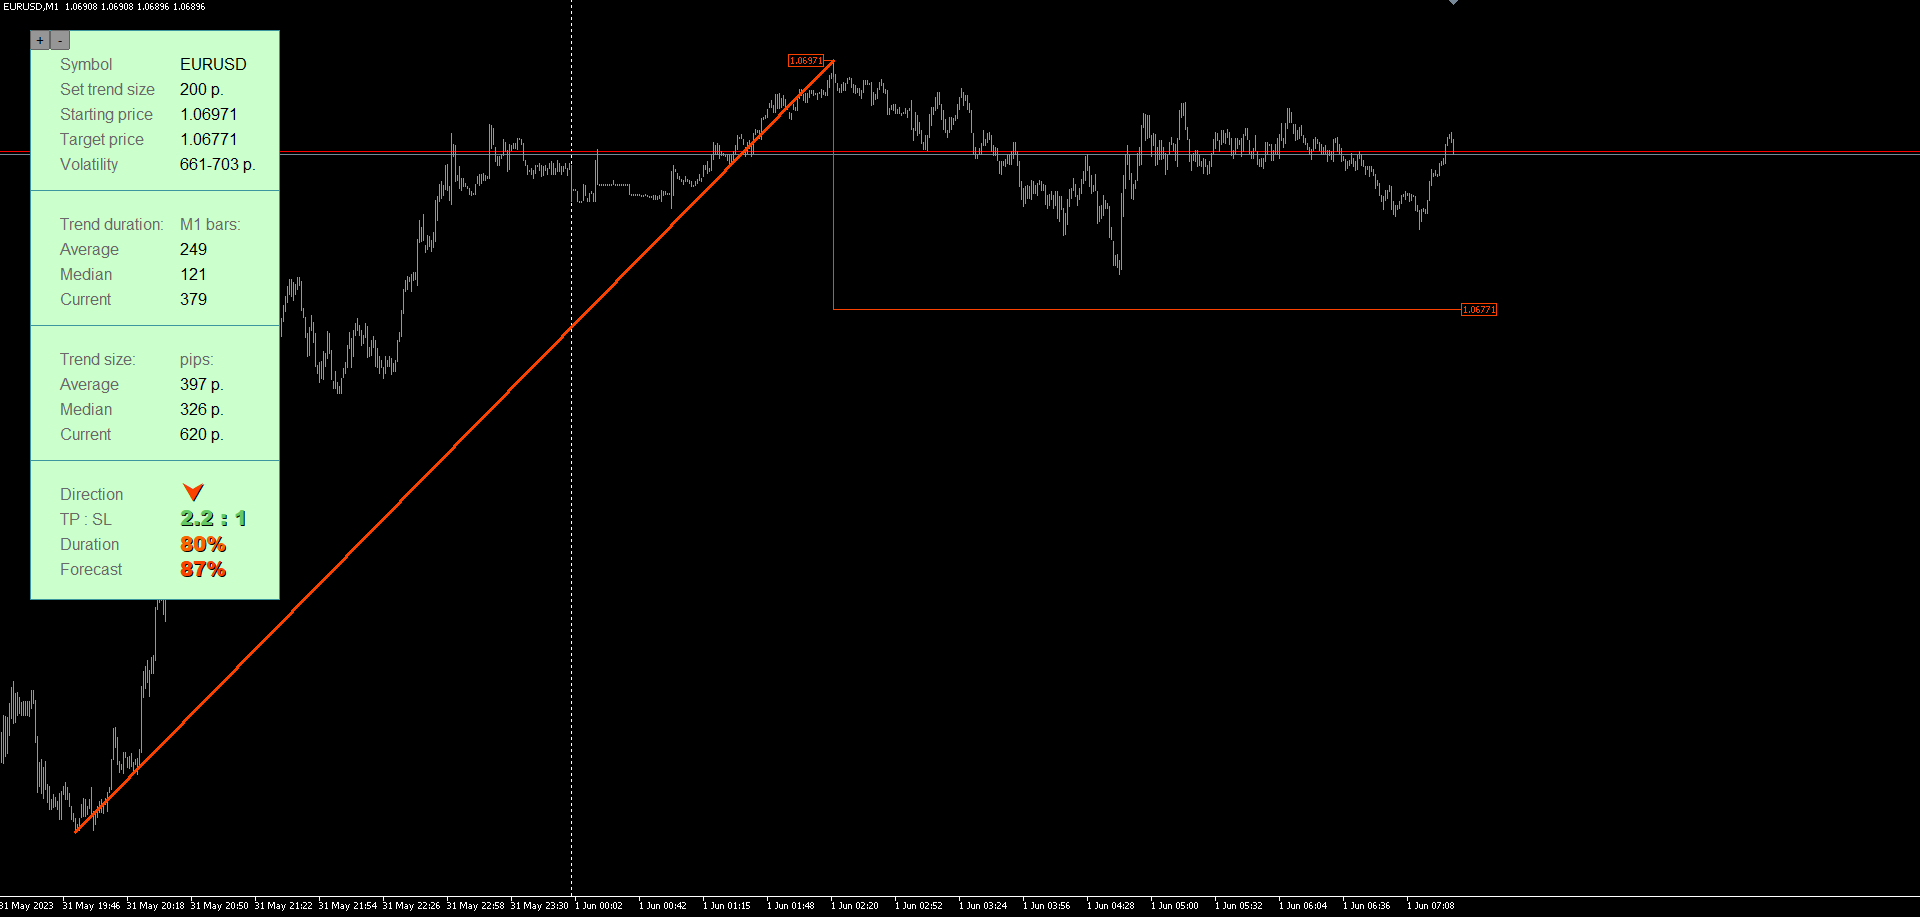
  • Direction – potansiyel bir işlemin yönü. Mevcut trend yukarı doğru büyüyorsa, o zaman işlemin yönü aşağı doğru olacaktır (belirttiğimiz noktalarda bir geri dönüş bekleyerek giriyoruz) ve bunun tersi de geçerlidir.
  • Duration – Dakika cinsinden trend süresine göre tersine dönüş tahmini. Ek yerel sinyal göstergesi
  • Forecast – puan cinsinden trend boyutuna göre geri dönüş tahmini. Ana gösterge sinyali

bunlara ek olarak

En iyi sinyaller, fiyatın çoğunlukla aralıklar içinde hareket ettiği yatay finansal araçlarda elde edilir. Palantir yardımcı bir göstergedir; yalnızca ticaret stratejinizde ek bir sinyal görevi görür. Yalnızca buna güvenmemelisiniz; onaylayıcı sinyaller kullanın. Izgara/ortalama/martingale ticareti yapanlar için Palantir, giriş için bir filtre görevi görebilir. Örneğin gösterge okuması %50'nin üzerinde olduğunda pozisyon açabilirsiniz. Ayrıca, eğer bir tersine dönüş meydana gelmezse ve önceki trend büyümeye devam ederse, o zaman ortalama daha yüksek okumalarla alınır. Sol üst köşedeki “+/-” işaretine tıklayarak pencereyi yakınlaştırabilir veya uzaklaştırabilirsiniz. Yüksek çözünürlükler için uygundur. Her blok, sinyal gücüne bağlı olarak renkli olarak vurgulanır.

Öneriler

  • Döviz çifti: herhangi biri, ancak daha az değişken olan daha iyidir.
  • Zaman dilimi: Grafiği görüntülemenin sizin için uygun olacağı herhangi bir zaman dilimi.
  • Strateji: Uygulamayı bulabileceğiniz herhangi bir yer. %50 veya daha yüksek değerlerde ortalama alabilir veya bunu ticaret sisteminize ek bir sinyal olarak kullanabilirsiniz.


Piyasadaki diğer ürünlerimi de deneyin https://www.mql5.com/ru/users/capitalplus/seller

Önerilen ürünler
Owl Smart Levels MT5
Sergey Ermolov
4.07 (28)
MT4 versiyonu  |  FAQ Owl Smart Levels Indicator , Bill Williams'ın gelişmiş fraktalları , piyasanın doğru dalga yapısını oluşturan Valable ZigZag ve kesin giriş seviyelerini gösteren Fibonacci seviyeleri gibi popüler piyasa analiz araçlarını içeren tek gösterge içinde eksiksiz bir ticaret sistemidir. pazara ve kar elde edilecek yerlere. Stratejinin ayrıntılı açıklaması Gösterge ile çalışma talimatı Baykuş Yardımcısı ticaretinde Danışman Yardımcısı Kullanıcıların özel sohbeti -> Satın aldıktan
The indicator detects and displays М. Gartley's Butterfly pattern. The pattern is plotted by the extreme values of the ZigZag indicator (included in the resources, no need to install). After detecting the pattern, the indicator notifies of that by the pop-up window, a mobile notification and an email. The pattern and wave parameters are displayed on the screenshots. The default parameters are used for demonstration purposes only in order to increase the amount of detected patterns. Parameters
Fit line supports to extrapolation next movement of market, support for buy/sell decision. Indicator using spline algorithm to extrapolation.  You can change number of spline with parameter "PointsNumber" and number of extrapolation point with "ExtrapolateBars". Eextrapolation points will be save into csv format, with prefix in parameter "PointsPrefix", and store in folder File of Data Folder.
The Penta-O is a 6-point retracement harmonacci pattern which usually precedes big market movements. Penta-O patterns can expand and repaint quite a bit. To make things easier this indicator implements a twist: it waits for a donchian breakout in the right direction before signaling the trade. The end result is an otherwise repainting indicator with a very reliable trading signal. The donchian breakout period is entered as an input. [ Installation Guide | Update Guide | Troubleshooting | FAQ | A
Noize Absorption Index - is the manual trading system that measures the difference of pressure between bears forces and bulls forces. Green line - is a noize free index that showing curent situation. Zero value of index shows totally choppy/flat market.Values above zero level shows how powerfull bullish wave is and values below zero measures bearish forces.Up arrow appears on bearish market when it's ready to reverse, dn arrow appears on weak bullish market, as a result of reverse expectation.
Swing Tracer
Ely Alsedy
5 (1)
it depends on ATR period to get swing points to help make better trading decisions  blue dot and red dot is the default color scheme of course you can change it later if you'd like  you can change the following : ATR PERIOD  sending notifications number of times to send notifications  sending notifications to your smart phone that's it very simple to use just drag and drop and follow the trend 
TrendDetect
Pavel Gotkevitch
The Trend Detect indicator combines the features of both trend indicators and oscillators. This indicator is a convenient tool for detecting short-term market cycles and identifying overbought and oversold levels. A long position can be opened when the indicator starts leaving the oversold area and breaks the zero level from below. A short position can be opened when the indicator starts leaving the overbought area and breaks the zero level from above. An opposite signal of the indicator can
Terra Infinity is a flat indicator. This improved version of the CalcFlat indicator has three additional lines that significantly increase its effectiveness. Unlike its predecessor with two static levels, Terra Infinity adds three dynamic lines above the main histogram, which are interpreted as follows: base signal line, minimum signal line, maximum signal line. These lines are formed using the additional parameter Avg, which is the average value of the histogram. Averaging produces a line
Double HMA MTF for MT5
Pavel Zamoshnikov
3.67 (3)
This is an advanced multi-timeframe version of the popular Hull Moving Average (HMA) Features Two lines of the Hull indicator of different timeframes on the same chart. The HMA line of the higher timeframe defines the trend, and the HMA line of the current timeframe defines the short-term price movements. A graphical panel with HMA indicator data from all timeframes at the same time . If the HMA switched its direction on any timeframe, the panel displays a question or exclamation mark with a tex
This indicator can be considered as a trading system. It offers a different view to see the currency pair: full timeless indicator, can be used for manual trading or for automatized trading with some expert advisor. When the price reaches a threshold a new block is created according to the set mode. The indicator beside the Renko bars, shows also 3 moving averages. Features renko mode median renko custom median renko 3 moving averages wicks datetime indicator for each block custom notificatio
Golden Spikes Detector
Batsirayi L Marango
2.67 (3)
Golden Spikes Detector This indicator is based on an advanced strategy primarily for trading spikes on Boom and Crash Indices. Complex algorithms were implemented to detect high probability entries only. It alerts on potential Buy and Sell entries. To trade spikes on the Deriv or Binary broker, only take Buy Boom and Sell Cash alerts. It was optimised to be loaded on 5-minute timeframe although multiple timeframe analysis is done in the background. Features ·             Desktop pop up and sound
Bu, fiyat etiketleriyle (devre dışı bırakılabilir)   Gelişmiş ZigZag Dinamik   ve/veya   Genişletilmiş Fraktallar   göstergesi ekstremumlarına dayalı destek ve direnç seviyelerinin bir MTF göstergesidir. MTF modu için daha yüksek TF'ler seçilebilir. Varsayılan olarak, seviyeler ZigZag gösterge noktalarına göre oluşturulur. Fraktal gösterge noktaları da ZigZag ile birlikte veya onun yerine kullanılabilir. Kullanımı basitleştirmek ve CPU zamanından tasarruf etmek için, açılışta her çubuk için bir
Ultimate Divergence Scanner (Multi Pair And Multi Time Frame) :   ---LIMITED TIME OFFER: NEXT 25 CLIENTS ONLY ---46% OFF REGULAR PRICE AND 2 FREE BONUSES ---SEE BELOW FOR FULL DETAILS It is a widely known market principle that momentum generally precedes price.  Making divergence patterns a clear indication that price and momentum are not in agreement.  Divergence patterns are widely used by institutional traders around the world. As they allow you to manage  your trades within strictly de
MACDivergence MTF MT5
Pavel Zamoshnikov
4 (5)
Advanced ideas of the popular MACD indicator: It detects and displays classic and reverse divergences (two methods of detecting divergences). It uses different color to highlight an uptrend and a downtrend. Two methods of determining a trend: а) MACD crosses the 0 level (classic signal); б) MACD crosses its own average (early signal). This is a multi-timeframe indicator: it can display MACD data from other timeframes. Two methods of drawing: classic histogram and line. It generates sound and vis
Renko Gold
Ignacio Agustin Mene Franco
Renko Gold! clearly indicates the floors and ceilings where it goes from 4 lines, the line below that marks the floor in green confirming with the thinnest line clarifies the purchase entry, the same is for sale, the top line marks the ceiling and the thinnest red line marks the sale, This indicator works for all temporalities! For Forex and Synthetic Indices markets! It also works for crypto markets! Good profit! World Investor.
Trend Monitor MT5
Pavel Zamoshnikov
4.5 (2)
The indicator generates early signals basing on ADX reading data combined with elements of price patterns. Works on all symbols and timeframes. The indicator does not redraw its signals. You see the same things on history and in real time. For better visual perception signals are displayed as arrows (in order not to overload the chart). Features The best results are obtained when the indicator works on two timeframes. For example: M30 – the indicator shows the main trend; M5 – the indicator ge
Premium seviye, %80'den fazla doğru tahmin doğruluğuna sahip benzersiz bir göstergedir! Bu gösterge en iyi Ticaret Uzmanları tarafından iki aydan uzun süredir test edilmiştir! Yazarın göstergesini başka hiçbir yerde bulamazsınız! Ekran görüntülerinden bu aracın doğruluğunu kendiniz görebilirsiniz! 1, sona erme süresi 1 mum olan ikili opsiyon ticareti için harikadır. 2 tüm döviz çiftleri, hisse senetleri, emtialar, kripto para birimleri üzerinde çalışır Talimatlar: Kırmızı ok görün
Gekko MACD Plus
Rodrigo Galeote
3 (3)
Type: Oscillator This is Gekko's Cutomized Moving Average Convergence/Divergence (MACD), a customized version of the famous MACD indicator. Use the regular MACD and take advantage of several entry signals calculations and different ways of being alerted whenever there is potential entry point. Inputs Fast MA Period: Period for the MACD's Fast Moving Average (default 12); Slow MA Period: Period for the MACD's Slow Moving Average (default 26); Signal Average Offset Period: Period for the Signal
Donchian Channel DC is the indicator of Donchian Channels, that plots maximum and minimum values of a specific period, besides mean value line. It´s possible to configure simple period for analysis and the indicator will plot all three values. You can trade with this indicator as trend or reversal, according to each strategy. Do not let to test others indicators as soon as others expert advisors.
This indicator obeys the popular maxim that: "THE TREND IS YOUR FRIEND" It paints a Blue line for BUY and also paints a RED line for SELL. (you can change the colors). It gives alarms and alerts of all kinds. IT DOES NOT REPAINT COLOR and can be used for all currency pairs and timeframes. Yes, as easy and simple as that. Even a newbie can use it to make great and reliable trades. https://www.mql5.com/en/market/product/115553
Atomic Analyst MT5
Issam Kassas
4.32 (19)
Öncelikle belirtmek gerekir ki bu Ticaret Göstergesi Yeniden Çizim Yapmaz, Gecikmez ve Gecikme Göstermez, bu da hem manuel hem de robot ticareti için ideal hale getirir. Kullanıcı kılavuzu: ayarlar, girişler ve strateji. Atom Analisti, Piyasada Daha İyi Bir Avantaj Bulmak İçin Fiyatın Gücünü ve Momentumunu Kullanan PA Fiyat Hareketi Göstergesidir. Gürültüleri ve Yanlış Sinyalleri Kaldırmaya ve Ticaret Potansiyelini Artırmaya Yardımcı Olan Gelişmiş Filtrelerle Donatılmıştır. Birden fazla katmanl
Indicator and Expert Adviser  EA Available in the comments section of this product. Download with Indicator must have indicator installed for EA to work. Mt5 indicator alerts for bollinger band and envelope extremes occurring at the same time. Buy signal alerts occur when A bullish candle has formed below both the lower bollinger band and the lower envelope  Bar must open and close below both these indicators. Sell signal occur when A bear bar is formed above the upper bollinger band and upp
Ichimoku Aiko MTF
Michael Jonah Randriamampionontsoa
Ichimoku Aiko MTF is a collection of technical indicators that show support and resistance levels, as well as momentum and trend direction. It is a multi-timeframe indicator so you don't need to change the chart timeframe when you want to see the ichimoku clouds on a higher timeframe.  eg. The chart timeframe is M15 and you want to see on the M15 timeframe chart the H1 ichimoku indicators (the ichimoku in Metatrader can't do that) that's why you need to use Ichimoku Aiko MTF.
The standard Bollinger Bands indicator has been improved by integrating additional indications from the Standard Deviation indicator (StdDev), which gives an additional filter for confirming trading signals. In addition, the color of the indicator's lines shows the beginning of a trend, its development and exhaustion. This indicator has a signal block that notifies the trader of the beginning of the trend on any time frame to which it is attached. Settings Type of messages - select the type of
JAC Trend Color Candle
Eduardo Da Costa Custodio Santos
The indicator "JAC Trend Color Candle" for Meta Trader 5, was created to visually facilitate the trend for the trader. It is based on three parameters, which identifies the uptrend, downtrend and non-trending market. The colors are trader-configurable, and the average trader-configurable as well. trend parameters cannot be configured as they are the indicator's differential.
KDJ Index 4   交易实用必备工具指标 波浪自动计算指标,通道趋势交易 完美的趋势-波浪自动计算通道计算 , MT4版本 完美的趋势-波浪自动计算通道计算 , MT5版本 本地跟单复制交易 Easy And Fast Copy , MT4版本 Easy And Fast Copy , MT5版本 本地跟单复制交易 模拟试用 Easy And Fast Copy , MT4 模拟账号运行 Easy And Fast Copy , MT5 模拟账号运行 "Cooperative QQ:556024  "  "Cooperation wechat:556024"  "Cooperative email:556024@qq.com" 强烈推荐趋势指标, 波浪的标准自动计算   和   波浪的标准自动计算MT5版本     KDJ指标又叫 随机指标 ,是一种相当新颖、实用的技术分析指标,它起先用于期货市场的分析,后被广泛用于股市的中短期趋势分析,是期货和股票市场上最常用的技术分析工具。 随机指标KDJ一般是用于股票分析的统计体系,根据统计学原理,通过一个特定的周期(常为9日、9周等
Time And Sales Delta
Evgeny Shevtsov
5 (2)
The indicator displays the delta and the cumulative delta based on the "Time & Sales" deals list data. In addition to the standard timeframes, the indicator displays data regarding the seconds timeframes (S5, S10, S15, S20, S30) to choose from. Using the rectangle, user can select an arbitrary area in the indicator subwindow to view the ratio of the volumes of deals of buyers and sellers within this area. Indicator features: The indicator works correctly only on those trading symbols for whi
The TrendChangeZone indicator displays global and local price highs and lows on the chart.   The indicator also shows the global trend on the chart and corrective waves.   This indicator is designed to determine the direction and change the trend.   Most importantly, the indicator shows trend continuation or reversal zones.   An indispensable assistant in trading.   The indicator does not redraw.   The indicator can work on all trading instruments. Important !!! Top trend if 2 (two) or more b
Macd Rsi
Ignacio Agustin Mene Franco
macd rsi It is a macd indicator added to the rsi to capture perfect entries in the average crossovers! As seen in the indicator, it has 2 lines, one of gold color and the other violet line, where the cross of the violet with the gold downwards is a sell signal when it crosses the violet up from the gold it is a buy signal! very good to make shorts works for forex markets and synthetic indices It is used in any temporality! Good profit! World Investor.
This indicator is based on the classical indicators: RSI (Relative Strangth Index) and CCI (Commodity Channel Index) and will be helpful for those who love and know how to use not a visual but digital representation of the indicators. The indicator shows values from each timeframe. You will be able to change the main input parameters for each RSI and CCI for every TF. Parameters OverboughtLevel_R = 70; OversoldLevel_R = 30; OverboughtLevel_C = 100; OversoldLevel_C = -100; Example for M1: sTF1 =
Bu ürünün alıcıları ayrıca şunları da satın alıyor
TPSpro RFI Levels MT5
Roman Podpora
4.75 (12)
TALİMATLAR         RUS   -        ENG       Bir gösterge ile kullanılması   önerilir       -       TPSpro   TREND PRO -   Sürüm MT4         Ticarette önemli bir unsur, bir ticaret aracını satın alma veya satma kararlarının alındığı bölgeler veya seviyelerdir. Büyük oyuncuların piyasadaki varlıklarını gizleme girişimlerine rağmen, kaçınılmaz olarak izler bırakırlar. Bizim görevimiz bu izleri nasıl tanımlayacağımızı ve doğru şekilde nasıl yorumlayacağımızı öğrenmekti. Ana işlevler:: Satıcılar ve
TPSproTREND PrO MT5
Roman Podpora
4.89 (9)
TPSpro TREND PRO  - is a trend indicator that automatically analyzes the market and provides information about the trend and each of its changes, as well as giving signals for entering trades without redrawing! The indicator uses each candle, analyzing them separately. referring to different impulses - up or down impulse. Exact entry points into transactions for currencies, crypto, metals, stocks, indices!  Version MT4               DETAILED DESCRIPTION               R ecommended to use with an
Öncelikle, bu Ticaret Sistemi'nin Non-Repainting, Non-Redrawing ve Non-Lagging Göstergesi olduğunu vurgulamak önemlidir, bu da hem manuel hem de robot ticareti için ideal hale getirir. Online kurs, kılavuz ve ön ayarları indir. "Smart Trend Trading System MT5", yeni ve deneyimli tüccarlar için özelleştirilmiş kapsamlı bir ticaret çözümüdür. 10'dan fazla premium göstergeyi birleştiriyor ve 7'den fazla sağlam ticaret stratejisi sunuyor, bu da çeşitli piyasa koşulları için esnek bir seçim yapar. Tr
Bu gösterge paneli, seçilen semboller için mevcut en son   harmonik kalıpları   gösterir, böylece zamandan tasarruf edersiniz ve daha verimli olursunuz /   MT4 sürümü . Ücretsiz Gösterge:   Basic Harmonic Pattern Gösterge sütunları Symbol :   seçilen semboller görünecektir Trend:   yükseliş veya düşüş Pattern :   desen türü (gartley, kelebek, yarasa, yengeç, köpekbalığı, cypher veya ABCD) Entry :   giriş fiyatı SL:   zararı durdur fiyatı TP1:   1. kar alma fiyatı TP2:   2. kar alma fiyatı
FX Power MT5 NG
Daniel Stein
5 (6)
Sabah Brifingimiz burada mql5 ve on Telegram! FX Power MT5 NG , uzun zamandır çok popüler olan döviz gücü ölçerimiz FX Power'ın yeni neslidir. Peki bu yeni nesil güç ölçer ne sunuyor? Orijinal FX Power hakkında sevdiğiniz her şey PLUS GOLD/XAU güç analizi Daha da hassas hesaplama sonuçları Ayrı ayrı yapılandırılabilir analiz dönemleri Daha da iyi performans için özelleştirilebilir hesaplama limiti Özel çokluDaha fazlasını görmek isteyenler için örnek ayarlar Her grafikte en sevdiğiniz renkler i
Top indicator for MT5   providing accurate signals to enter a trade without repainting! It can be applied to any financial assets:   forex, cryptocurrencies, metals, stocks, indices .  Watch  the video  (6:22) with an example of processing only one signal that paid off the indicator! MT4 version is here It will provide pretty accurate trading signals and tell you when it's best to open a trade and close it. Most traders improve their trading results during the first trading week with the help of
FX Volume MT5
Daniel Stein
4.93 (14)
Sabah Brifingimiz aracılığıyla ayrıntılar ve ekran görüntüleri ile günlük piyasa güncellemenizi alın burada mql5 ve on Telegram ! FX Volume, bir brokerin bakış açısından piyasa duyarlılığı hakkında GERÇEK bir fikir veren İLK ve TEK hacim göstergesidir. COT raporlarından çok daha hızlı bir şekilde, brokerlar gibi kurumsal piyasa katılımcılarının Forex piyasasında nasıl konumlandıklarına dair harika bilgiler sağlar. Bu bilgileri doğrudan grafiğinizde görmek, ticaretiniz için gerçek oyun değiştir
TPA True Price Action indicator reveals the true price action of the market makers through 100% non-repainting signals strictly at the close of a candle! TPA shows entries and re-entries, every time the bulls are definitely stronger than the bears and vice versa. Not to confuse with red/green candles. The shift of power gets confirmed at the earliest stage and is ONE exit strategy of several. There are available now two free parts of the TPA User Guide for our customers. The first "The Basics"
Gann Kare Göstergesi, W.D. Gann tarafından yazılan "Piyasa Tahminleri için Matematiksel Formül" makalesine dayalı güçlü bir piyasa analizi aracıdır. Bu araç, piyasa analizi için matematiksel ve Gann teorilerini kullanarak hassas analizler gerçekleştirir. 144, 90, 52 karelerini ve ayrıca 9 karesini kullanır. Ayrıca, ın 9 karesi ve bu kareyle ilişkili kanallar ve yıldız modelleri için yöntemini içerir. Kullanıcı Kılavuzu ve Uygulama: Bu göstergeleri kullanmadan önce, kullanıcı kılavuzunu okumanız
Gartley Hunter Multi
Siarhei Vashchylka
5 (8)
Gartley Hunter Multi - An indicator for searching for harmonic patterns simultaneously on dozens of trading instruments and on all possible timeframes. Manual (Be sure to read before purchasing) | Version for MT4 Advantages 1. Patterns: Gartley, Butterfly, Shark, Crab. Bat, Alternate Bat, Deep Crab, Cypher 2. Simultaneous search for patterns on dozens of trading instruments and on all possible timeframes 3. Search for patterns of all possible sizes. From the smallest to the largest 4. A
Blahtech Supply Demand MT5
Blahtech Limited
4.54 (13)
Was: $299  Now: $99   Supply Demand uses previous price action to identify potential imbalances between buyers and sellers. The key is to identify the better odds zones, not just the untouched ones. Blahtech Supply Demand indicator delivers functionality previously unavailable on any trading platform. This 4-in-1 indicator not only highlights the higher probability zones using a multi-criteria strength engine, but also combines it with multi-timeframe trend analysis, previously confirmed swings
Tanıtım       Quantum Breakout PRO   , Breakout Bölgeleri ile ticaret yapma şeklinizi değiştiren çığır açan MQL5 Göstergesi! 13 yılı aşkın ticaret tecrübesine sahip deneyimli tüccarlardan oluşan bir ekip tarafından geliştirilmiştir.       Kuantum Breakout PRO       yenilikçi ve dinamik koparma bölgesi stratejisiyle ticaret yolculuğunuzu yeni zirvelere taşımak için tasarlanmıştır. Kuantum Breakout Göstergesi, size 5 kar hedefi bölgesi ile kırılma bölgelerinde sinyal okları ve kırılma kutusuna
Quantum Trend Sniper
Bogdan Ion Puscasu
4.8 (49)
Tanıtım       Kuantum Trend Keskin Nişancı Göstergesi   , trend tersine dönmeleri belirleme ve ticaret yapma şeklinizi değiştiren çığır açan MQL5 Göstergesi! 13 yılı aşkın ticaret tecrübesine sahip deneyimli tüccarlardan oluşan bir ekip tarafından geliştirilmiştir.       Kuantum Trend Keskin Nişancı Göstergesi       trend dönüşlerini son derece yüksek doğrulukla belirlemenin yenilikçi yolu ile ticaret yolculuğunuzu yeni zirvelere taşımak için tasarlanmıştır. ***Kuantum Trend Keskin Nişancı Gö
Şimdi 147 $ (birkaç güncellemeden sonra 499 $ 'a yükseliyor) - Sınırsız Hesaplar (PC'ler veya Mac'ler) RelicusRoad Kullanım Kılavuzu + Eğitim Videoları + Özel Discord Grubuna Erişim + VIP Durumu PİYASAYA BAKMAK İÇİN YENİ BİR YOL RelicusRoad, forex, vadeli işlemler, kripto para birimleri, hisse senetleri ve endeksler için dünyanın en güçlü ticaret göstergesidir ve yatırımcılara kârlı kalmaları için ihtiyaç duydukları tüm bilgileri ve araçları sağlar. Başlangıç ​​seviyesinden ileri seviyey
Precision Divergence Finder, Precision Trading Systems tarafından piyasa diplerini kesinlikle ve sıkça bulmak amacıyla tasarlandı. Teknik analizde, dipleri seçme sanatı genellikle zirveleri seçmekten çok daha kolaydır ve bu ürün tam olarak bu görev için tasarlandı. Boğa ayrıştırması tanımlandıktan sonra alım yapmadan önce trendin yukarı dönmesini beklemek mantıklıdır. Bir giriş yapmak için 10 veya 20 çubuk yüksekliği kullanabilir veya trend değişikliğini belirlemek için yükselen bir 15-30 har
GannRS Trend Scalper   GannRS is an advanced trading tool based on Gann Law and Supports and Resistances. designed to have an   active trading at any time not lagging Indications are given at the beginning of a new candle Please watch the full tutorial video. How to use GannRS Very easy to set up... Put it on your chart Adjust inputs Inputs Show Resistance and support : [bool]  true = Shows R/S on chart false = does not show Show Levels :[bool]  true = Shows levels on the chart false = doe
Advanced Supply Demand MT5
Bernhard Schweigert
4.5 (14)
Herhangi bir Acemi veya Uzman Tüccar için En İyi Çözüm! Bu gösterge benzersiz, yüksek kaliteli ve uygun fiyatlı bir ticaret aracıdır çünkü bir dizi tescilli özelliği ve yeni bir formülü bir araya getirdik. Bu güncelleme ile çift zaman dilimi dilimlerini gösterebileceksiniz. Yalnızca daha yüksek bir TF gösteremeyeceksiniz, aynı zamanda TF grafiğini ve ARTIK daha yüksek TF'yi de gösterebileceksiniz: YUVARLAK BÖLGELERİ GÖSTERMEK. Tüm Arz Talebi tüccarları buna bayılacak. :) Önemli Bilgiler Açıkland
FxaccurateLS
Shiv Raj Kumawat
WHY IS OUR FXACCCURATE LS MT5 THE PROFITABLE ? PROTECT YOUR CAPITAL WITH RISK MANAGEMENT Gives entry, stop and target levels from time to time. It finds Trading opportunities by analyzing what the price is doing during established trends. POWERFUL INDICATOR FOR A RELIABLE STRATEGIES We have made these indicators with a lot of years of hard work. It is made at a very advanced level. Established trends provide dozens of trading opportunities, but most trend indicators completely ignore them!
Matrix Arrow Indicator MT5
Juvenille Emperor Limited
5 (12)
Matrix Arrow Indicator MT5 ,   forex ,   emtialar ,   kripto   para birimleri ,   endeksler ,   hisse senetleri   gibi tüm sembollerde/araçlarda kullanılabilen   %100 yeniden boyamayan   çoklu zaman çerçevesi göstergesini izleyen benzersiz bir 10'u 1 arada trenddir.  Matrix Arrow Indicator MT5 , mevcut eğilimi erken aşamalarında belirleyecek ve aşağıdakiler gibi 10'a kadar standart göstergeden bilgi ve veri toplayacaktır: Ortalama Yönlü Hareket Endeksi (ADX) Emtia Kanal Endeksi (CCI) Klasik Hei
Kârlı ticaret fırsatlarını kolaylıkla belirlemenize yardımcı olabilecek güçlü bir forex ticaret göstergesi mi arıyorsunuz? Beast Super Signal'den başka bir yere bakmayın. Bu kullanımı kolay trend tabanlı gösterge, sürekli olarak piyasa koşullarını izleyerek yeni gelişen trendleri araştırır veya mevcut trendlere atlar. Canavar Süper Sinyali, tüm dahili stratejiler birbiriyle uyumlu ve %100 örtüştüğünde bir al ya da sat sinyali vererek ek onay ihtiyacını ortadan kaldırır. Sinyal oku uyarısını aldı
Was: $249  Now: $99   Market Profile defines a number of day types that can help the trader to determine market behaviour. A key feature is the Value Area, representing the range of price action where 70% of trading took place. Understanding the Value Area can give traders valuable insight into market direction and establish the higher odds trade. It is an excellent addition to any system you may be using. Inspired by Jim Dalton’s book “Mind Over Markets”, this indicator is designed to suit the
[ MT4 Version ] Only the next 10 units at current price! Final price: $299 Are you tired of spending months on demo or live accounts to test your trading strategies? The Backtesting Simulator is the ultimate tool designed to elevate your backtesting experience to new heights. Utilizing Metatrader historical symbol information, it offers an unparalleled simulation of real market conditions. Take control of your testing speed, test ideas quickly or at a slower pace, and witness remarkable improve
Introducing Quantum TrendPulse , the ultimate trading tool that combines the power of SuperTrend , RSI , and Stochastic into one comprehensive indicator to maximize your trading potential. Designed for traders who seek precision and efficiency, this indicator helps you identify market trends, momentum shifts, and optimal entry and exit points with confidence. Key Features: SuperTrend Integration: Easily follow the prevailing market trend and ride the wave of profitability. RSI Precision: Detect
IX Power MT5
Daniel Stein
4.17 (6)
IX Power   nihayet FX Power'ın rakipsiz hassasiyetini Forex dışı sembollere getiriyor. En sevdiğiniz endeksler, hisse senetleri, emtialar, ETF'ler ve hatta kripto para birimlerindeki kısa, orta ve uzun vadeli eğilimlerin yoğunluğunu doğru bir şekilde belirler. Terminalinizin sunduğu   her şeyi analiz   edebilirsiniz. Deneyin ve işlem yaparken   zamanlamanızın   nasıl   önemli ölçüde iyileştiğini   deneyimleyin. IX Power Temel Özellikler 100 hassas, yeniden boyanmayan hesaplama sonuçları -
Contact me for instruction, any questions! Related Product:  Gold Trade Expert MT5 Introduction The breakout and retest strategy is traded support and resistance levels. it involves price breaking through a previous level.  The break and retest strategy is designed to help traders do two main things, the first is to avoid false breakouts. Many false breakouts start with a candlestick that breaks out of a level but ends with an immediate candlestick that brings the price back into the level. T
Protect against whipsaws: revolutionize your swing trading approach Special Offer: Purchase now to receive free bonuses worth $135! (Read more for details) Swing Trading is the first indicator designed to detect swings in the direction of the trend and possible reversal swings. It uses the baseline swing trading approach, widely described in trading literature. The indicator studies several price and time vectors to track the aggregate trend direction and detects situations in which the market i
Trend Hunter MT5
Andrey Tatarinov
5 (2)
Trend Hunter , Forex, kripto para birimi ve CFD piyasalarında çalışmaya yönelik bir trend göstergesidir. Göstergenin özel bir özelliği, fiyat trend çizgisini hafifçe deldiğinde sinyali değiştirmeden trendi güvenle takip etmesidir. Gösterge yeniden çizilmez; çubuk kapandıktan sonra pazara giriş sinyali görünür. Bir trend boyunca hareket ederken gösterge, trend yönünde ek giriş noktalarını gösterir. Bu sinyallere dayanarak küçük bir Zararı Durdur ile işlem yapabilirsiniz. Trend Hunter dürüst
AT Forex Indicator MT5
Marzena Maria Szmit
5 (4)
The AT Forex Indicator MT5 is a sophisticated trading tool designed to provide traders with a comprehensive analysis of multiple currency pairs. This powerful indicator simplifies the complex nature of the forex market, making it accessible for both novice and experienced traders. AT Forex Indicator uses advanced algorithms to detect trends, patterns and is an essential tool for traders aiming to enhance their forex trading performance. With its robust features, ease of use, and reliable signal
TrendMaestro5
Stefano Frisetti
note: this indicator is for METATRADER4, if you want the version for METATRADER5 this is the link:  https://www.mql5.com/it/market/product/108106 TRENDMAESTRO ver 2.4 TRENDMAESTRO recognizes a new TREND in the bud, he never makes mistakes. The certainty of identifying a new TREND is priceless. DESCRIPTION TRENDMAESTRO identifies a new TREND in the bud, this indicator examines the volatility, volumes and momentum to identify the moment in which there is an explosion of one or more of these data a
WAPV Full MT5
Eduardo Da Costa Custodio Santos
5 (1)
## WAPV Full kullanarak profesyonelce çalışın ve takip edin büyük oyuncuların parası nerede Elinizde okumayı tek başına yapan bir araç olduğunu hayal edin. en iyi ticaret bölgelerini gösteren başlıca Piyasa Oyuncuları Fiyat ve Hacim analizine dayalı. WAPV Full, eksiksiz bir araçtır ve %100 R. Wyckoff'un operasyonel özelliklerine odaklanmıştır. Ticaret dalgalarındaki piyasa hareketlerini haritalamaya ek olarak, aynı zamanda Fiyat ve Hacmi okuyarak Pazar. Profesyonel Pazar, R. Wyckoff'un 3 yasası
Yazarın diğer ürünleri
Fractals Dynamic Fractals Dynamic  –  sol ve sağdaki çubukların sayısını manuel olarak ayarlayabileceğiniz ve böylece grafikte benzersiz desenler oluşturabileceğiniz, Bill Williams tarafından değiştirilmiş bir serbest fraktal göstergedir.  Artık Fraktallar Dinamik göstergesine dayanan veya temelinde bulunan tüm ticaret stratejilerinin ek bir sinyali olacaktır. Ek olarak, fraktallar destek ve direnç seviyeleri olarak hareket edebilir. Ve bazı ticaret stratejilerinde likidite seviyelerini göste
FREE
Fractals Dynamic Fractals Dynamic  –  sol ve sağdaki çubukların sayısını manuel olarak ayarlayabileceğiniz ve böylece grafikte benzersiz desenler oluşturabileceğiniz, Bill Williams tarafından değiştirilmiş bir serbest fraktal göstergedir.  Artık Fraktallar Dinamik göstergesine dayanan veya temelinde bulunan tüm ticaret stratejilerinin ek bir sinyali olacaktır. Ek olarak, fraktallar destek ve direnç seviyeleri olarak hareket edebilir. Ve bazı ticaret stratejilerinde likidite seviyelerini göster
FREE
Market Noise Piyasa Gürültüsü, fiyat grafiğindeki piyasa aşamalarını belirleyen ve aynı zamanda bir birikim veya dağıtım aşaması meydana geldiğinde net, yumuşak trend hareketlerini gürültülü düz hareketlerden ayıran bir göstergedir. Her aşama kendi ticaret türü için iyidir: trendi takip eden sistemler için trend, agresif sistemler için ise yatay. Piyasa gürültüsü başladığında işlemlerden çıkmaya karar verebilirsiniz. Aynı şekilde ve tam tersi, gürültü biter bitmez agresif ticaret sistemlerini
TimeBar TimeBar, çubuğun kapanmasına kalan süreyi, çubuğun açılmasından bu yana geçen süreyi ve geçerli saati gösteren basit bir bilgi göstergesidir. Algılamayı kolaylaştırmak için iki tür görüntüleme modu eklenmiştir: grafiğin sol üst köşesinde yorum şeklinde veya grafik nesnesi şeklinde. Avantajları Yazı tipi seçimi Yazı Boyutu. Herhangi birini ayarlayabilirsiniz. Yorum yaparken çok küçük Nesneleri taşıyabilirsiniz. Fareye çift tıklayarak herhangi bir zaman seçilebilir ve grafik üzerinde he
FREE
MinMax Levels MinMax Levels  –  önemli işlem dönemleri (gün, hafta ve ay) için maksimum, minimum ve açılış fiyat seviyelerinin göstergesidir. Her Forex piyasası katılımcısı kendi ticaret sistemindeki seviyeleri kullanır. İşlem yapmak için ana sinyal veya analitik bir araç görevi gören ek bir sinyal olabilirler.  Bu göstergede günler, haftalar ve aylar büyük piyasa katılımcılarının kilit işlem dönemleri olduğundan önemli dönemler olarak seçilmiştir. Bildiğiniz gibi fiyatlar seviyeden seviyeye
MultiFractal , zaman dilimini değiştirmeye benzer şekilde, aralarındaki fark dört boyutta olan daha yüksek dereceli fraktallarla desteklenen, değiştirilmiş bir Bill Williams fraktal göstergesidir. Orijinal terminal göstergesine göre avantajları: Kolaylık Görünürlük Bilgi içeriği Gösterge kullanışlıdır çünkü çalışırken farklı zaman dilimlerine geçmenize gerek yoktur. Görünürlük - tek bir grafikte grafiğin yapısını küçükten orta ve büyük piyasa hareketlerine kadar görebilirsiniz. Bilgi içeriği - g
Market Noise Piyasa Gürültüsü, fiyat grafiğindeki piyasa aşamalarını belirleyen ve aynı zamanda bir birikim veya dağıtım aşaması meydana geldiğinde net, yumuşak trend hareketlerini gürültülü düz hareketlerden ayıran bir göstergedir. Her aşama kendi ticaret türü için iyidir: trendi takip eden sistemler için trend, agresif sistemler için ise yatay. Piyasa gürültüsü başladığında işlemlerden çıkmaya karar verebilirsiniz. Aynı şekilde ve tam tersi, gürültü biter bitmez agresif ticaret sistemlerini
Currency Strength Dynamic Döviz Gücü Dinamik, para birimi gücünün bir göstergesidir. Döviz gücü, bir para biriminin parçası olduğu döviz çiftlerinin çoğunun veya tamamının trend yönünü ifade eder. Gösterge, MACD göstergesine benzer şekilde, en popüler 28 döviz çifti (majör ve minör) üzerindeki hareketli ortalamalar arasındaki farkın okunmasına dayanmaktadır. Avantajları Benzersiz salınımlı hesaplama yöntemi Belirli para birimlerinin satırlarını devre dışı bırakmak veya etkinleştirmek için d
MultiFractal Levels MultiFractal Levels – bu, seviyelerin eklenmesiyle değiştirilmiş bir Bill Williams fraktal göstergesidir. Fraktallar, ayarlarda izin verilen tüm TF'lerden oluşturulmuştur. Seviyeler yalnızca henüz fiyata göre test edilmemiş en son fraktallara dayanarak oluşturulmuştur. Orijinal terminal göstergesine göre avantajları: Kolaylık Görünürlük bilgilendiricilik En son seviyeler Özelleştirilebilir fraktal Özelleştirilebilir seviyeler Gösterge kullanışlıdır çünkü çalışırken farklı z
MinMax Levels MinMax Levels  –  önemli işlem dönemleri (gün, hafta ve ay) için maksimum, minimum ve açılış fiyat seviyelerinin göstergesidir. Her Forex piyasası katılımcısı kendi ticaret sistemindeki seviyeleri kullanır. İşlem yapmak için ana sinyal veya analitik bir araç görevi gören ek bir sinyal olabilirler.  Bu göstergede günler, haftalar ve aylar büyük piyasa katılımcılarının kilit işlem dönemleri olduğundan önemli dönemler olarak seçilmiştir. Bildiğiniz gibi fiyatlar seviyeden seviyeye
Filtrele:
İnceleme yok
İncelemeye yanıt