Top Bottom Indicator
- Göstergeler
- Zhi Xian Hou
- Sürüm: 1.0
- Etkinleştirmeler: 10
Gösterge Giriş
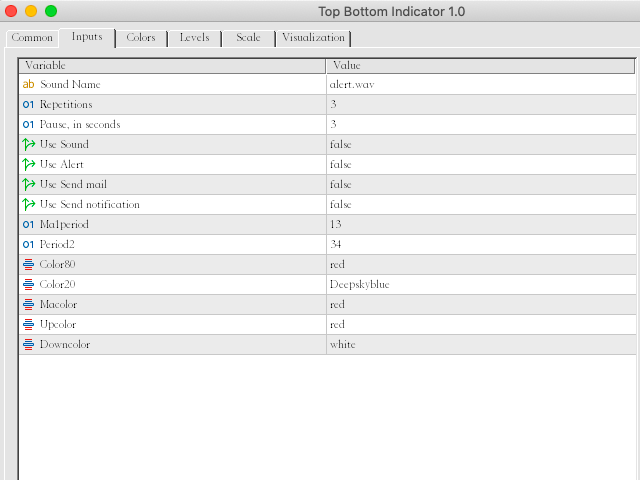
Gösterge, RSI veya CCI'dan daha kararlı ve daha az gecikmeli olan hareketli ortalama formüllerine göre tasarlanmıştır. Göstergenin üç gösterge değeri vardır, hareketli ortalama periyodu ve çizginin renkleri manuel olarak değiştirilebilir.
Bu gösterge size ne getirebilir?
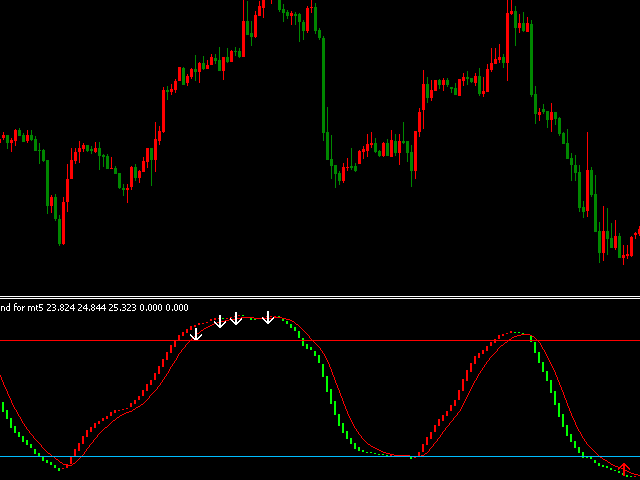
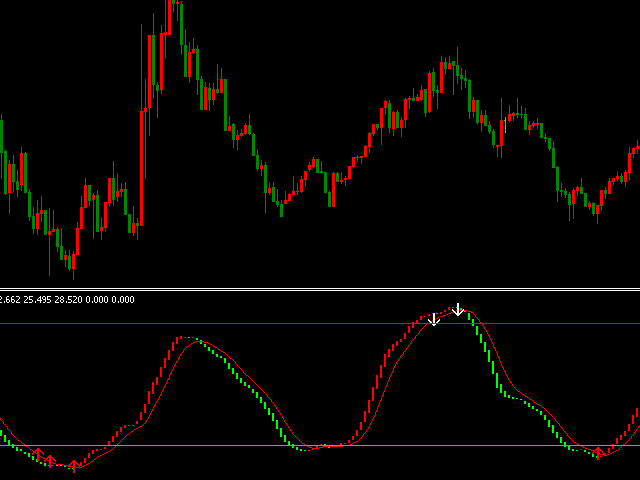
- Doğru giriş sinyalleri: Gösterge, yukarı ve aşağı ok sinyallerini çizer.
- Çok dönemli trend analizi: Bu göstergeyi büyük bir zaman çizelgesi tablosuna ve küçük bir zaman çizelgesi grafiğine yüklemek, onu kullanmanın etkisi daha iyi olacaktır. Büyük zaman çizelgesi grafiğindeki gösterge rengine göre trend yönünü değerlendirin ve küçük zaman çizelgesi grafiğindeki sinyallere göre piyasaya girin.
- Yüksek fiyat ve düşük fiyat bölümünün değerlendirilmesi: Göstergenin değeri her zaman 0 ile 100 arasındadır, buna göre fiyatın göreceli konumu analiz edilebilir. trend çizgisi 80'in üzerinde olduğunda, fiyat aşırı alım bölgesindeyse, alım pozisyonu açmak için fırsatları seçebilirsiniz. trend çizgisi 20'nin altına düştüğünde, fiyat aşırı satım bölgesindeyse , satış pozisyonları açma fırsatlarını seçebilirsiniz;
- Yeni EA'lar tasarlama: trend çizgisinin yönüne veya göstergenin sapmasına göre yeni EA'lar tasarlayabilirsiniz ;
- Alarmlar: Yukarı veya aşağı ok sinyalleri olduğunda veya 80'in üzerinde iki çizgi olduğunda ve yukarı çarpı veya 20'nin altında ve aşağı çarpıya sahip , mobil istemciye e-postalar ve masajlar gönderebilir ve aynı zamanda grafik penceresinde uyarılar gönderebilir, bu da sinyalleri her zaman kendi başınıza izlemeden anında sinyal almanızı sağlar. Her seferinde hatırlatıcı tekrar sayısı manuel olarak değiştirilebilir ve üç tür mesaj hatırlatıcısı manuel olarak kapatılabilir veya açılabilir.
- Gösterge trend çizgilerini basit ve sezgisel bir şekilde çizer, kullanımı kolaydır;
- Fiyatlar için güçlü öngörülebilirliğe sahiptir ve göstergenin değeri her zaman 0-100 arasındadır, bu da nispeten yüksek veya düşük fiyatı tahmin edebilir;
- Sağlam, sık trend sinyali tersleri olmadan;
- Küçük gecikme, fiyat geri dönüşünün ilk aşamasında trend çizgisi renklerini değiştirebilir;
- Tüm zaman dilimleri ve tüm semboller için geçerlidir;
- Eğilim çizgileri ve ok işaretleri kaymaz ve yeniden boyanmaz;
Gösterge aşağıdaki şekillerde gösterilmektedir, göstergeyi indirebilir ve MT5 terminallerinde geriye dönük test edebilirsiniz.