• Genel bakış
  • İncelemeler (4)
  • Yorumlar (6)
  • Yenilikler

Heikin Ashi Dashboard

5
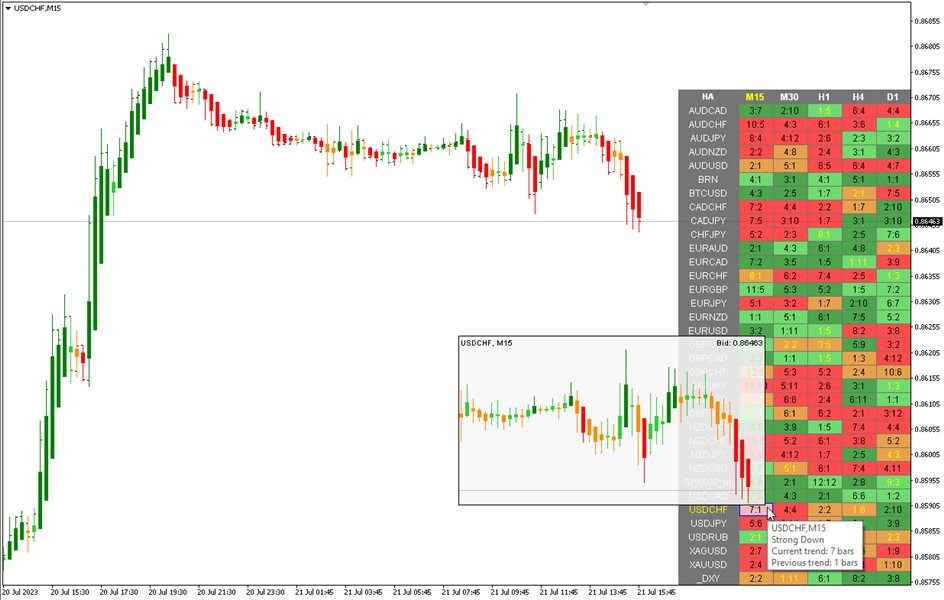
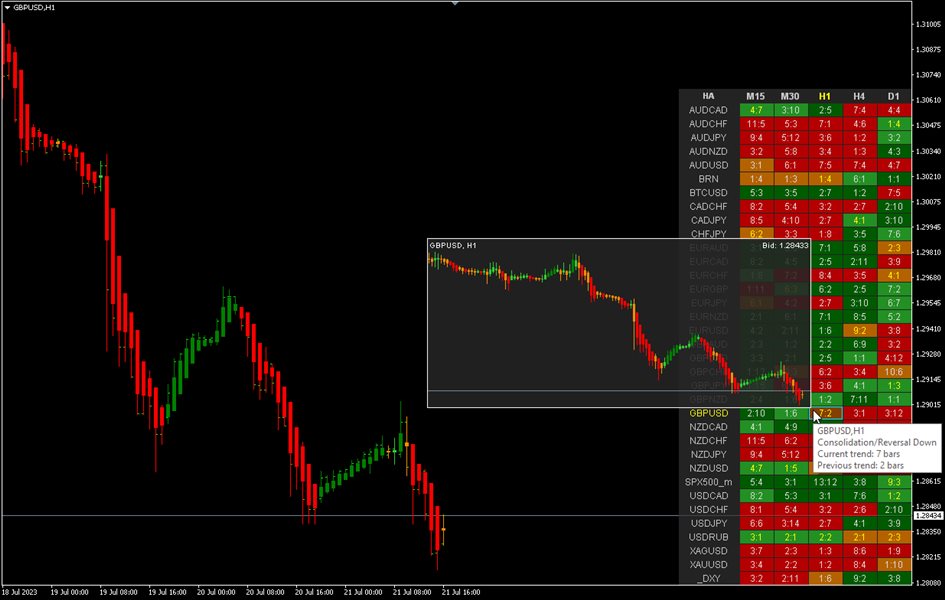
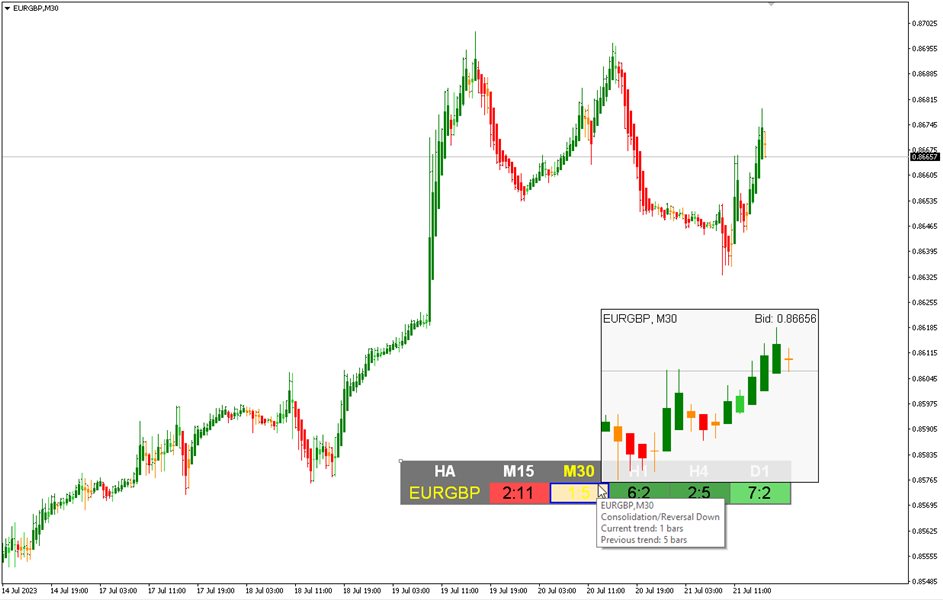
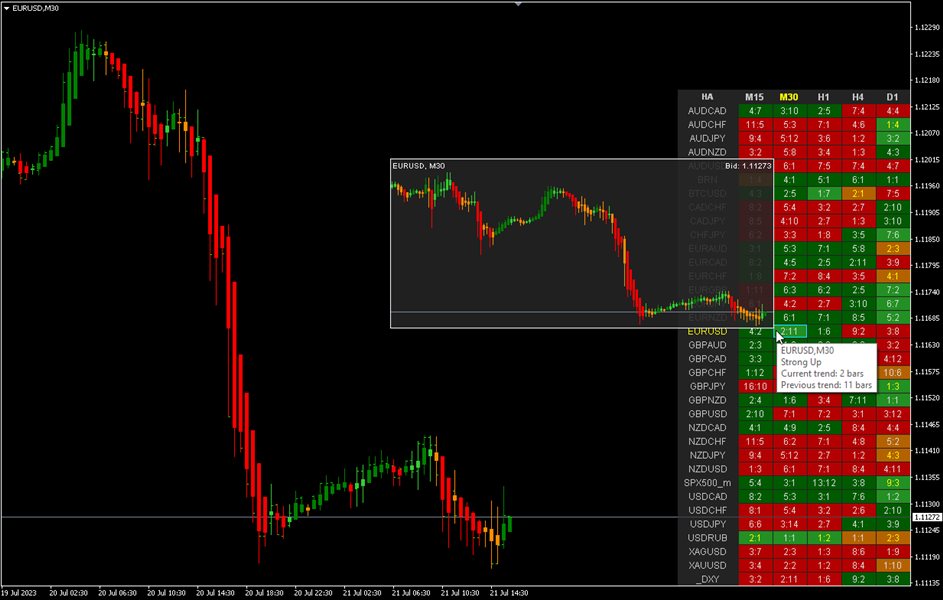
Çoklu para birimi ve çoklu zaman çerçeveli Heikin Ashi göstergesi. Piyasanın mevcut durumunu gösterir. Tarayıcı panelinde mevcut trendin yönünü, gücünü ve çubuk sayısını görebilirsiniz. Konsolidasyon/Tersine Dönme mumları da renk kullanılarak gösterilir. Parametrelerde istediğiniz para birimini ve periyodu belirtebilirsiniz. Ayrıca gösterge, trend değiştiğinde veya tersine dönüş ve konsolidasyon mumları (dojiler) göründüğünde bildirim gönderebilir. Bir hücreye tıkladığınızda bu simge ve nokta açılacaktır. Bu MTF Tarayıcıdır.
Heikin-Ashi, "ortalama hız" anlamına gelen bir Japon ticaret göstergesi ve finansal tablosudur. Heikin-Ashi grafikleri mum grafiklerine benzer ancak mum çubuklarında olduğu gibi her fiyat hareketini takip etmek yerine çeşitli fiyat hareketlerini takip ettikleri için daha düzgün bir görünüme sahiptirler. Heikin-Ashi, 1700'lü yıllarda mum grafiğini de yaratan Munehisa Homma tarafından yaratıldı. Bu grafikler tüccarlar ve yatırımcılar tarafından fiyat hareketlerini belirlemeye ve tahmin etmeye yardımcı olmak için kullanılır.

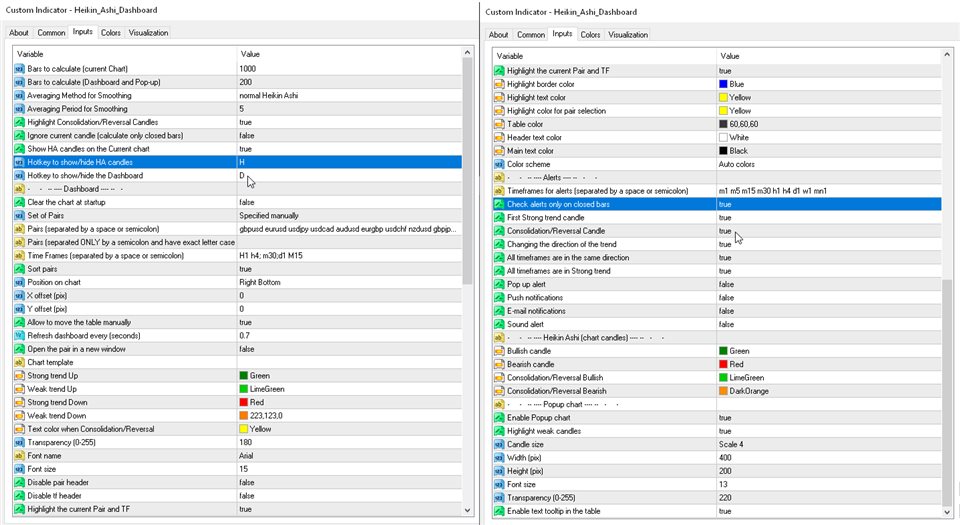
Parametreler

  • Averaging Method for Smoothing — mum fiyatlarını yumuşatmak için bir yöntemin seçimi.
— Simple MA — Basit MA
— Exponential MA — Üstel MA
— Smoothed MA — Düzleştirilmiş MA
— Linear weighted MA — Doğrusal ağırlıklı MA
— normal Heikin Ashi — normal Heikin Ashi
  • Averaging Period for Smoothing — yumuşatma süresinin seçimi.
  • Ignore current candle (calculate only closed bars) — mevcut (kapalı olmayan) mumun görüntülenmesini devre dışı bırakın.
  • Show HA candles on the current chart — Heiken Ashi mumları mevcut grafikte çizilecek.
  • Show Consolidation/Reversal Candles (Doji) — Konsolidasyon/Tersine Dönme Mumlarını (Doji) gösterin.
    • Doji. Body length to the Candle length ratio, % (body<=%) — parametre, mum gövdesinin boyutunu tüm mumun boyutuna göre yüzde olarak ayarlar. Vücut bu yüzdeye göre <= olmalıdır.
    • Doji. Wick length to the Candle length ratio, % (each wick>=%) — parametre, tüm mumun boyutuna göre üst ve alt fitillerin boyutunu yüzde olarak ayarlar. Her fitilin bu yüzdeye göre >= olması gerekir.
  • Hotkey to show/hide HA candles — HA mumlarını göstermek/gizlemek için kısayol tuşu.
  • Hotkey to show/hide the Dashboard — Kontrol Panelini göstermek/gizlemek için kısayol tuşu.

Gösterge Paneli
Clear the chart at startup — başlangıçta grafiği temizleyin.
Set of Pairs — semboller kümesi
— Market Watch — "Piyasa İzlemesi"nden eşlemeler.
— Specified manually — "Çiftler" parametrelerinde manüel olarak belirtilen çiftler.
— Current pair — yalnızca geçerli çifti gösterir.
Pairs (separated by a space or semicolon) — boşluk veya noktalı virgülle ayrılmış sembollerin listesi. Para birimi adları, büyük/küçük harf ve önek/sonek korunarak tam olarak komisyoncununki gibi yazılmalıdır.
Time Frames (separated by a space or semicolon) — boşluk veya noktalı virgülle ayrılmış zaman dilimlerinin listesi (çoklu zaman dilimi).
Sort pairs — çiftlerin listesini sıralama.
Position on chart — panelin grafikte görüntüleneceği köşe.
X offset (pix) — paneli X ekseni boyunca kaydırın;
Y offset (pix) — paneli Y ekseni boyunca kaydırın;
Refresh dashboard every (seconds) — tüm çiftler ve zaman dilimleri için güncelleme süresi.
Open the pair in a new window — tıklayarak yeni bir grafik penceresinde bir sembol açın.
Chart template — grafik yeni bir pencerede açılırsa, grafiğin şablonunun adı.
Strong trend Up — Güçlü bir yükseliş trendinin rengi.
Weak trend Up — zayıf bir yükseliş trendinin rengi.
Strong trend Down — güçlü bir düşüş trendinin rengi.
Weak trend Down — zayıf bir düşüş trendinin rengi.
Text color when Consolidation/Reversal — konsolidasyon/geri dönüş çubukları için rengi (ve grafikteki mumları) vurgulayın.
Transparency (0-255) — Şeffaflık (0-255).
Font name — Yazı tipi adı.
Font size — Yazı Boyutu.

Uyarılar
Timeframes for alerts (separated by a space or semicolon) — Uyarılara ilişkin zaman dilimleri (boşluk veya noktalı virgülle ayrılmış).
Check alerts only when the candle is closed — Uyarıları yalnızca mum kapalıyken kontrol edin.
First Strong trend candle — ilk güçlü trend mumu için uyarı.
Consolidation/Reversal Candle — bir konsolidasyon/geri dönüş mumu göründüğünde uyarı verir.
Changing the direction of the trend — trendin yönü değiştiğinde verilen bir uyarı.
All timeframes are in Strong trend — Bu uyarılar, kontrol panelindeki minimum zaman aralığına göre çubuk başına bir kez gönderilir. "Uyarıların zaman dilimleri" parametresine bakmazlar.
All timeframes are in the same direction — Bu uyarılar, kontrol panelindeki minimum zaman dilimine göre çubuk başına bir kez gönderilir. "Uyarıların zaman dilimleri" parametresine bakmazlar.
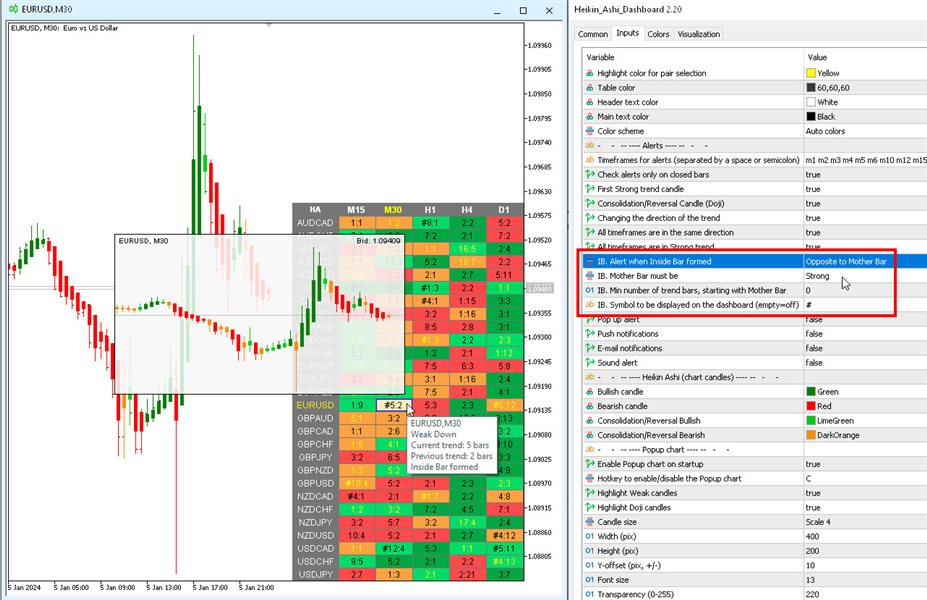
IB. Alert when Inside Bar formed — IB. Inside Bar oluştuğunda uyarı verin.
IB. Mother Bar must be — IB. Mother Bar olmalı.
IB. Min number of trend bars, starting with Mother Bar — IB. Mother Bar'dan başlayarak minimum sayıda trend çubuğu.
IB. Symbol to be displayed on the dashboard (empty=off) — IB. Kontrol panelinde görüntülenecek sembol (boş=kapalı).
İncelemeler 4
Heiner G.
530
Heiner G. 2024.07.31 13:52 
 

Great Indi! Great setting options.

h1107a14
132
h1107a14 2023.11.18 06:54 
 

Ich habe den Dashboard am Mittwoch gekauft und Nachmittag wenn die Amis eröffnen auspropiert, muss schon sagen alle Achtung ,habs auf dem Demokonto 2 Tage getestet , hat sehr gute Ergebnisse. Am Freitag Morgen bin ich dann auf dem Realkonto mit 3Trades jeweils im Tageschart eingestiegen und alle 3waren im Gewinn. Super ich bin beeindruckt.

Chapa
462
Chapa 2023.09.04 01:20 
 

Excellent indicator with dashboard. Very clever popup chart when hovering over the dashboard allowing you to quickly look over a boatload of charts. The Author's hotkeys are always welcomed and appreciated!! Cosmetically just wished the indi would have the option to display the black outline of candles and the black wicks / tails to differentiate this from the freebies and default indis and look more like my default charts.

Önerilen ürünler
Heiken Ashi Smoothed Strategy is a very simple but powerful system to get forex market trend direction. This indicator is actually 2 indicators in 1 pack, Heiken Ashi and Heiken Ashi Smoothed Moving Average both included. Because HA (Heiken Ashi) and HAS (Heiken Ashi Smoothed) are calculated in the same one system event with necessary buffers and loop only, so it is the FAST, OPTIMIZED and EFFICIENT HA having the combined indicator of MetaTrader 4. You can choose to display HA and HAS in the sam
Signal trend indicator. Detects the direction of the trend and is coloured accordingly.  Has built in audible and visual alerts when trends change. Can send notifications to your phone or email. Allows Trend and Counter-Trend trading. Works on all timeframes, all currency pairs, metals, indices and cryptocurrencies. Can be used with binary options. Distinctive features No re-drawing; Simple and clear settings; Four types of alerts; Works on all timeframes and all trading tools; Su
Be notified of every color change of Heiken Ashi (HA) candles. The indicator will trigger past and new signals every time that HA candles change their colors. Note : this tool is based on the code of Heiken Ashi indicator developed by MetaQuotes Software Corp. Features The signals are triggered at closing of last bar/opening of a new bar; Any kind of alerts can be enabled: Dialog Box, Email message, SMS notifications for smartphones and tablets, and Sound alerts; By default, up arrows are plot
Introduction It is common practice for professional trades to hide their stop loss / take profit from their brokers. Either from keeping their strategy to the themselves or from the fear that their broker works against them. Using this indicator, the stop loss / take profit points will be drawn on the product chart using the bid price. So, you can see exactly when the price is hit and close it manually.  Usage Once attached to the chart, the indicator scans the open orders to attach lines fo
Infinity Trend Pro
Yaroslav Varankin
1 (1)
This is a trend indicator without redrawing Developed instead of the binary options strategy (by the color of the Martingale candlestick) Also works well in forex trading When to open trades (binary options) A signal will appear in the place with a candle signaling the current candle It is recommended to open a deal for one candle of the current timeframe M1 and M5 When a blue dot appears, open a deal up When a red dot appears, open a trade down. How to open trades on Forex. When a signal is rec
Renko Bars 3in1
Yuriy Shatsckiy
5 (2)
The Renko_Bars_3in1 is designed for plotting 3 types of Offline Renko charts. Standard Renko Bar (the reversal bar is twice the size of the bar). Renko Range Bar (the size of all bars is the same). Renko Bars with the ability to adjust the size of the reversal bar. Attention : The demo version for review and testing can be downloaded here . Note . A chart with the M1 period is necessary to build an offline chart. When the indicator is attached to a chart, the offline chart is opened automaticall
Sayı dizilerinden birine "Orman Yangını Dizisi" denir. En güzel yeni dizilerden biri olarak kabul edildi. Başlıca özelliği, bu dizinin lineer trendlerden, hatta en kısa olanlardan kaçınmasıdır. Bu göstergenin temelini oluşturan bu özelliktir. Bir finansal zaman serisini analiz ederken, bu gösterge tüm olası trend seçeneklerini reddetmeye çalışır. Ve ancak başarısız olursa, bir trendin varlığını tanır ve uygun sinyali verir. Bu yaklaşım, yeni trendlerin başladığı anların doğru bir şekilde belirl
Solar Wind Predator
Lesedi Oliver Seilane
1000% non-repaint high accuracy signal technical indicator. Solar wind Predator work on all pairs with high and low volatility Solar wind Predator work from the 1 minute timeframe to the Monthly timeframe Swing trading H1 to W1 Scalping M1 to M30 Blue arrows above the zero line look for buying(bullish) opportunities. Orange arrows below zero line look for selling(bearish) opportunities.
Chart Patterns Detect 15 patterns (Ascending Triangle, Descending Triangle, Rising Wedge, Falling Wedge, Bullish Flag, Bearish Flag, Bullish Rectangle, Bearish Rectangle Symmetrical triangle, Head and Shoulders, Inverted Head and Shoulders, Triple top, Triple Bottom, Double Top, Double Bottom) Use historical data to calculate the probability of each pattern to succeed (possibility to filter notification according to the chance of success) gives graphic indication about the invalidation level and
What are Heiken Ashi Candles? Heiken Ashi, derived from the Japanese term 'Heikin Ashi,' translates to average price bars. It's an indicator depicting price bars on a chart. Formula for Heiken Ashi candles: - Heiken Ashi opening price: (previous candle's opening + closing price) / 2 - Closing price Heiken Ashi: (opening + high + low + closing) / 4 - Heiken Ashi peak: Max of high, opening, or closing price - Heiken Ashi bottom price: Min of low, opening, or closing price How to Read Heik
Heiken Ashi candle chart is an improved version of The Japanese candle chart, which can effectively filter the market "noise" of the Japanese candle chart. It is favored by many traders for its simplicity and intuition. For trend traders, the HA candle chart is a magic tool. Unlike the traditional Japanese candle chart, Heikenashi does not reflect the opening price, high price, low price and closing price of the market. Instead, Heikenashi calculates the value of a single K line in the dominant
Renko, Heiken Ashi, Ticks Bar, Range Bar.    Easy switching, easy setup, all in one window.        Place the Custom Chart indicator and view Renko, Heiken Ashi, Tick bar, Range bar charts in real time at real chart.    Position the offline chart window so that the indicator control panel is visible.    Switch the chart mode by click of a button.    Connect to the output chart any indicator, expert advisor without any restrictions.    No, it doesn't work in the tester.    Yes, you can use an
Signal Finding
Maryna Shulzhenko
Signal Finding is a trend indicator, a technical analysis tool that helps to determine the exact direction of a trend: either an upward or a downward movement of the price of a trading instrument. Although these indicators are a little late, they are still the most reliable signal that a trader can safely rely on. Determining the market trend is an important task for traders. With this indicator, you can predict future values. But the main application of the indicator is to generate buy and sel
Binary Options Support Resistance Indicator This indicator is designed for binary options trading and effectively shows retracements from support and resistance levels. Signals appear on the current candle. A red arrow pointing downwards indicates a potential selling opportunity, while a blue arrow pointing upwards suggests buying opportunities. All that needs adjustment is the color of the signal arrows. It is recommended to use it on the M1-M5 timeframes as signals are frequent on these timef
Dark Oscillator
Marco Solito
4.2 (10)
Dark Oscillator   is an Indicator for intraday trading. This Indicator is based on   Counter Trend  strategy, trying to intercept changes in direction, in advance compared trend following indicators.  We can enter in good price with this Indicator, in order to follow the inversion of the trend on the current instrument. It is advised to use low spread ECN brokers. This Indicator does   Not repaint   and   N ot lag . Recommended timeframes are M5, M15 and H1. Recommended working pairs: All. I nst
ATR Arrows MTF
Yuriy Shatsckiy
4.6 (10)
The ATR Arrows MTF indicator is built based on the Average True Range (ATR). It provides entry signals as arrows. All signals are generated at the current bar. Signals do not redraw! All signals in MTF mode correspond to the signals of the period specified in the MTF. It is very easy to use both for trading based on one indicator and for use in your trading systems. The indicator timeframe can be set independently of the main window, so you can combine several indicators in one window. Param
Forex Gump
Andrey Kozak
2.4 (5)
Forex Gump is a fully finished semi-automatic trading system. In the form of arrows, signals are displayed on the screen for opening and closing deals. All you need is to follow the instructions of the indicator. When the indicator shows a blue arrow, you need to open a buy order. When the indicator shows a red arrow, you need to open a sell order. Close orders when the indicator draws a yellow cross. In order to get the most effective result, we recommend using the timeframes H1, H4, D1. There
Alpha Trend sign has been a very popular trading tool in our company for a long time. It can verify our trading system and clearly indicate trading signals, and the signals will not drift. Main functions: Based on the market display of active areas, indicators can be used to intuitively determine whether the current market trend belongs to a trend market or a volatile market. And enter the market according to the indicator arrows, with green arrows indicating buy and red arrows indicating
HMA Trend Professional MT4
Pavel Zamoshnikov
4.57 (7)
Improved version of the free HMA Trend indicator (for MetaTrader 4) with statistical analysis. HMA Trend is a trend indicator based on the Hull Moving Average (HMA) with two periods. HMA with a slow period identifies the trend, while HMA with a fast period determines the short-term movements and signals in the trend direction. The main differences from the free version: Ability to predict the probability of a trend reversal using analysis of history data. Plotting statistical charts for analyz
Owl smart levels
Sergey Ermolov
4.34 (35)
MT5 versiyonu  |  FAQ Owl Smart Levels Indicator ,   Bill Williams'ın gelişmiş fraktalları , piyasanın doğru dalga yapısını oluşturan Valable ZigZag ve kesin giriş seviyelerini gösteren   Fibonacci seviyeleri   gibi popüler piyasa analiz araçlarını içeren tek gösterge içinde eksiksiz bir ticaret sistemidir. pazara ve kar elde edilecek yerlere. Stratejinin ayrıntılı açıklaması Gösterge ile çalışma talimatı Baykuş Yardımcısı ticaretinde Danışman Yardımcısı Kullanıcıların özel sohbeti -> Satın ald
Insider Scalper Binary This tool is designed to trade binary options. for short temporary spends. to make a deal is worth the moment of receiving the signal and only 1 candle if it is m1 then only for a minute and so in accordance with the timeframe. for better results, you need to select well-volatile charts.... recommended currency pairs eur | usd, usd | jpy .... the indicator is already configured, you just have to add it to the chart and trade .... The indicator signals the next can
This is an arrow indicator without a future function,developed based on the most advanced profit trading algorithms.It has the most innovative and advanced dual trend analysis module, as well as the latest and highly effective market trend prediction algorithm.Trends are your friends, and following larger trends can earn the maximum profit in foreign exchange. This indicator helps traders identify current trends and track them. Someone once made a profit of 10 times in a week by relying on it.No
PABT Pattern Indicator - it's classical system one of the signal patterns. Indicator logic - the Hi & Lo of the bar is fully within the range of the preceding bar, look to trade them as pullback in trend. In the way if indicator found PABT pattern it's drawing two lines and arrow what showing trend way.  - First line - it's entry point and drawing at: 1. On the high of signal bar or on middle of the signal bar (depending from indicator mode) for buy; 2. On the low of signal bar or on middle of t
The Stepping Trend Indicator     The Steppi ng Trend indicator uses the  average true range  (ATR indicator) in its calculation. This gives you control to set your own average true range period, I set the Default as 10.   Indicator Details. Green Arrow Up: This means you are at the starting point of a new bullish trend, it’s time to buy.   Red  Arrow  Down : This means you are at the starting point of a new  bearish  trend, it’ s time to sell .   What if you miss the Arrow Signal?   No
The Th3Eng PipFinite indicator is based on a very excellent analysis of the right trend direction with perfect custom algorithms. It show the true direction and the best point to start trading. With StopLoss point and Three Take Profit points. Also it show the right pivot of the price and small points to order to replace the dynamic support and resistance channel, Which surrounds the price. And Finally it draws a very helpful Box on the left side on the chart includes (take profits and Stop loss
ATR Band with Arrows
Pieter Gerhardus Van Zyl
The indicator is an ATR band with 2 types of arrows and a moving average Bullish arrows are only shown above the moving average and bearish arrows are only shown below the moving average The best conditions for this indicator is a trending market Usable on any timeframe and symbol Alerts for the arrows also available  Please test in tester before purchase  ----------------------------------------------------------------------
Trend Bilio - an arrow indicator without redrawing shows potential market entry points in the form of arrows of the corresponding color: upward red arrows suggest opening a buy, green down arrows - selling. The entrance is supposed to be at the next bar after the pointer. The arrow indicator Trend Bilio visually "unloads" the price chart and saves time for analysis: no signal - no deal, if an opposite signal appears, then the current deal should be closed. It is Trend Bilio that is considered
The Riko Trend indicator is a revolutionary trend trading and filtering solution with all the important features of a trend tool built into one tool! The Riko Trend indicator is good for any trader, suitable for any trader for both forex and binary options. You don’t need to configure anything, everything is perfected by time and experience, it works great during a flat and in a trend. The Riko Trend indicator is a technical analysis tool for financial markets that reflects the current price
Description Shows Heikin-Ashi candles (often misspelled Heiken-Ashi) on the chart and can alert when candles change color. The alert is useful for both entry and exit. The number of candles of the new color before an alert is raised can be set. The alert can be controlled interactively, directly from the chart. Also includes bonus indicators of current spread and ask/bid prices in large text, color coded as price changes. Usage Heikin-Ashi candles give a much better insight to the underlying tre
Indicator for binary options arrow is easy to use and does not require configuration works on all currency pairs, cryptocurrencies buy signal blue up arrow sell signal red down arrow tips do not trade during news and 15-30 minutes before their release, as the market is too volatile and there is a lot of noise it is worth entering trades one or two candles from the current period (recommended for 1 candle) timeframe up to m 15 recommended money management fixed lot or fixed percentage of the depo
Bu ürünün alıcıları ayrıca şunları da satın alıyor
Gann Made Easy
Oleg Rodin
4.83 (92)
Gann Made Easy , bay teorisini kullanarak ticaretin en iyi ilkelerine dayanan, profesyonel ve kullanımı kolay bir Forex ticaret sistemidir. WD Gann. Gösterge, Zararı Durdur ve Kâr Al Seviyeleri dahil olmak üzere doğru SATIN AL ve SAT sinyalleri sağlar. PUSH bildirimlerini kullanarak hareket halindeyken bile işlem yapabilirsiniz. Lütfen satın aldıktan sonra benimle iletişime geçin! Alım satım ipuçlarımı ve harika bonus göstergelerini ücretsiz olarak sizinle paylaşacağım! Muhtemelen Gann ticaret y
Bull versus Bear
Mohamed Hassan
4.55 (11)
Official Release price of $65 for the first 97 /100   copies ( 3  copies left). Next price is $120 !  Send us a message after your purchase to receive more information on how to get your  BONUS  for FREE  that works in great combination with Bull vs Bear ! Bull versus Bear is an easy-to-use Forex indicator that gives traders clear and accurate signals based on clear trend retests . Forget about lagging indicators or staring at charts for hours because  Bull vs Bear provides real-time entrie
- Real price is 80$ - 40% Discount ( It is 49$ now ) Contact me for instruction, add group and any questions! Related Products:  Bitcoin Expert , Gold Expert Introduction The breakout and retest strategy is traded support and resistance levels. it involves price breaking through a previous level.  The break and retest strategy is designed to help traders do two main things, the first is to avoid false breakouts. Many false breakouts start with a candlestick that breaks out of a level but ends w
Golden Trend Indicator
Noha Mohamed Fathy Younes Badr
5 (1)
Golden Trend indicator  is The best indicator for predicting trend movement this indicator never lags and never repaints and never back paints    and give  arrow buy and sell    before the candle appear  and it will help you and  will make your trading decisions clearer its work on all currencies and  gold and crypto and all time frame This unique  indicator uses very secret algorithms to catch the  trends, so you can trade using this indicator and see the trend clear on charts  manual guide and
FX Power MT4 NG
Daniel Stein
5 (14)
FX Power NG'nin Tüm Gücünün Kilidini Açın: Nihai Para Birimi Güç Ölçer FX Power, sekiz yılı aşkın süredir dünya çapındaki yatırımcıları güvenilir ve hassas döviz gücü analizleriyle güçlendirmektedir. Şimdi, FX Power NG bu güvenilir aracı bir sonraki seviyeye taşıyarak, ticaretinize benzersiz doğruluk, özelleştirme ve içgörüler getiren gelişmiş özellikler sunuyor. FX Power NG'yi Ciddi Yatırımcılar İçin Olmazsa Olmaz Kılan Nedir? FX Power NG, orijinal FX Power'da sevdiğiniz her şeyi temel ekle
FX Volume
Daniel Stein
4.58 (33)
FX Hacmi ile Forex'te Gerçek Bir Avantaj Elde Edin: Nihai Hacim Göstergesi FX Volume, gerçek piyasa duyarlılığını içeriden bir bakış açısıyla ortaya koyan ilk ve tek hacim göstergesidir. FX Volume, kurumsal piyasa katılımcılarının ve brokerlerin nasıl konumlandıklarına dair benzersiz bilgiler sağlayarak, genellikle büyük oyuncular için ayrılmış öngörü ile ticaret yapmanıza olanak tanır. COT raporlarının gecikmelerine elveda deyin - FX Volume size bu önemli bilgileri anında grafiğinizde sunarak
Trend Screener
STE S.S.COMPANY
4.81 (89)
Trend Göstergesi, Trend Alım Satım ve Filtreleme için Çığır Açan Benzersiz Çözüm, Tüm Önemli Trend Özellikleriyle Tek Bir Araç İçinde Yerleştirildi! Forex, emtialar, kripto para birimleri, endeksler ve hisse senetleri gibi tüm sembollerde/araçlarda kullanılabilen %100 yeniden boyamayan çoklu zaman çerçevesi ve Çoklu para birimi göstergesidir. SINIRLI SÜRELİ TEKLİF: Destek ve Direnç Tarama Göstergesi sadece 50$ ve ömür boyu mevcuttur. (Orijinal fiyat 250$) (teklif uzatıldı) Trend Screener, grafik
TPSproTREND PrO
Roman Podpora
4.79 (19)
TPSpro TREND PRO,   piyasayı otomatik olarak analiz eden, trend ve değişimlerinin her biri hakkında bilgi sağlayan, ayrıca yeniden çizmeden işlemlere girme sinyalleri veren bir trend göstergesidir! Gösterge her mumu ayrı ayrı analiz ederek kullanır. farklı dürtülere atıfta bulunur - yukarı veya aşağı dürtü. Para birimleri, kripto paralar, metaller, hisse senetleri ve endeksler için işlemlere tam giriş noktaları! Sürüm MT5                   GÖSTERGENİN TAM AÇIKLAMASI       Bunu -   RFI SEVİYELER
Trend Punch
Mohamed Hassan
4.95 (21)
This indicator is unstoppable when combined with our other indicator called  Support & Resistance . After purchase, send us a message and you will get it   for  FREE as a BONUS! Introducing Trend Punch , the revolutionary forex trend indicator that will transform the way you trade! Trend Punch is uniquely designed to provide precise buy and sell arrows during strong market trends, making your trading decisions clearer and more confident. Whether you're trading major currency pairs or exotic sym
MetaBands M4
Vahidreza Heidar Gholami
5 (3)
MetaBands uses powerful and unique algorithms to draw channels and detect trends so that it can provide traders with potential points for entering and exiting trades. It’s a channel indicator plus a powerful trend indicator. It includes different types of channels which can be merged to create new channels simply by using the input parameters. MetaBands uses all types of alerts to notify users about market events. Features Supports most of the channel algorithms Powerful trend detection algorith
Atomic Analyst
Issam Kassas
5 (2)
Öncelikle belirtmek gerekir ki bu Ticaret Göstergesi Yeniden Çizim Yapmaz, Gecikmez ve Gecikme Göstermez, bu da hem manuel hem de robot ticareti için ideal hale getirir. Kullanıcı kılavuzu: ayarlar, girişler ve strateji. Atom Analisti, Piyasada Daha İyi Bir Avantaj Bulmak İçin Fiyatın Gücünü ve Momentumunu Kullanan PA Fiyat Hareketi Göstergesidir. Gürültüleri ve Yanlış Sinyalleri Kaldırmaya ve Ticaret Potansiyelini Artırmaya Yardımcı Olan Gelişmiş Filtrelerle Donatılmıştır. Birden fazla katma
Quantum Breakout Indicator PRO
Bogdan Ion Puscasu
4.96 (25)
Tanıtım       Quantum Breakout PRO   , Breakout Bölgeleri ile ticaret yapma şeklinizi değiştiren çığır açan MQL5 Göstergesi! 13 yılı aşkın ticaret deneyimine sahip deneyimli tüccarlardan oluşan bir ekip tarafından geliştirilen   Quantum Breakout PRO   , yenilikçi ve dinamik koparma bölgesi stratejisiyle ticaret yolculuğunuzu yeni zirvelere taşımak için tasarlanmıştır. Kuantum Breakout Göstergesi, size 5 kar hedefi bölgesi ile kırılma bölgelerinde sinyal okları ve kırılma kutusuna dayalı ol
TrendMaestro
Stefano Frisetti
5 (3)
note: this indicator is for METATRADER4, if you want the version for METATRADER5 this is the link:  https://www.mql5.com/it/market/product/108106 TRENDMAESTRO ver 2.4 TRENDMAESTRO recognizes a new TREND in the bud, he never makes mistakes. The certainty of identifying a new TREND is priceless. DESCRIPTION TRENDMAESTRO identifies a new TREND in the bud, this indicator examines the volatility, volumes and momentum to identify the moment in which there is an explosion of one or more of these data a
Gold Stuff
Vasiliy Strukov
4.87 (243)
Gold Stuff, özellikle altın için tasarlanmış bir trend göstergesidir ve herhangi bir finansal enstrümanda da kullanılabilir. Gösterge yeniden çizilmez ve gecikmez. Önerilen zaman dilimi H1. Bu göstergede tam otomatik Uzman Danışman EA Gold Stuff çalışır. Profilimde bulabilirsiniz. Ayarları ve kişisel bir bonusu almak için satın alma işleminden hemen sonra benimle iletişime geçin!  Güçlü Destek ve Trend Tarayıcı göstergemizin ücretsiz bir kopyasını pm'den alabilirsiniz. Ben! AYARLAR Ok Ç
Dynamic Forex28 Navigator
Bernhard Schweigert
5 (2)
Dynamic Forex28 Navigator - Yeni Nesil Forex Ticaret Aracı. ŞU ANDA %49 İNDİRİM. Dynamic Forex28 Navigator, uzun zamandır popüler olan göstergelerimizin evrimidir ve üçünün gücünü tek bir göstergede birleştirir: Gelişmiş Döviz Gücü28 Göstergesi (695 inceleme) + Gelişmiş Döviz İMPULS ve UYARI (520 inceleme) + CS28 Kombo Sinyalleri (Bonus). Gösterge hakkında ayrıntılar https://www.mql5.com/en/blogs/post/758844 Yeni Nesil Güç Göstergesi Ne Sunuyor?  Orijinallerde sevdiğiniz her şey, şimdi ye
Scalper Inside PRO
Alexey Minkov
4.73 (56)
An exclusive indicator that utilizes an innovative algorithm to swiftly and accurately determine the market trend. The indicator automatically calculates opening, closing, and profit levels, providing detailed trading statistics. With these features, you can choose the most appropriate trading instrument for the current market conditions. Additionally, you can easily integrate your own arrow indicators into Scalper Inside Pro to quickly evaluate their statistics and profitability. Scalper Inside
Scalper Vault
Oleg Rodin
5 (27)
Scalper Vault , başarılı bir scalping için ihtiyacınız olan her şeyi size sağlayan profesyonel bir scalping sistemidir. Bu gösterge, forex ve ikili opsiyon tüccarları tarafından kullanılabilecek eksiksiz bir ticaret sistemidir. Önerilen zaman çerçevesi M5'tir. Sistem size trend yönünde doğru ok sinyalleri sağlar. Ayrıca size üst ve alt sinyaller ve Gann piyasa seviyeleri sağlar. Göstergeler, PUSH bildirimleri dahil her türlü uyarıyı sağlar. Göstergeyi satın aldıktan sonra lütfen benimle iletişim
Şu anda %20 İNDİRİMLİ! Herhangi bir Acemi veya Uzman Tüccar için En İyi Çözüm! Bu gösterge paneli yazılımı 28 döviz çifti üzerinde çalışıyor. Ana göstergelerimizden 2'sine (Gelişmiş Para Birimi Gücü 28 ve Gelişmiş Para Birimi Dürtüsü) dayanmaktadır. Tüm Forex piyasasına harika bir genel bakış sağlar. Gelişmiş Para Birimi Gücü değerlerini, para birimi hareket hızını ve tüm (9) zaman dilimlerinde 28 Forex çifti için sinyalleri gösterir. Trendleri ve / veya scalping fırsatlarını belirlemek içi
Satın aldıktan sonra yorum bırakın, bonus olarak 4 yüksek kaliteli gösterge alın. Chart Patterns All-in-One göstergesi, traderların teknik analizde yaygın olarak kullanılan çeşitli grafik desenlerini görselleştirmelerine yardımcı olur. Bu gösterge, potansiyel piyasa hareketlerini belirlemeye yardımcı olur ancak kârlılığı garanti etmez. Satın almadan önce göstergeyi demo modunda test etmeniz önerilir. Mevcut Teklif : "Chart Patterns All in One" göstergesinde %50 indirim. Dahil Edilen Desenler : 1
TakePropips Donchian Trend Pro
Eric John Pajarillaga Aldana
4.44 (16)
TakePropips Donchian Trend Pro   (MT4), Donchian Kanalı'nı kullanarak trendin yönünü otomatik olarak tespit eden ve size ticarete giriş ve çıkış sinyalleri sağlayan güçlü ve etkili bir araçtır! Bu çok işlevli gösterge, bir trend tarayıcı, ticaret sinyalleri, istatistiksel panel, tarayıcı, ticaret oturumları ve uyarı geçmişi panosu içerir. Size ticaret sinyalleri sağlamak ve çizelgeleri analiz ederek saatlerce tasarruf etmenizi sağlamak için tasarlanmıştır! Kullanım kılavuzunu ve kurulum kılavuzu
FX Seviyelerini Keşfedin: Ticarette Başarı için Nihai Destek ve Direnç Göstergeniz FX Levels bir destek ve direnç göstergesinden daha fazlasıdır; döviz çiftleri, endeksler, hisse senetleri veya emtialar olsun, tüm ticaret sembollerinde hassasiyet, güvenilirlik ve sorunsuz işlevsellik isteyen ciddi tüccarlar için oyunun kurallarını değiştirir. Kanıtlanmış Lighthouse yöntemi üzerine inşa edilen ve dinamik, gerçek zamanlı uyarlanabilirlik ile geliştirilen FX Levels, hassas kar hedefleri belirleme
TPSpro RFI Levels
Roman Podpora
4.82 (22)
TALİMATLAR         RUS   -        ENG       Bir gösterge ile kullanılması   önerilir       -       TPSpro   TREND PRO -   Sürüm MT4         Ticarette önemli bir unsur, bir ticaret aracını satın alma veya satma kararlarının alındığı bölgeler veya seviyelerdir. Büyük oyuncuların piyasadaki varlıklarını gizleme girişimlerine rağmen, kaçınılmaz olarak izler bırakırlar. Bizim görevimiz bu izleri nasıl tanımlayacağımızı ve doğru şekilde nasıl yorumlayacağımızı öğrenmekti. Ana işlevler:: Satıcılar ve
Connect Indicator
Sukunthakan Ngernbamrung
Connect Indicator is a tool used for connecting indicators between the MQL market and MT4. The connected indicators are made by our group and can be used for other applications, such as sending messages to the Line application or Telegram application. If you have any questions, please don't hesitate to ask us to receive support. Function and indicator buffer Buffer one is the high price of the previous candle. Buffer two is the high price of the previous candle. Usage To connect indicators to fu
Stratos Pali
Michela Russo
5 (1)
Stratos Pali Indicator   is a revolutionary tool designed to enhance your trading strategy by accurately identifying market trends. This sophisticated indicator uses a unique algorithm to generate a complete histogram, which records when the trend is Long or Short. When a trend reversal occurs, an arrow appears, indicating the new direction of the trend. Important Information Revealed Leave a review and contact me via mql5 message to receive My Top 5 set files for Stratos Pali at no cost! D
Entry Arrow Alerts: Finds market entry opportunities then notifies you via mobile or desktop alerts The key features include: Conservative mode . One entry signal per direction. Ideal for the patient trader looking to capture longer term moves. Aggressive mode . Multiple possible entry signals per direction. Ideal for the active trader looking to capture multiple moves within the same trend. Trigger Line . Price entry line helps cut down on false signals. Display Window . Allows you to instantly
Advanced Supply Demand
Bernhard Schweigert
4.91 (295)
CURRENTLY 26% OFF !! Best Solution for any Newbie or Expert Trader! This indicator is a unique, high quality and affordable trading tool because we have incorporated a number of proprietary features and a new formula. With this update, you will be able to show double timeframe zones. You will not only be able to show a higher TF but to show both, the chart TF, PLUS the higher TF: SHOWING NESTED ZONES. All Supply Demand traders will love it. :) Important Information Revealed Maximize the potenti
Supply and Demand Dashboard PRO
Bernhard Schweigert
4.8 (20)
Şu anda %20 İNDİRİMLİ! Bu gösterge paneli, birden fazla sembol ve 9 zaman dilimine kadar çalışan çok güçlü bir yazılım parçasıdır. Ana göstergemize dayanmaktadır (En iyi yorumlar: Advanced Supply Demand ).     Gösterge paneli harika bir genel bakış sağlar. Gösterir:    Bölge mukavemet derecesi dahil filtrelenmiş Arz ve Talep değerleri, Bölgelere/ve bölgeler içindeki pip mesafeleri, İç içe geçmiş bölgeleri vurgular, Tüm (9) zaman dilimlerinde seçilen semboller için 4 çeşit uyarı verir. Kişis
Graf Mason
Alexandr Lapin
5 (5)
Graf Mason is a tool that will make you a professional analyst! The method of determining wave movements using inclined channels qualitatively conveys the schematics of the movement of any instrument, showing not only possible reversals in the market, but also the goals of further movements!Destroys the myth that the market is alive , clearly showing the schematics of movements from one range to another! A professional tool, suitable for the medium term with the definition of the current trend!
Trend Pulse
Mohamed Hassan
5 (4)
Promotion   for   24 hours only   with a   40%   discount on the original price!  Please contact me after purchase to immediately get your PDF strategy + documentation for Trend Pulse !  Introducing Trend Pulse , a unique and robust indicator capable of detecting bullish, bearish, and even ranging trends! Trend Pulse uses a special algorithm to filter out market noise with real precision. If the current symbol is moving sideways, Trend Pulse will send you a ranging signal, letting you kno
Öncelikle, bu Ticaret Aracının Non-Repainting, Non-Redrawing ve Non-Lagging Gösterge olduğunu vurgulamakta fayda var, bu da onu profesyonel ticaret için ideal hale getiriyor. Çevrimiçi kurs, kullanıcı kılavuzu ve demo. Akıllı Fiyat Hareketi Kavramları Göstergesi, hem yeni hem de deneyimli tüccarlar için çok güçlü bir araçtır. İleri ticaret fikirlerini, Inner Circle Trader Analizi ve Smart Money Concepts Ticaret Stratejileri gibi 20'den fazla kullanışlı göstergeyi bir araya getirerek bir araya g
Yazarın diğer ürünleri
Symbol Manager or Grid Manager, designed to group orders into one position (by symbol and by direction). This utility will be useful to multi-currency traders, who can have multiple orders on several pairs. You will be able to see the total number of lots, the total profit, and set virtual stop loss and virtual take profit. To set a real TP (or SL), you must first set the virtual value, and then enter the command in this cell: "set". If you want to set real TP/SL for all orders at once, then en
Time Scale for MT5
Taras Slobodyanik
4.64 (22)
The indicator draws the time scale on the chart. You can specify the time offset, adjust the size and font to display on the chart ( it is displaying your local time on your chart instead of MT time ). You can also select the desired format for displaying the date and time. You may be interested in my other product , which contains a more advanced version of the Time Scale . Parameters Hours (time shift) — time shift (hours); Minutes (time shift) — time shift (minutes); Show time on mouse — sh
FREE
ZigZag Lines MTF for MT5
Taras Slobodyanik
5 (10)
Çoklu zaman dilimi ZigZag göstergesi. Destek/direnç yatay çizgilerini ve bunların kırılmalarını gösterir, ayrıca piyasanın mevcut hedeflerini de çizer. Ayrıca Fraktallar göstergesinin çizgilerini ve diğer dönemlere ait mumları da görüntüleyebilir (Üç Aylığa kadar). Gösterge son (geçerli) noktayı yeniden çizer ve bazı durumlarda son 2-3 noktayı değiştirebilir. Tüm çizgiler nesneler olarak çizilir (gösterge arabellekleri değil, ancak EA için veri alma olasılığı vardır). Uzman Danışmanda kulla
ADX Dashboard MT5
Taras Slobodyanik
5 (4)
ADX göstergesi trendi ve gücünü belirlemek için kullanılır. Fiyatın yönü +DI ve -DI değerleriyle, ADX değeri ise trendin gücünü gösterir. +DI -DI'nin üzerindeyse piyasa yükseliş trendindedir, tam tersi ise düşüş trendindedir. ADX 20'nin altında ise kesin bir yön yoktur. Gösterge bu seviyeyi kırdığı anda orta güçte bir trend başlıyor. 40'ın üzerindeki değerler güçlü bir trendi (düşüş trendi veya yükseliş trendi) gösterir. Ortalama Yönlü Hareket Endeksi (ADX) göstergesinin çoklu para birimi ve
Göreceli Güç Endeksi (RSI) göstergesinin çoklu para birimi ve çoklu zaman çerçeveli modifikasyonu. Parametrelerde istediğiniz para birimini ve zaman dilimlerini belirtebilirsiniz. Ayrıca panel aşırı alım ve aşırı satım seviyelerini geçerken bildirim gönderebilir. Noktalı bir hücreye tıkladığınızda bu sembol ve nokta açılacaktır. Bu MTF Tarayıcıdır. Kontrol panelini grafikten gizlemenin anahtarı varsayılan olarak "D"dir. Para Birimi Gücü Ölçer'e benzer şekilde, Kontrol Paneli belirli bir par
ZigZag Dashboard for MT4
Taras Slobodyanik
4.75 (4)
ZigZag göstergesinin çoklu para birimi ve çoklu zaman çerçevesi modifikasyonu. Piyasanın mevcut yönünü, son hareketin yüksekliğini, bu hareketteki çubuk sayısını ve ZigZag'ın önceki noktasının (yatay çizgi) kırılmasını görüntüler. Bu MTF Tarayıcıdır. Parametrelerde istediğiniz para birimini ve zaman dilimlerini belirtebilirsiniz. Ayrıca panel, ZigZag yön değiştirdiğinde veya önceki noktada bir ilerleme olduğunda bildirim gönderebilir. Noktalı bir hücreye tıkladığınızda bu sembol ve nokta açıl
Stokastik Osilatörün çoklu para birimi ve çoklu zaman çerçevesi modifikasyonu. Parametrelerde istediğiniz para birimini ve zaman dilimlerini belirtebilirsiniz. Panel, Sinyal ve Ana (stokastik geçiş) çizgilerinin mevcut değerlerini ve kesişimlerini görüntüler. Ayrıca gösterge aşırı alım ve aşırı satım seviyelerini geçerken bildirim gönderebilir. Noktalı bir hücreye tıkladığınızda bu sembol ve nokta açılacaktır. Bu MTF Tarayıcıdır. Para Birimi Gücü Ölçer'e benzer şekilde, Kontrol Paneli belirli b
Gösterge, ZigZag göstergesine, İşlem Seanslarına, Fraktallara veya Mumlara (standart olmayan zaman dilimleri dahil: Yıl, 6 Ay, 4 Ay, 3 Ay, 2 Ay) (Otomatik Fibo Geri Çekme) dayalı olarak Fibonacci seviyelerini otomatik olarak çizer. Fibonachi hesaplaması için daha yüksek bir zaman dilimini seçebilirsiniz. Mevcut çubuk her kapandığında seviyeler yeniden çizilir. Belirtilen seviyeleri geçerken uyarıları etkinleştirmek mümkündür. Ayrıca tarihteki seviyeleri de analiz edebilirsiniz. Bunun için "Ge
Çoklu para birimi ve çoklu zaman dilimi göstergesi Inside Bar (IB). Parametrelerde istediğiniz para birimini ve zaman dilimini belirtebilirsiniz. Panel, en son bulunan İç Çubuk (ve Ana Çubuk) formasyonunu, mevcut fiyat pozisyonunu ve Ana ve İç Çubuk seviyelerinin kırılmasını görüntüler. Hücrelerdeki çubukların ve metnin boyutunu ve rengini ayarlayabilirsiniz. Gösterge aynı zamanda seviyeler kırıldığında da bildirim gönderebiliyor. Noktalı bir hücreye tıkladığınızda belirtilen sembol ve nokta aç
Stokastik Osilatörün çoklu para birimi ve çoklu zaman çerçevesi modifikasyonu. Parametrelerde istediğiniz para birimini ve zaman dilimlerini belirtebilirsiniz. Panel, Sinyal ve Ana (stokastik geçiş) çizgilerinin mevcut değerlerini ve kesişimlerini görüntüler. Ayrıca gösterge aşırı alım ve aşırı satım seviyelerini geçerken bildirim gönderebilir. Noktalı bir hücreye tıkladığınızda bu sembol ve nokta açılacaktır. Bu MTF Tarayıcıdır. Para Birimi Gücü Ölçer'e benzer şekilde, Kontrol Paneli belirli b
Çoklu para birimi ve çoklu zaman çerçeveli Heikin Ashi göstergesi. Piyasanın mevcut durumunu gösterir. Tarayıcı panelinde mevcut trendin yönünü, gücünü ve çubuk sayısını görebilirsiniz. Konsolidasyon/Tersine Dönme mumları da renk kullanılarak gösterilir. Parametrelerde istediğiniz para birimini ve periyodu belirtebilirsiniz. Ayrıca gösterge, trend değiştiğinde veya tersine dönüş ve konsolidasyon mumları (dojiler) göründüğünde bildirim gönderebilir. Bir hücreye tıkladığınızda bu simge ve nokta a
Gösterge, diğer (ve standart olmayan) zaman dilimlerindeki Yüksek/Düşük/Açık/Kapanış Seviyelerini gösterir - Yıl, 6 Ay, 4 Ay, 3 Ay, 2 Ay, Ay, Hafta, Gün, H3-H6-H8-H12 Saat . Ayrıca mumları açmak ve sanal mumlar oluşturmak için vardiyayı da ayarlayabilirsiniz. Bu zaman dilimlerinden biri için "Dönem ayırıcılar" dikey çizgiler biçiminde mevcuttur. Uyarılar, mevcut veya önceki seviyelerin kırılmaları (dün/geçen haftanın Yüksek/Düşük çizgisinin kırılması vb.) için yapılandırılabilir. Ayrıca tüm sev
MACD Dashboard
Taras Slobodyanik
Çoklu para birimi ve çoklu zaman dilimi göstergesi MACD. Kontrol paneli hem Geleneksel (gerçek) MACD'yi hem de MetaTrader'da yerleşik olan MACD'yi görüntüleyebilir. Panelde göstergenin mevcut durumunu, MACD çizgilerinin hareket yönünü, kesişimlerini ve gösterge grafiğini içeren bir açılır pencereyi görebilirsiniz. Parametrelerde istediğiniz herhangi bir çift sembolü ve zaman dilimini belirleyebilirsiniz. Tarayıcı aynı zamanda birbirini kesen çizgiler ve Sıfır seviyesini geçen çizgiler hakkınd
Gösterge Bollinger Bantlarının çoklu para birimi ve çoklu zaman çerçevesi modifikasyonu. Kontrol panelinde Bollinger Bantlarının kırılmalarını ve dokunuşlarını görebilirsiniz. Parametrelerde istediğiniz para birimini ve zaman dilimlerini belirleyebilirsiniz. Gösterge ayrıca fiyat Bollinger Bantlarına dokunduğunda, mevcut oynaklık değiştiğinde (genişlediğinde veya düştüğünde) ve fiyat tüm bantlara dokunduğunda bildirim gönderebilir. Noktalı bir hücreye tıkladığınızda bu sembol ve nokta açılacakt
CCI Dashboard for MT5
Taras Slobodyanik
5 (1)
Emtia Kanalı Endeksi (CCI) göstergesinin çok para birimi ve çok zaman çerçeveli modifikasyonu. Parametrelerde istediğiniz para birimini ve zaman dilimlerini belirtebilirsiniz. Ayrıca panel aşırı alım ve aşırı satım seviyelerini geçerken bildirim gönderebilir. Noktalı bir hücreye tıkladığınızda bu sembol ve nokta açılacaktır. Bu MTF Tarayıcıdır. Kontrol panelini grafikten gizlemenin anahtarı varsayılan olarak "D"dir. Parametreler CCI Period — ortalama dönem. CCI Applied price — fiyat tür
MA Dashboard MT5
Taras Slobodyanik
5 (4)
Hareketli Ortalama (MA) göstergesinin çok para birimi ve çok zaman çerçeveli modifikasyonu. Kontrol panelinde göstergenin mevcut durumunu görebilirsiniz - Hızlı MA ve Yavaş MA'nın kırılmaları ve dokunuşları (fiyata göre) ve ayrıca MA çizgilerinin birbirleri arasındaki kesişimi (hareketli ortalama geçiş). Parametrelerde istediğiniz para birimini ve zaman dilimlerini belirleyebilirsiniz. Ayrıca gösterge, fiyatın çizgilere temas etmesi ve geçişleri hakkında bildirimler gönderebilir. Noktalı bir hü
Lines Profit Loss MT5
Taras Slobodyanik
4.58 (12)
Gösterge mevcut sembol üzerinde kârı (zararı) gösterir. Mevcut kar veya zararı görüntülemek için çizgiyi serbestçe sürükleyip bırakabilirsiniz. Parametreler Calculation in money or in points — kar/zararı puan veya para cinsinden hesaplayın. Add pending orders to calculate — hesaplamalarda bekleyen siparişleri dikkate alın. Magic Number (0 - all orders on symbol) — belirli sıraları değerlendirmek gerekiyorsa sihirli sayı. Offset for first drawing (points from the average price) — ilk başla
FREE
ADX Dashboard
Taras Slobodyanik
5 (4)
ADX göstergesi trendi ve gücünü belirlemek için kullanılır. Fiyatın yönü +DI ve -DI değerleriyle, ADX değeri ise trendin gücünü gösterir. +DI -DI'nin üzerindeyse piyasa yükseliş trendindedir, tam tersi ise düşüş trendindedir. ADX 20'nin altında ise kesin bir yön yoktur. Gösterge bu seviyeyi kırdığı anda orta güçte bir trend başlıyor. 40'ın üzerindeki değerler güçlü bir trendi (düşüş trendi veya yükseliş trendi) gösterir. Ortalama Yönlü Hareket Endeksi (ADX) göstergesinin çoklu para birimi ve
Göreceli Güç Endeksi (RSI) göstergesinin çoklu para birimi ve çoklu zaman çerçeveli modifikasyonu. Parametrelerde istediğiniz para birimini ve zaman dilimlerini belirtebilirsiniz. Ayrıca panel aşırı alım ve aşırı satım seviyelerini geçerken bildirim gönderebilir. Noktalı bir hücreye tıkladığınızda bu sembol ve nokta açılacaktır. Bu MTF Tarayıcıdır. Kontrol panelini grafikten gizlemenin anahtarı varsayılan olarak "D"dir. Para Birimi Gücü Ölçer'e benzer şekilde, Kontrol Paneli belirli bir par
Standart Sapma Kanalının çoklu para birimi ve çoklu zaman çerçevesi göstergesi. Piyasanın mevcut yönünü görüntüler. Panelde, doğrusal regresyon kanalının seviyelerindeki kırılmaları ve dokunuşları (fiyata göre) görebilirsiniz. Parametrelerde istediğiniz para birimini ve zaman dilimini belirtebilirsiniz. Ayrıca gösterge, seviyelere dokunulduğunda bildirim gönderebilir. Bir hücreye tıkladığınızda bu simge ve nokta açılacaktır. Bu MTF Tarayıcıdır. Kontrol panelini grafikten gizlemenin anahtarı v
Göstergenin üç ana aracı vardır: Büyüteç (Yakınlaştırma grafiği), Cetvel (Zaman ve Fiyat ölçekleri) ve Artı İşareti. Farenizle her yeri hareket ettirebilir ve farklı görüntüleme formatlarını özelleştirebilir, her öğenin boyutunu ve rengini özelleştirebilirsiniz. Büyüteç (yakınlaştırma tablosu), mumları herhangi bir zaman diliminde ve farklı ölçeklerde görüntülemenizi sağlar. Varsayılan kısayol tuşları: 'Q' - daha yüksek zaman aralığı, 'A' - daha düşük zaman aralığı, 'W' - mum boyutunu azalt,
Inside Bar Dashboard
Taras Slobodyanik
5 (2)
Çoklu para birimi ve çoklu zaman dilimi göstergesi Inside Bar (IB). Parametrelerde istediğiniz para birimini ve zaman dilimini belirtebilirsiniz. Panel, en son bulunan İç Çubuk (ve Ana Çubuk) formasyonunu, mevcut fiyat pozisyonunu ve Ana ve İç Çubuk seviyelerinin kırılmasını görüntüler. Hücrelerdeki çubukların ve metnin boyutunu ve rengini ayarlayabilirsiniz. Gösterge aynı zamanda seviyeler kırıldığında da bildirim gönderebiliyor. Noktalı bir hücreye tıkladığınızda belirtilen sembol ve nokta aç
Gann Square of 144
Taras Slobodyanik
5 (5)
Gann Kutusu (veya Gann Meydanı), W.D. Gann'ın "Piyasa tahminleri için matematiksel formül" makalesine dayanan bir pazar analiz yöntemidir. Bu gösterge üç Kare modelini çizebilir: 90, 52(104), 144. Altı ızgara çeşidi ve iki yay çeşidi vardır. Bir grafik üzerinde aynı anda birden fazla kare çizebilirsiniz. Parametreler Square — kare modelin seçimi : 90 — 90'ın karesi (veya dokuzun karesi); 52 (104) — 52'nin karesi (veya 104); 144 — 144'ün evrensel karesi; 144 (full) — karenin "tam" versiyonu
Lines Profit Loss
Taras Slobodyanik
4.93 (14)
Gösterge mevcut sembol üzerinde kârı (zararı) gösterir. Mevcut kar veya zararı görüntülemek için çizgiyi serbestçe sürükleyip bırakabilirsiniz. Parametreler Calculation in money or in points — kar/zararı puan veya para cinsinden hesaplayın. Add pending orders to calculate — hesaplamalarda bekleyen siparişleri dikkate alın. Magic Number (0 - all orders on symbol) — belirli sıraları değerlendirmek gerekiyorsa sihirli sayı. Offset for first drawing (points from the average price) — ilk başla
FREE
Angle Dashboard
Taras Slobodyanik
5 (1)
This is a multicurrency and multitimeframe indicator that calculates the angle between two points. Points for measuring the angle can be taken from the ZigZag (the last two points), or from the Moving Average (between two given bars), or it can be the closing prices of bars. Angle measurement is possible in degrees or in radians. You can select the scale for the calculation. For a better understanding of the indicator, you can study the free Angle High Low indicator. In the parameters you can
Inside Bar MT5
Taras Slobodyanik
The indicator determines the inside bar and marks its High/Low. It is plotted based on the closed candles (does not redraw). The identified inside bar can be displayed on the smaller periods. You may set a higher period (to search for the inside bar) and analyze on a smaller one. Also you can see the levels for Mother bar. Indicator Parameters Period to find Inside Bar — the period to search for the inside bar. If a specific period is set, the search will be performed in that period. Type of i
ZigZag Lines MTF
Taras Slobodyanik
4.38 (13)
Çoklu zaman dilimi ZigZag göstergesi. Destek/direnç yatay çizgilerini ve bunların kırılmalarını gösterir, ayrıca piyasanın mevcut hedeflerini de çizer. Ayrıca Fraktallar göstergesinin çizgilerini ve diğer dönemlere ait mumları da görüntüleyebilir (Üç Aylığa kadar). Gösterge son (geçerli) noktayı yeniden çizer ve bazı durumlarda son 2-3 noktayı değiştirebilir. Tüm çizgiler nesneler olarak çizilir (gösterge arabellekleri değil, ancak EA için veri alma olasılığı vardır). Uzman Danışmanda kulla
Pro Sessions MT4
Taras Slobodyanik
4.67 (3)
Bu, dört seans boyunca tüm seviyeleri (Açık-Yüksek-Düşük-Kapanış) görüntüleyebilen işlem seanslarının bir göstergesidir. Gösterge aynı zamanda oturum düzeylerini de tahmin edebilir. Oturumlar çizgiler veya dikdörtgenler (boş veya dolu) ile çizilebilir, çizgiler bir sonraki oturuma uzatılabilir. Kısayol tuşlarına (varsayılan olarak '1', '2', '3', '4') basarak her oturumu kolayca gizleyebilir/gösterebilirsiniz. ASR (Ortalama Oturum Aralığı) satırlarını görebilirsiniz (varsayılan kısayol tuşu 'A
Time Scale
Taras Slobodyanik
4.82 (11)
The indicator draws the time scale on the chart. You can specify the time offset, adjust the size and font to display on the chart (it is displaying your local time on your chart instead of MT time). You can also select the desired format for displaying the date and time. While holding down the middle mouse button, and moving the cursor, a slider will appear on the scale. You may be interested in my other product , which contains a more advanced version of the Time Scale. Parameters Hours (tim
FREE
News Dashboard MT4
Taras Slobodyanik
4.43 (7)
Bu kontrol paneli üç kaynaktan güncel haberleri görüntüler: ForexFactory.com web sitesinden (FFC takvimi), Investing.com web sitesinden ve mql5.com Ekonomik Takviminden. Haberleri etki alanına ve ülkeye göre sıralayabilir, tek tıkla grafikte görüntüleyebilirsiniz. 'Ctrl' tuşunu basılı tutarak sıralamak için birkaç farklı 'para birimi' veya 'etki' seçebilirsiniz. Ayrıca bu yardımcı program yalnızca tahmini değil, aynı zamanda sitede göründükten sonraki gerçek değerleri de gösterir. Her haber içi
Filtrele:
Heiner G.
530
Heiner G. 2024.07.31 13:52 
 

Great Indi! Great setting options.

h1107a14
132
h1107a14 2023.11.18 06:54 
 

Ich habe den Dashboard am Mittwoch gekauft und Nachmittag wenn die Amis eröffnen auspropiert, muss schon sagen alle Achtung ,habs auf dem Demokonto 2 Tage getestet , hat sehr gute Ergebnisse. Am Freitag Morgen bin ich dann auf dem Realkonto mit 3Trades jeweils im Tageschart eingestiegen und alle 3waren im Gewinn. Super ich bin beeindruckt.

Chapa
462
Chapa 2023.09.04 01:20 
 

Excellent indicator with dashboard. Very clever popup chart when hovering over the dashboard allowing you to quickly look over a boatload of charts. The Author's hotkeys are always welcomed and appreciated!! Cosmetically just wished the indi would have the option to display the black outline of candles and the black wicks / tails to differentiate this from the freebies and default indis and look more like my default charts.

Taras Slobodyanik
71723
Geliştiriciden yanıt Taras Slobodyanik 2023.09.04 08:43
Hello. Thanks for your feedback. In MT4, there is no way to draw candles on the chart yourself. So the indicator draws candles using histograms. In MT5, I think, this can be implemented.
KSJC2020
182
KSJC2020 2023.08.13 15:16 
 

So far I've only looked over it and it has very good potential. although I would like to make some improvements or add some improvements that would be very welcome. I would put the possibility of including at least two moving averages, one fast and one slow, in the PopuPs graphs, to see the behavior of the price in a single pass of the timeframe. 2. Or areas of offers and demands in the indecision or change candles, drawing them to the right. I attached a very good video about it. https://youtu.be/O06FiQTgJ0Q 3. The possibility of placing an arrow or another directional symbol in the alerts in exchange for having several colors in the graph, I like them cleaner as well as a hotkey to be able to remove them when they bother. And finally, that the alerts could be placed in an Mql4 file in the files folder so that they can be read by EAs, so that when alerts occur they have the possibility of sending screenshots to telegram channels. Example: I place Abiroid address https://abiroid.com/product/abiroid-dashboards-to-telegram-ea/, which has in all its indicators the implementation of reading alarms to send a screenshot at the moment an event occurs alarm to the private telegram channel and if one is not in front of the computer, it jumps on the mobile, In any case, it is an excellent tool like all the ones that Taras makes, that with any improvements would be a lethal weapon, I will leave the comment and I will send it to you privately

İncelemeye yanıt
Sürüm 2.50 2024.07.24
1) The alert about the number of bars in the current trend is divided into two parameters: for an up trend and for a down trend.
Sürüm 2.40 2024.03.14
1) Changed the behavior of setting the timer at startup. Now the indicator tries to start the timer again when a new tick arrives. If there is no tick for a long time (or it’s a weekend), you can click on the button on the chart and restart the timer yourself.
Sürüm 2.30 2024.02.24
1) Added parameter "Alert if current trend >=X candles (0=off)".
Sürüm 2.20 2024.01.07
1) Added parameters for Inside Bar:
- IB. Alert when Inside Bar formed
- IB. Mother Bar must be
- IB. Min number of trend bars, starting with Mother Bar
- IB. Symbol to be displayed on the dashboard (empty=off).
Sürüm 2.0 2023.11.11
1) Added automatic shifting of the dashboard to the foreground.
Sürüm 1.90 2023.09.16
1) Added parameters for Doji calculation: "Doji. Body length to the Candle length ratio, % (body<=%)" and "Doji. Wick length to the Candle length ratio, % (each wick>=%)".
2) Added a parameter to the "Popup chart" for Doji: "Highlight Doji candles". You can now turn off "Highlight Weak candles" and only see Doji.
3) The "Y-offset (pix, +/-)" parameter can now be negative.
Sürüm 1.80 2023.09.03
1) Added "Hotkey to enable/disable the Popup chart" parameter for "Popup chart".
2) Added "Y-offset (pix)" parameter for "Popup chart".
Sürüm 1.70 2023.08.25
1) Added a Dashboard recovery check when running multiple copies on the same chart.
Sürüm 1.60 2023.08.25
1) Returned the deletion of the dashboard from the chart at startup.
Sürüm 1.40 2023.07.21
1) Added "Popup chart" parameters. Now, when you hover the mouse over the cells, you can see a pop-up chart from this timeframe.
2) Added "Bars to calculate" parameters for Dashboard and Chart.
3) The condition of the list of pairs for the second parameter has been changed. Pairs in the second parameter must be typed only with a semicolon and must be in exact case. "Pairs (separated ONLY by a semicolon and have exact letter case)"
4) Fixed some minor bugs.
Sürüm 1.30 2023.06.20
1) Recompilation.
Sürüm 1.20 2023.05.23
1) Added parameter "All timeframes are in Strong trend".
Sürüm 1.10 2023.05.11
1) Added parameter "Hotkey to show/hide the Dashboard".
2) Added saving the current state of HA-candles to global variables.