• Genel bakış
  • İncelemeler
  • Yorumlar
  • Yenilikler

SimSim Line KijunSen Plus MA

Çok basit ama etkili bir gösterge.
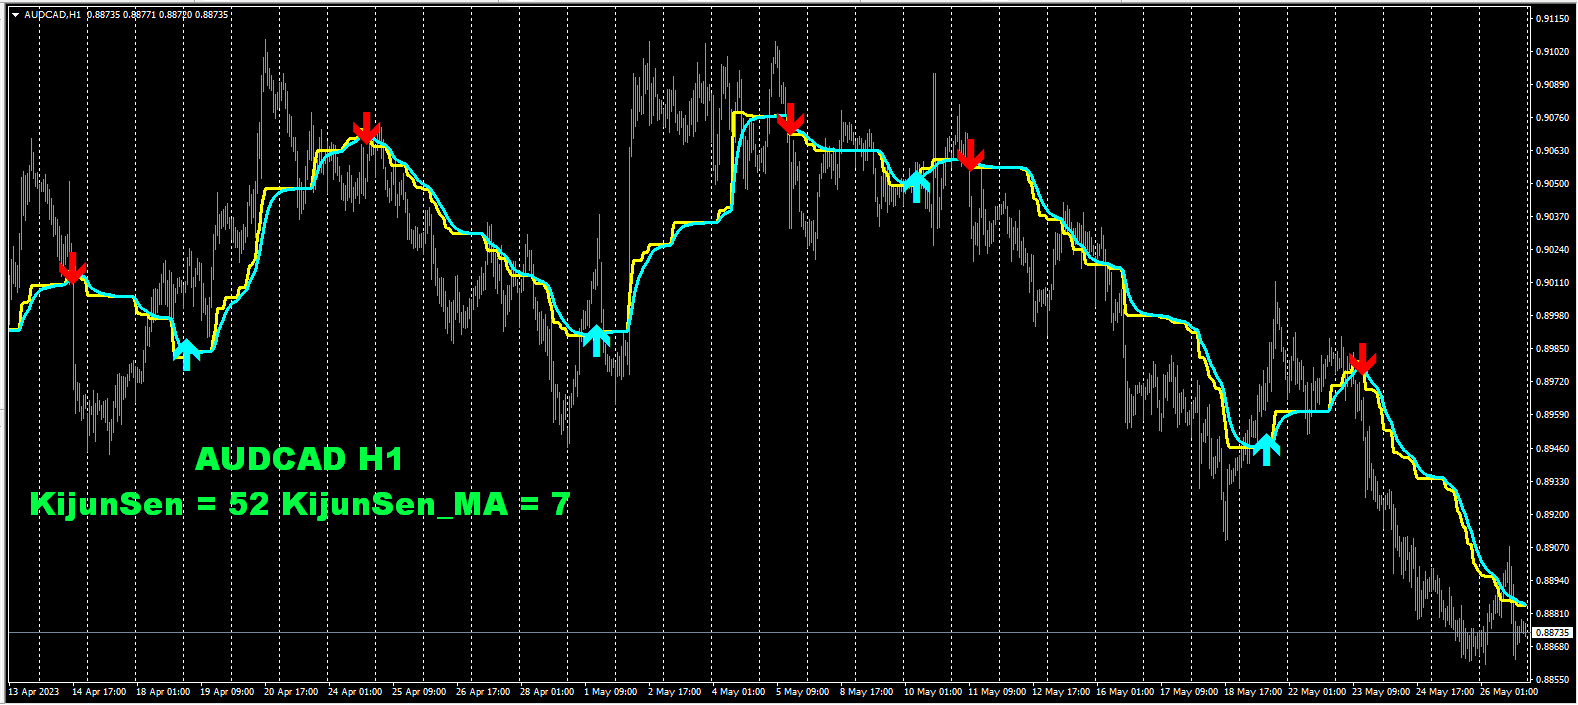
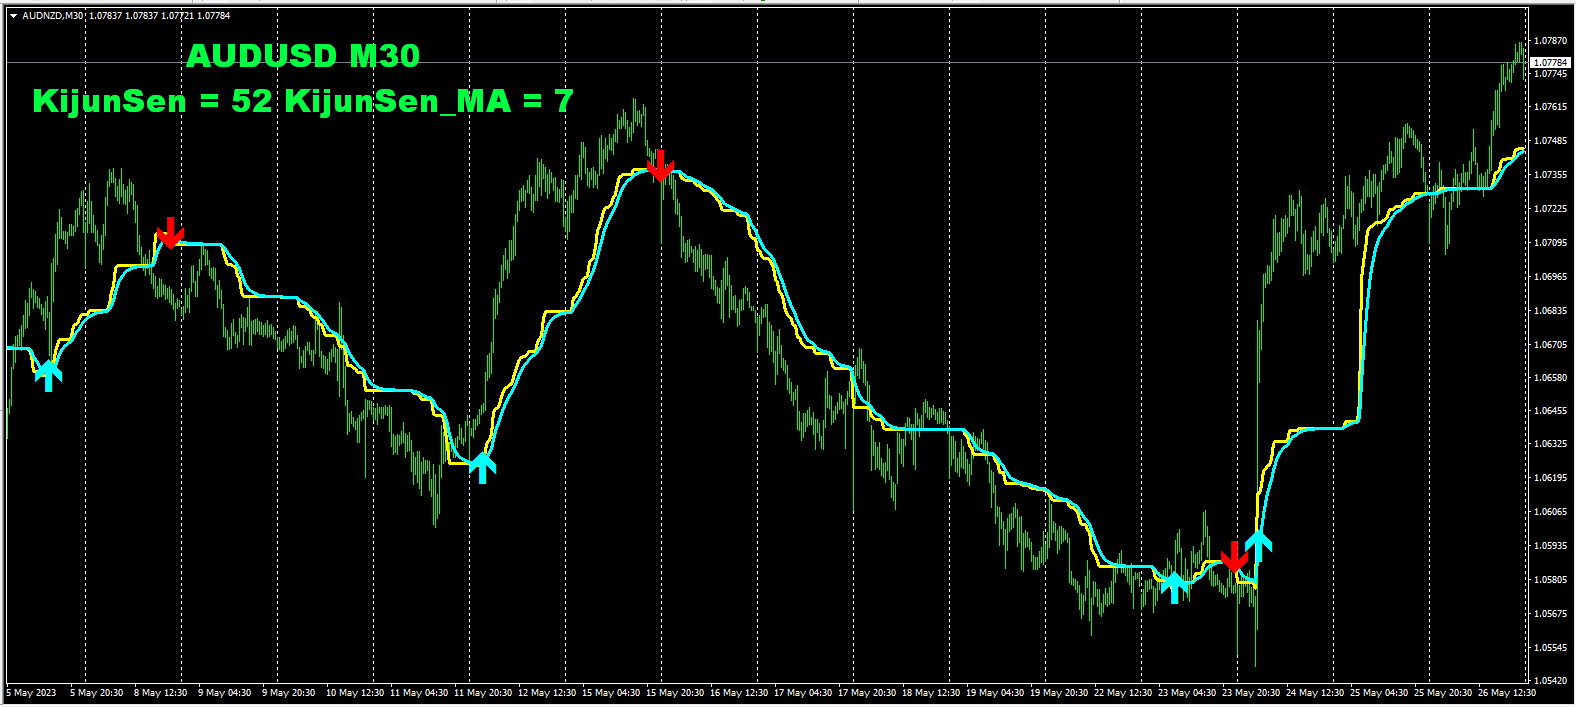
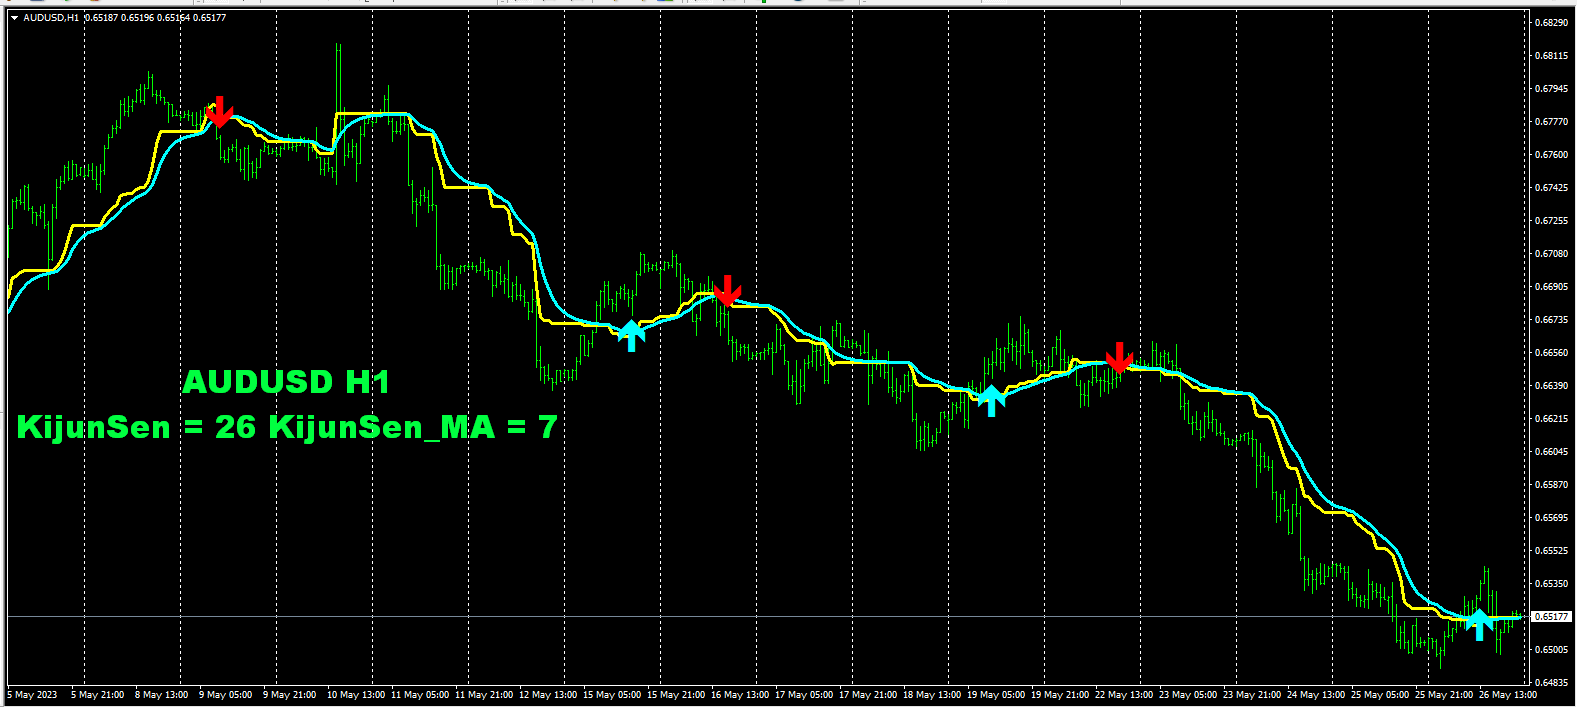
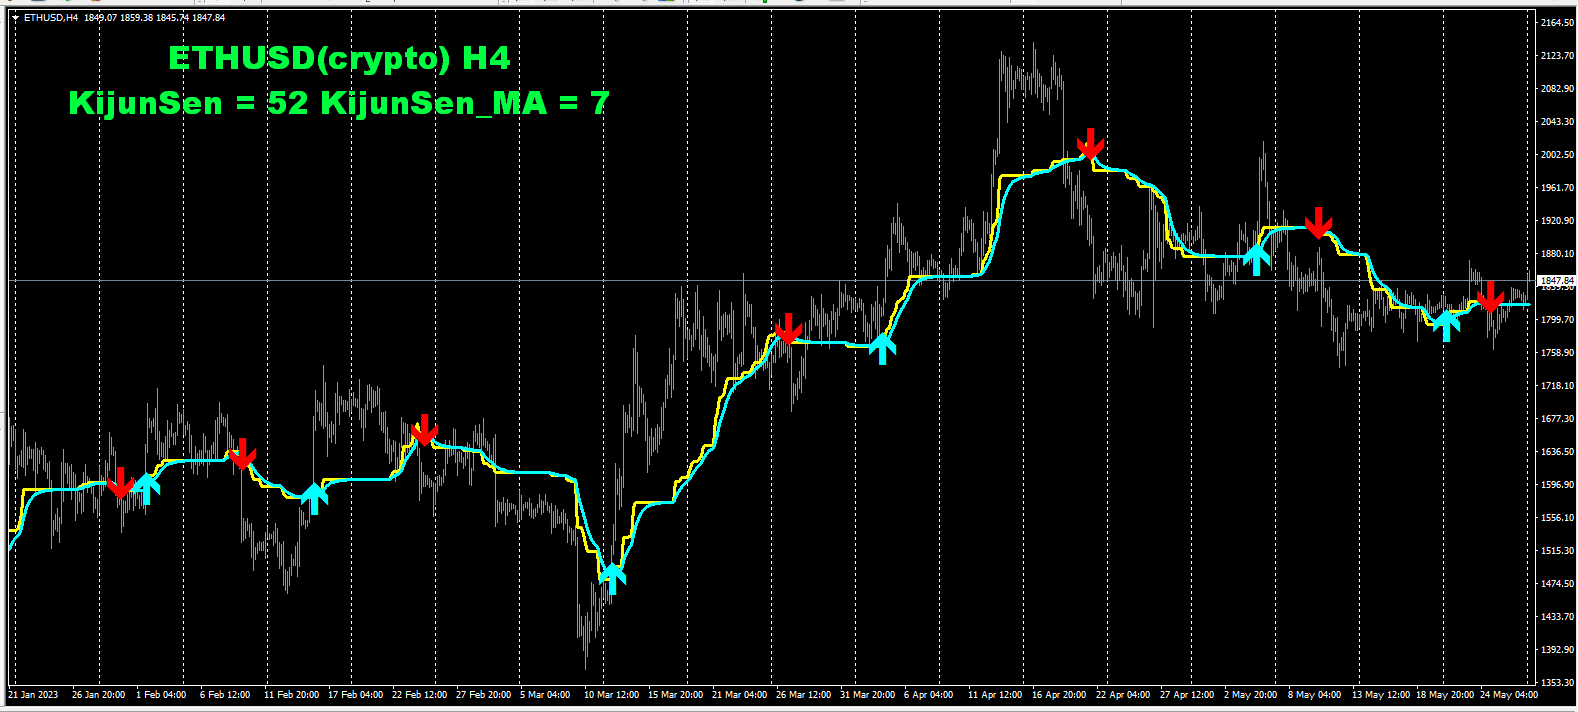
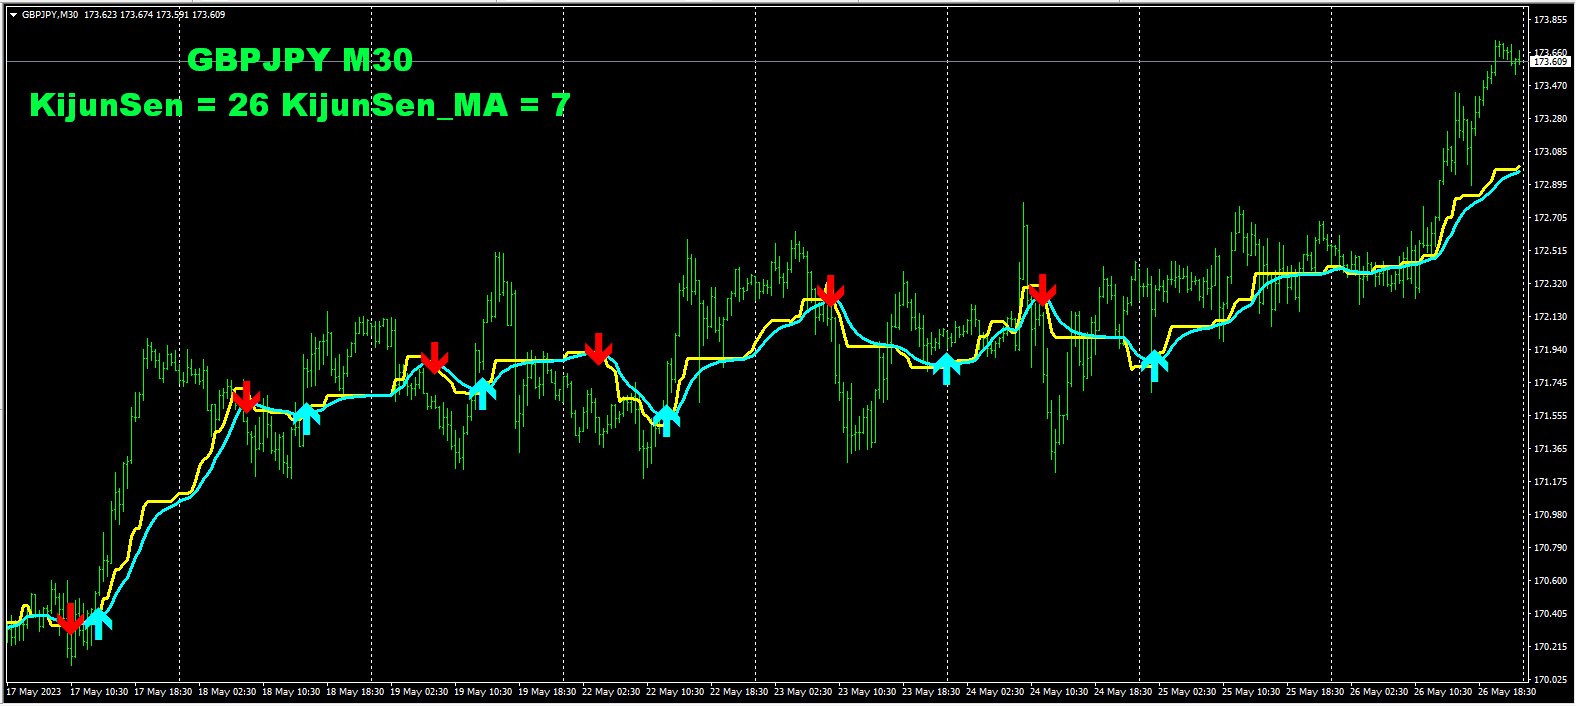
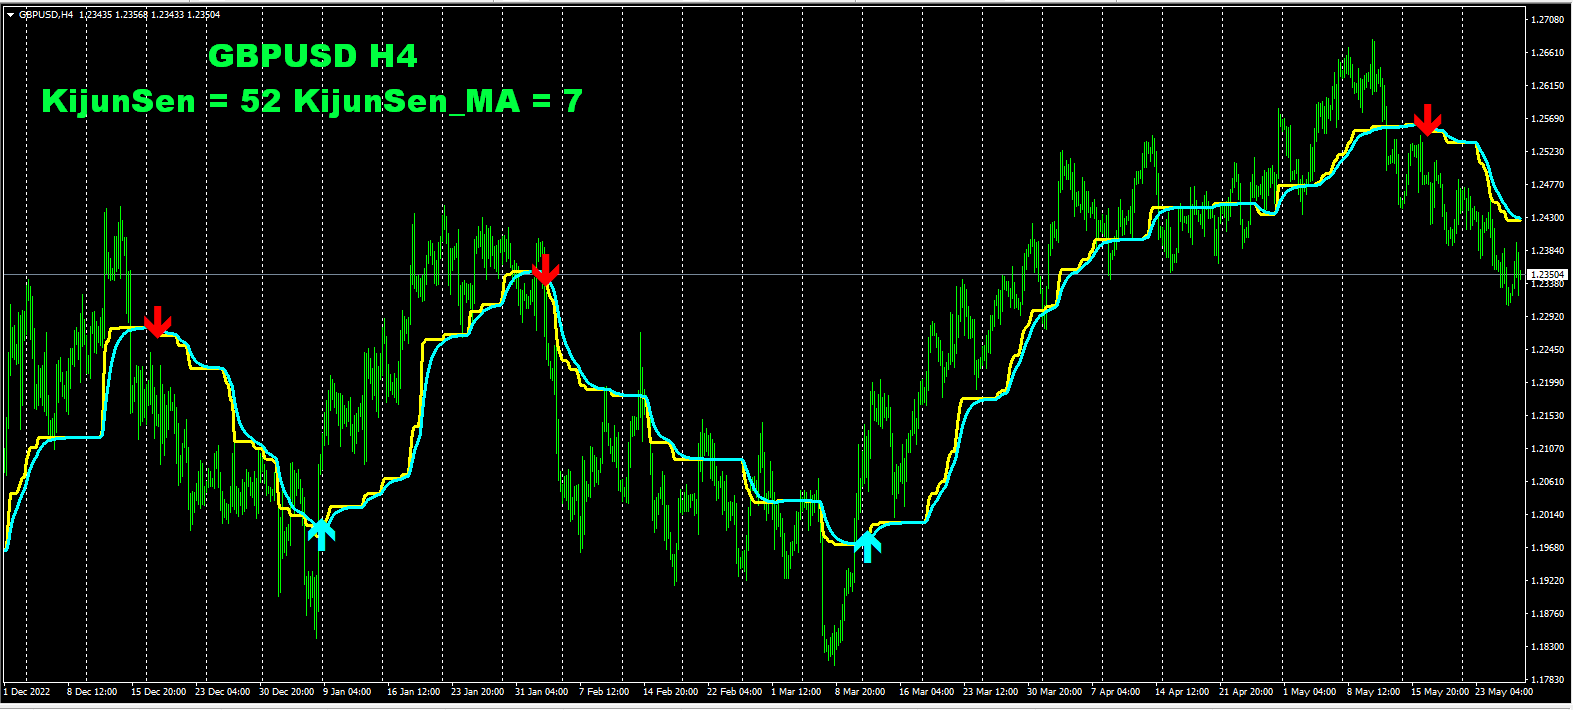
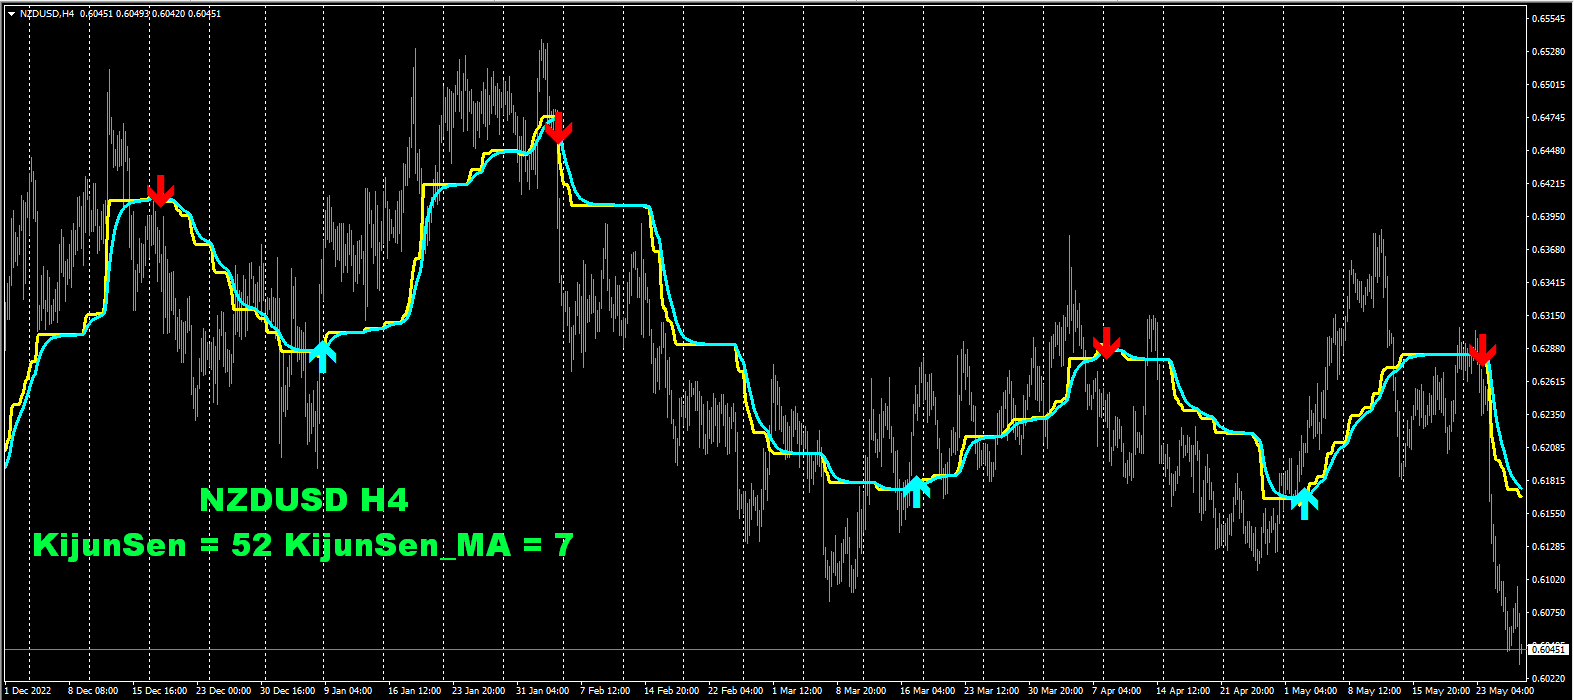
Ichimoku göstergesinin KijunSen çizgisine ve bu hattaki oluşturulmuş ortalama MA'ya dayanmaktadır. Al veya Sat sinyali: bu iki çizginin kesişme noktasıdır!!!
Ben de ticaret için Ichimoku göstergesinin KijunSen hattını sık sık kullanıyorum, eğer fiyat YÜKSEK ise, sadece SATIŞLAR DÜŞÜK ise SATIN ALMALARI dikkate alıyorum.
Ve KijunSen çizgisinin ortalaması alındıktan ve KijunSen MA çizgisi oluşturulduktan sonra, iki çizginin kesişme noktaları ortaya çıktı, bu ticaret sinyalinin güçlenmesi olarak yorumlanabilir.

Göstergenin MT5 versiyonuna bağlantı:
https://www.mql5.com/ru/market/product/96160

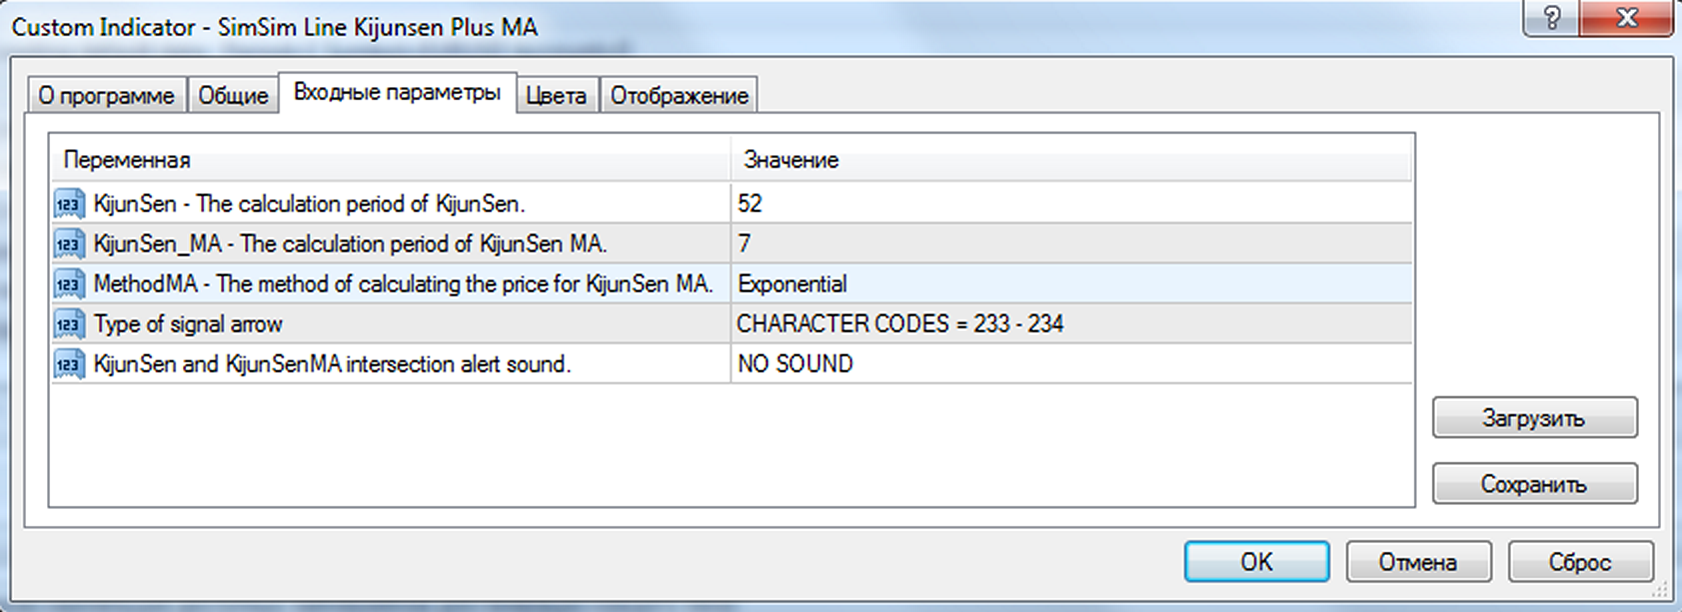
gösterge parametreleri:
KijunSen - KijunSen'in hesaplama periyodu.
KijunSen_MA - KijunSen MA'nın hesaplama periyodu.
MethodMA - KijunSen MA için fiyat hesaplama yöntemi.

Uzman Danışmanlarla iletişim için gösterge arabellekleri.

     arabellek no. 0, göstergenin KijunSen çizgisidir.
     Tampon #1, göstergenin KijunSen MA satırını içerir.
Önerilen ürünler
ADX Pointer is an indicator which is based on "Average Directional Index" and draws three numbers in chart window depending on the value of ADX. In ADX Pointer you can set "ADX_Period" which is of course period of Average Directional Index and you can also set 3 levels. When ADX value exceed first level ("ADX_Level1") in chart window appears number "1", when ADX exceed second level ("ADX_Level2") appears "2" and when ADX exceed third level ("ADX_Level3") appears "3". Simple. ADX Pointer works on
Owl smart levels
Sergey Ermolov
4.13 (23)
MT5 versiyonu  |  FAQ Owl Smart Levels Indicator ,   Bill Williams'ın gelişmiş fraktalları , piyasanın doğru dalga yapısını oluşturan Valable ZigZag ve kesin giriş seviyelerini gösteren   Fibonacci seviyeleri   gibi popüler piyasa analiz araçlarını içeren tek gösterge içinde eksiksiz bir ticaret sistemidir. pazara ve kar elde edilecek yerlere. Stratejinin ayrıntılı açıklaması Gösterge ile çalışma talimatı Baykuş Yardımcısı ticaretinde Danışman Yardımcısı Kullanıcıların özel sohbeti -> Satın ald
The HTF Stochastic displays Stochastic oscillator from a higher time frame. For example: You can see D1 Stochastic on a M30 chart. It has all parameters available like a normal Stochastic. The HTF Stochastic is visible for all time frames below the one you setup. So if you choose H4 period you can see Stochastic oscillator from that time frame on H1, M30, M15, M5 and M1 chart. For M30 setup, you can have M30 Stochastic on M15, M5 and M1 chart.
DYJ Alligator SignalSource   is based on Alligator   indicator. It can be used for any currency pair and timeframe. The blue line (Alligator's Jaw) is the Balance Line for the timeframe that was used to build the chart (13-period Smoothed Moving Average, moved into the future by 8 bars); Red Line (Alligator's Teeth) is the Balance Line for the value timeframe of one level lower (8-period Smoothed Moving Average, moved by 5 bars into the future); Green Line (Alligator's Lips) is the Balance Line
[ZhiBiCCI] indicators are suitable for all cycle use, and are also suitable for all market varieties. [ZhiBiCCI] Green solid line is a reversal of bullish divergence. The green dotted line is a classic bullish divergence. [ZhiBiCCI] The solid line to the red is a reverse bearish divergence. The red dotted line is a classical bearish divergence. [ZhiBiCCI] can be set in the parameters (Alert, Send mail, Send notification), set to (true) to send instant signals to the alarm window, email, in
The Stepping Trend Indicator     The Steppi ng Trend indicator uses the  average true range  (ATR indicator) in its calculation. This gives you control to set your own average true range period, I set the Default as 10.   Indicator Details. Green Arrow Up: This means you are at the starting point of a new bullish trend, it’s time to buy.   Red  Arrow  Down : This means you are at the starting point of a new  bearish  trend, it’ s time to sell .   What if you miss the Arrow Signal?   No
Market Structure Zig Zag
Lesedi Oliver Seilane
4.77 (22)
Free Market structure zig zag to assist in price action trading the screenshots describe how to use and how to spot patterns new version comes with alerts, email alert and  push notification alert can be used on all pairs  can be used on all timeframes  you can add additional confirmation indicators the indicator shows you your higher high and low highs as well as your lower lows and lower highs  the indication makes price action analysis easier to spot.
FREE
Keklik MA
Ai He Mai Ti • Ai Mai Ti
Index name: keklik ma Use: Ma, MACD, RSI and other technical indicators. Recommended cycle: 1 hour chart. Long term trend: EMA 1, EMA 2, EMA 3, EMA 4 moving average arrangement. Default value of EMA: 7,14,21,63.   If you want a 1-minute and 5-minute chart, it is recommended to use parameters EMA1=30; EMA2=60; EMA3=144; EMA4=250; Short term trend: EMA 1, EMA 2, EMA 3 moving average arrangement. Operator type: Super radical, radical and moderate. The default
Interactive BB Matrix
Tsvetan Tsvetanov
2 (1)
This indicator displays Bollinger Bands signals for multiple symbols and multiple time frames. The signals are created as a simple ratios which represent the distance between the current price and the moving average measured in standard deviations. This way we create a very versatile and easy to use indicator which helps us to identify not only the strongest trends but also the most overbought and oversold conditions. Features Accurate signals in real time for multiple time frames and multiple
This indicator takes input from the RSI from multiple time frames (M/W/D/H4/H1/M30), and presents the output as lines above or below the price, on the main chart. Great for scalping. Features alerts for the current time frame's RSI (the Arrows). Settings: RSI period settings for M/W/D/H4/H1/M30/Current. (Set to your preference) PSar settings for trend determination; for current chart's time frame. How to use: Simply attach to M5 (Scalping - zoom chart out completely on M5) or use on higher time
The Four Moving Averages Message indicator ( please see the description and video ), a version of Four Moving Averages , concurrently displays four Moving Averages with default settings in the main chart window: Green and Red ones represent a short-term trend, Red and Blue ones - mid-term trend, while Blue and Yellow ones - long-term trend. You can change the moving average settings and colors. However, these parameters have been configured so that to allow trading on all time frames. The built-
The KCCi uses a Grid method with a breakeven feature, its based around the CCI and Kijun-Sen of the Ichimoku indicator. Its recommended to be used with a cent account as it requires a high volume of capital along with a broker that allows numerous open positions, along with this low spreads are desired. All major pairs can be traded with this EA, including commodities and on all TFs though before any usage please optimize . IMPORTANT: These parameters will need to be increased to the max o
Gobbo MT4
Alessandro Grossi
Gobbo è un indicatore professionale che evidenzia il trend del mercato con un aspetto grafico chiaro e comprensibile, è basato sulla Moving Average e può essere impostato su qualsiasi periodo di intervallo, di default impostato sul periodo 14, scegliendo un periodo più alto evidenzierà meno cambi di tendenza per un approccio sul medio o lungo periodo, con un periodo più basso più cambi di tendenza per un approccio sul breve termine L'aggiornamento e l'adattamento al time frame scelto avviene in
HMA Trend Professional MT4
Pavel Zamoshnikov
4.67 (6)
Improved version of the free HMA Trend indicator (for MetaTrader 4) with statistical analysis. HMA Trend is a trend indicator based on the Hull Moving Average (HMA) with two periods. HMA with a slow period identifies the trend, while HMA with a fast period determines the short-term movements and signals in the trend direction. The main differences from the free version: Ability to predict the probability of a trend reversal using analysis of history data. Plotting statistical charts for analyz
GTAS FibTdi
Riviera Systems
GTAS FidTdi is a trend indicator using combination of volatility and potential retracement levels. This indicator was created by Bernard Prats Desclaux, proprietary trader and ex-hedge fund manager, founder of E-Winvest. Description The indicator is represented as a red or green envelope above or under prices. How to use Trend detecting When the envelope is green, the trend is bullish. When it is red, the trend is bearish. Trading Once a trade is opened, GTAS FibTdi shows retracement zones
FREE
KDJ Index 4   交易实用必备工具指标 波浪自动计算指标,通道趋势交易 完美的趋势-波浪自动计算通道计算 , MT4版本 完美的趋势-波浪自动计算通道计算 , MT5版本 本地跟单复制交易 Easy And Fast Copy , MT4版本 Easy And Fast Copy , MT5版本 本地跟单复制交易 模拟试用 Easy And Fast Copy , MT4 模拟账号运行 Easy And Fast Copy , MT5 模拟账号运行 "Cooperative QQ:556024  "  "Cooperation wechat:556024"  "Cooperative email:556024@qq.com" 强烈推荐趋势指标, 波浪的标准自动计算   和   波浪的标准自动计算MT5版本     KDJ指标又叫 随机指标 ,是一种相当新颖、实用的技术分析指标,它起先用于期货市场的分析,后被广泛用于股市的中短期趋势分析,是期货和股票市场上最常用的技术分析工具。 随机指标KDJ一般是用于股票分析的统计体系,根据统计学原理,通过一个特定的周期(常为9日、9周等
Professional Histogram   (PH), Forex, CFD'ler ve ikili opsiyon ticareti yapmak için oldukça verimli ve güvenilir bir araçtır. PH, hem yeni başlayanlar hem de deneyimli tüccarlar için kullanımı ve yapılandırması kolaydır. Çoğu göstergenin aksine, Professional Histogram daha uzun trendler bulur ve daha az yanlış sinyal verir. Bir alım veya satım sinyali göründüğünde, zamanında bir pozisyon açmanıza ve her zaman PC'nizin başında oturmaktan kaçınmanıza olanak tanıyan bir uyarı tetiklenir. T
The signal indicator WITHOUT REDRAWING gives recommendations for the direction of trading. When the price moves through the internal channel, it gives signals (red and blue arrows), recommending a possible change in the direction of the price movement up or down. When the price crosses the external channel, it gives signals (yellow arrows), warning that a strong price movement is possible, which will not immediately turn the trading direction. When the price crosses the average, it is possi
Sto Signal AM
Andriy Matviyevs'kyy
This indicator displays Stochastic osc signals on the price chart and allows the user to receive notifications of such signals. The Stochastic indicator is a classic and proven indicator of the technical analysis of the markets. Despite its age, it is still relevant today. Depending on the settings, the indicator allows you to work effectively on various TFs and any markets. Signals are given on fully formed bars and are not redrawn. Custom Parameters: Stochastic_Price (0-1) - The applied pric
FREE
Trend PA
Mikhail Nazarenko
5 (3)
The Trend PA indicator uses   Price Action   and its own filtering algorithm to determine the trend. This approach helps to accurately determine entry points and the current trend on any timeframe. The indicator uses its own algorithm for analyzing price changes and Price Action. Which gives you the advantage of recognizing, without delay, a new nascent trend with fewer false positives. Trend filtering conditions can be selected in the settings individually for your trading style. The indicator
Power Renko is an indicator which plots Renko bricks underneath the chart using a histogram. You can select the brick size and the timeframe of the Renko bricks as well as whether or not to use the close price or the high/low price of the candles. Renko bricks are based on price alone, not time, therefor the Renko bricks will not be aligned with the chart's time. They are extremely useful for trend trading and many different strategies can be formed from them. Buffers are provided allowing you t
Forex Indicator " MFI with Dynamic OverSold/OverBought zones " for MT4. M oney Flow Index (MFI)   is a technical oscillator which uses   price and volume data   for identifying   oversold and o verbought zones It is great to take   Sell   entries from   dynamic OverBought zone and   Buy   entries from dynamic OverSold zone MFI  is very useful for divergence detection and it is great to combine with Price Action as well D ynamic   OverBought zone - above yellow line Dynamic   OverSold zone - be
The idea for indicator is using multi-SuperTrend line to define market trend and Multi Moving Average line to find good entry point. The signal doesn't repaint, wait until the bar closed to make sure the signal is confirmed. Lowest RoyalBlue line is used for Buy stoploss. Highest Magenta line is used for Sell stoploss. Indicator supports alert when signal is coming (sends email, push notifications, sound alert). High Timeframe is better for using. Indicator parameters: CountBars = 500 — How m
LordAutoFibonnaci
Igor Pereira Calil
5 (1)
Lord Auto Fibonnaci is a free indicator for Meta Trader, in order to show the most famous chart in the financial market known as "Fibonnaci". As we can see in the images below, the fibonnaci table will automatically analyze the graph for you, with trend factors through percentage, almost infallible use, you can always work when the percentage is low or high, start shopping and sales on time, great for analyzing entries! In the images below we can see an example in gold in H4, where we are a
FREE
Advanced Trend Regime
Shellard Securities (Pty) Ltd
The indicator has been designed to function on any time-frame and any pair.   This regime filter will help the trader better evaluate whether the current market is trending, and in which direction. It quickly reacts to changes in market dynamics using a series of advanced calculations. The user is able to select whether the calculation remains standard, or if a further filter constraint is added to the calculation.   A Yellow moving average of the signal has been included for the trader to smoot
PipFinite Trend PRO
Karlo Wilson Vendiola
4.8 (1274)
Breakthrough Solution For Trend Trading And Filtering With All Important Features Built Inside One Tool! Trend PRO's smart algorithm detects the trend, filters out market noise and gives entry signals with exit levels. The new features with enhanced rules for statistical calculation improved the overall performance of this indicator. Important Information Revealed Maximize the potential of Trend Pro, please visit www.mql5.com/en/blogs/post/713938 The Powerful Expert Advisor Version Automa
The Four Moving Averages indicator ( please see the description and video ), a version of Four Moving Averages Message , concurrently displays four Moving Averages with default settings in the main chart window: Green and Red ones represent a short-term trend, Red and Blue ones - mid-term trend, while Blue and Yellow ones - long-term trend. You can change the moving average settings and colors. However, these parameters have been configured so that to allow trading on all time frames. Take a loo
This is a convenient tool if you are used to trading on a clean chart, but sometimes you need to look at this indicator. If you are not sure how to determine the inflection point of a trend and are concerned about how to draw trend lines, then this indicator is for you. From now on, you do not need to sit near the computer and analyze the price, use this indicator carefully.
"Four eyed turkey" это индикатор на основе RSI,Stochastic,MACD и Envelopes определяющий точки входа на таймфреймах М5, М15, М30, Н1. В отдельном окне индикаторы указывают возможные точки входа, параметры можете определить самостоятельно в настройках. Для RSI и Stochastic - зоны перекупленности и зона перепроданности. Для MACD - сигнальная линия и гистограмма выше 0 это BUY, для SELL противоположно . Для Envelopes - открытие свечи выше верхней линии это BUY, открытие свечи ниже нижней линии это
Trend Line Chart Pattern Signals  Is a traders Tool for Signals based on Strong  Patterns Formed By a pair of robust trend lines. They FOR WITH DIFFERENT POPULAR PATTERNS ON CHARTS LIKE – TRIANGLES, FLAGS,RANGE , ASCENDING TRIANGLES, DESCENDING PATTERNS, PENNANTS ETC. The TREND LINES  form  dynamically  on running bars. The  sensitivity  of the trend lines can be changed by custom settings. The  Buy and Sell Signals Generate upon Break Of the Trend Line + "Close" of the same bar above the previo
Bu ürünün alıcıları ayrıca şunları da satın alıyor
Gann Made Easy
Oleg Rodin
4.84 (57)
Gann Made Easy , bay teorisini kullanarak ticaretin en iyi ilkelerine dayanan, profesyonel ve kullanımı kolay bir Forex ticaret sistemidir. WD Gann. Gösterge, Zararı Durdur ve Kâr Al Seviyeleri dahil olmak üzere doğru SATIN AL ve SAT sinyalleri sağlar. PUSH bildirimlerini kullanarak hareket halindeyken bile işlem yapabilirsiniz. Lütfen satın aldıktan sonra benimle iletişime geçin! Alım satım ipuçlarımı ve harika bonus göstergelerini ücretsiz olarak sizinle paylaşacağım! Muhtemelen Gann ticaret y
Trend Punch
Mohamed Hassan
5 (12)
This indicator is unstoppable when combined with our other indicator called  Support & Resistance . After purchase, send us a message and you will get it   for  FREE as a BONUS! Introducing Trend Punch , the revolutionary forex trend indicator that will transform the way you trade! Trend Punch is uniquely designed to provide precise buy and sell arrows during strong market trends, making your trading decisions clearer and more confident. Whether you're trading major currency pairs or exotic sym
Gold Stuff
Vasiliy Strukov
4.89 (201)
Gold Stuff, özellikle altın için tasarlanmış bir trend göstergesidir ve herhangi bir finansal enstrümanda da kullanılabilir. Gösterge yeniden çizilmez ve gecikmez. Önerilen zaman dilimi H1. Bu göstergede tam otomatik Uzman Danışman EA Gold Stuff çalışır. Profilimde bulabilirsiniz. Ayarları ve kişisel bir bonusu almak için satın alma işleminden hemen sonra benimle iletişime geçin!  Güçlü Destek ve Trend Tarayıcı göstergemizin ücretsiz bir kopyasını pm'den alabilirsiniz. Ben! AYARLAR Ok Ç
Trend Pulse
Mohamed Hassan
5 (3)
Please contact me after purchase to immediately get your PDF strategy + documentation for Trend Pulse !  Official release price of $89  (1 /50 copies left). Next price is $199 . Introducing Trend Pulse , a unique and robust indicator capable of detecting bullish, bearish, and even ranging trends! Trend Pulse uses a special algorithm to filter out market noise with real precision. If the current symbol is moving sideways, Trend Pulse will send you a ranging signal, letting you know that it'
ÜRÜNÜ SATIN ALMADAN ÖNCE LÜTFEN AŞAĞIDAKİ BİLGİLERİ OKUYUNUZ! Apollo Pips PLUS SP benzersiz bir üründür! YENİ "APOLLO PIPS" GÖSTERGEMİ ARTI TÜM İŞLEM GÖSTERGELERİME ERİŞİM İLE "SÜPER PAKET" BONUSUNU ALMAK İSTEYENLER İÇİN! Apollo Pips PLUS SP ürününü satın alarak aslında Apollo Pips göstergemin tamamen yeni bir versiyonunu satın almış oluyorsunuz. Göstergenin bu sürümü, geliştirilmiş bir algoritmaya ve kullanımı kolay bir parametreye sahiptir; bu, size göstergeyi herhangi bir piyasada ve herhangi
FX Power MT4 NG
Daniel Stein
5 (12)
Sabah Brifingimiz burada mql5 ve on Telegram! FX Power MT4 NG , uzun zamandır çok popüler olan döviz gücü ölçerimiz FX Power'ın yeni neslidir. Peki bu yeni nesil güç ölçer ne sunuyor? Orijinal FX Power hakkında sevdiğiniz her şey PLUS GOLD/XAU güç analizi Daha da hassas hesaplama sonuçları Ayrı ayrı yapılandırılabilir analiz dönemleri Daha da iyi performans için özelleştirilebilir hesaplama limiti Özel çokluDaha fazlasını görmek isteyenler için örnek ayarlar Her grafikte en sevdiğiniz renkler i
Scalper Inside PRO
Alexey Minkov
4.69 (49)
An exclusive indicator that utilizes an innovative algorithm to swiftly and accurately determine the market trend. The indicator automatically calculates opening, closing, and profit levels, providing detailed trading statistics. With these features, you can choose the most appropriate trading instrument for the current market conditions. Additionally, you can easily integrate your own arrow indicators into Scalper Inside Pro to quickly evaluate their statistics and profitability. Scalper Inside
TPSproTREND PrO
Roman Podpora
4.78 (18)
TPSpro TREND PRO,   piyasayı otomatik olarak analiz eden, trend ve değişimlerinin her biri hakkında bilgi sağlayan, ayrıca yeniden çizmeden işlemlere girme sinyalleri veren bir trend göstergesidir! Gösterge her mumu ayrı ayrı analiz ederek kullanır. farklı dürtülere atıfta bulunur - yukarı veya aşağı dürtü. Para birimleri, kripto paralar, metaller, hisse senetleri ve endeksler için işlemlere tam giriş noktaları! Sürüm MT5                   GÖSTERGENİN TAM AÇIKLAMASI       Bunu -   RFI SEVİYELER
Currency Strength Wizard , başarılı ticaret için size hepsi bir arada çözüm sağlayan çok güçlü bir göstergedir. Gösterge, birden çok zaman dilimindeki tüm para birimlerinin verilerini kullanarak şu veya bu forex çiftinin gücünü hesaplar. Bu veriler, şu veya bu para biriminin gücünü görmek için kullanabileceğiniz, kullanımı kolay para birimi endeksi ve para birimi güç hatları biçiminde temsil edilir. İhtiyacınız olan tek şey, işlem yapmak istediğiniz tabloya göstergeyi eklemektir ve gösterge size
- Real price is 80$ - 40% Discount ( It is 49$ now ) Contact me for instruction, any questions! Introduction The breakout and retest strategy is traded support and resistance levels. it involves price breaking through a previous level.  The break and retest strategy is designed to help traders do two main things, the first is to avoid false breakouts. Many false breakouts start with a candlestick that breaks out of a level but ends with an immediate candlestick that brings the price back into t
RelicusRoad Pro
Relicus LLC
4.54 (80)
Şimdi 147 $ (birkaç güncellemeden sonra 499 $ 'a yükseliyor) - Sınırsız Hesaplar (PC'ler veya Mac'ler) RelicusRoad Kullanım Kılavuzu + Eğitim Videoları + Özel Discord Grubuna Erişim + VIP Durumu PİYASAYA BAKMAK İÇİN YENİ BİR YOL RelicusRoad, forex, vadeli işlemler, kripto para birimleri, hisse senetleri ve endeksler için dünyanın en güçlü ticaret göstergesidir ve yatırımcılara kârlı kalmaları için ihtiyaç duydukları tüm bilgileri ve araçları sağlar. Başlangıç ​​seviyesinden ileri seviyey
Öncelikle, bu Ticaret Aracının Non-Repainting, Non-Redrawing ve Non-Lagging Gösterge olduğunu vurgulamakta fayda var, bu da onu profesyonel ticaret için ideal hale getiriyor. Çevrimiçi kurs, kullanıcı kılavuzu ve demo. Akıllı Fiyat Hareketi Kavramları Göstergesi, hem yeni hem de deneyimli tüccarlar için çok güçlü bir araçtır. İleri ticaret fikirlerini, Inner Circle Trader Analizi ve Smart Money Concepts Ticaret Stratejileri gibi 20'den fazla kullanışlı göstergeyi bir araya getirerek bir araya g
Clear Breakout
Martin Alejandro Bamonte
"Breakout Buy-Sell" göstergesi, farklı piyasa seansları (Tokyo, Londra ve New York) sırasında fiyat kırılmalarına dayalı olarak potansiyel alım ve satım fırsatlarını belirlemek ve vurgulamak için tasarlanmıştır. Bu gösterge, traderların alım ve satım bölgelerini, ayrıca kâr alma (TP) ve zarar durdurma (SL) seviyelerini net bir şekilde görselleştirmelerine yardımcı olur. Kullanım Stratejisi Gösterge şu şekilde kullanılabilir: İlk Kurulum : Piyasa seansını seçin ve GMT farkını ayarlayın. Piyasa Gö
ŞU ANDA %31 INDIRIMLI !!! Yeni Başlayanlar veya Uzman Tüccarlar için En İyi Çözüm! Bu gösterge benzersiz, yüksek kaliteli ve uygun fiyatlı bir ticaret aracıdır çünkü bir dizi tescilli özellik ve gizli bir formül ekledik. Yalnızca BİR grafikle 28 döviz çiftinin tümü için Uyarılar verir. Yeni bir trendin veya scalping fırsatının tam tetik noktasını belirleyebildiğiniz için ticaretinizin nasıl gelişeceğini hayal edin! Yeni temel algoritmalar üzerine inşa edilen bu sistem, potansiyel işlemler
Trend Screener
STE S.S.COMPANY
4.79 (81)
Trend Göstergesi, Trend Alım Satım ve Filtreleme için Çığır Açan Benzersiz Çözüm, Tüm Önemli Trend Özellikleriyle Tek Bir Araç İçinde Yerleştirildi! Forex, emtialar, kripto para birimleri, endeksler ve hisse senetleri gibi tüm sembollerde/araçlarda kullanılabilen %100 yeniden boyamayan çoklu zaman çerçevesi ve Çoklu para birimi göstergesidir. Trend Screener, grafikte noktalarla ok trend sinyalleri sağlayan etkili bir trend trend göstergesidir. Trend analizörü göstergesinde bulunan özellikler: 1.
Şu anda %20 İNDİRİMLİ! Herhangi bir Acemi veya Uzman Tüccar için En İyi Çözüm! Bu gösterge paneli yazılımı 28 döviz çifti üzerinde çalışıyor. Ana göstergelerimizden 2'sine (Gelişmiş Para Birimi Gücü 28 ve Gelişmiş Para Birimi Dürtüsü) dayanmaktadır. Tüm Forex piyasasına harika bir genel bakış sağlar. Gelişmiş Para Birimi Gücü değerlerini, para birimi hareket hızını ve tüm (9) zaman dilimlerinde 28 Forex çifti için sinyalleri gösterir. Trendleri ve / veya scalping fırsatlarını belirlemek içi
Atomic Analyst
Issam Kassas
5 (2)
Öncelikle belirtmek gerekir ki bu Ticaret Göstergesi Yeniden Çizim Yapmaz, Gecikmez ve Gecikme Göstermez, bu da hem manuel hem de robot ticareti için ideal hale getirir. Kullanıcı kılavuzu: ayarlar, girişler ve strateji. Atom Analisti, Piyasada Daha İyi Bir Avantaj Bulmak İçin Fiyatın Gücünü ve Momentumunu Kullanan PA Fiyat Hareketi Göstergesidir. Gürültüleri ve Yanlış Sinyalleri Kaldırmaya ve Ticaret Potansiyelini Artırmaya Yardımcı Olan Gelişmiş Filtrelerle Donatılmıştır. Birden fazla katma
ŞU ANDA %26 INDIRIMLI Yeni Başlayanlar veya Uzman Tüccarlar için En İyi Çözüm! Bu Gösterge benzersiz, yüksek kaliteli ve uygun fiyatlı bir ticaret aracıdır çünkü bir dizi tescilli özellik ve yeni bir formül ekledik. Sadece BİR grafik ile 28 Forex çifti için Döviz Gücünü okuyabilirsiniz! Yeni bir trendin veya scalping fırsatının tam tetik noktasını belirleyebildiğiniz için ticaretinizin nasıl gelişeceğini hayal edin? Kullanım kılavuzu: buraya tıklayın Bu ilk olan, orijinal! Değersiz bir
PRO Renko Sistemi, RENKO grafikleri ticareti için özel olarak tasarlanmış son derece hassas bir ticaret sistemidir. Bu, çeşitli ticaret araçlarına uygulanabilen evrensel bir sistemdir. Sistemi etkin piyasa sana doğru ters sinyallerine erişim hakkı denilen ses nötralize eder. Göstergenin kullanımı çok kolaydır ve sinyal üretiminden sorumlu tek bir parametreye sahiptir. Aracı, seçtiğiniz herhangi bir ticaret aracına ve renko çubuğunun boyutuna kolayca uyarlayabilirsiniz. Yazılımımla karlı b
Gold Channel is a volatility-based indicator, developed with a specific timing algorithm for the XAUUSD pair, which consists of finding possible corrections in the market. This indicator shows two outer lines, an inner line (retracement line) and an arrow sign, where the theory of the channel is to help identify overbought and oversold conditions in the market. The market price will generally fall between the boundaries of the channel. If prices touch or move outside the channel it is a tra
Backtest and Read Overview before purchase. Chart patterns have been a topic of debate among traders; some believe they are reliable signalers, while others do not. Our Chart Patterns All-in-One indicator displays various chart patterns to help you test these theories for yourself. The profitability of these patterns is not a reflection of the indicator's effectiveness but rather an evaluation of the patterns themselves. The Chart Patterns All-in-One indicator is an excellent tool for visualizin
PZ Trend Trading
PZ TRADING SLU
4.8 (5)
Capture every opportunity: your go-to indicator for profitable trend trading Special Offer: Purchase now to receive free bonuses worth $159! (Read more for details) Trend Trading is an indicator designed to profit as much as possible from trends taking place in the market, by timing pullbacks and breakouts. It finds trading opportunities by analyzing what the price is doing during established trends. [ Installation Guide | Update Guide | Troubleshooting | FAQ | All Products ] Trade financial
TPSpro RFI Levels
Roman Podpora
4.8 (20)
Reversal First Impulse levels (RFI)    INSTRUCTIONS        RUS       -       ENG              R ecommended to use with an indicator   -   TPSpro  TREND PRO -  Version MT5 A key element in trading is zones or levels from which decisions to buy or sell a trading instrument are made. Despite attempts by major players to conceal their presence in the market, they inevitably leave traces. Our task was to learn how to identify these traces and interpret them correctly. Main functions: Displaying activ
NAM Order Blocks
NAM TECH GROUP, CORP.
5 (1)
MT4 Multi-timeframe Order Blocks detection indicator. Features - Fully customizable on chart control panel, provides complete interaction. - Hide and show control panel wherever you want. - Detect OBs on multiple timeframes. - Select OBs quantity to display. - Different OBs user interface. - Different filters on OBs. - OB proximity alert. - ADR High and Low lines. - Notification service (Screen alerts | Push notifications). Summary Order block is a market behavior that indicates order collection
Order Block Hunter
Noha Mohamed Fathy Younes Badr
5 (1)
Order block hunter indicator is the best indicator for  hunt the order blocks that area where there has been a large concentration of limit orders waiting to be executed Order blocks are identified on a chart by observing previous price action and looking for areas where the price experienced significant movement or sudden changes in direction .This indicator does that for you by using very complicated codes and helps you to take the best areas To buy and sell because it make marks at the best a
Scalper Vault
Oleg Rodin
5 (22)
Scalper Vault , başarılı bir scalping için ihtiyacınız olan her şeyi size sağlayan profesyonel bir scalping sistemidir. Bu gösterge, forex ve ikili opsiyon tüccarları tarafından kullanılabilecek eksiksiz bir ticaret sistemidir. Önerilen zaman çerçevesi M5'tir. Sistem size trend yönünde doğru ok sinyalleri sağlar. Ayrıca size üst ve alt sinyaller ve Gann piyasa seviyeleri sağlar. Göstergeler, PUSH bildirimleri dahil her türlü uyarıyı sağlar. Göstergeyi satın aldıktan sonra lütfen benimle iletişim
M1 Arrow
Oleg Rodin
4.67 (12)
Piyasanın iki temel ilkesine dayanan bir gün içi stratejisi. Algoritma, ek filtreler kullanarak hacimlerin ve fiyat dalgalarının analizine dayanmaktadır. Göstergenin akıllı algoritması, yalnızca iki piyasa faktörü bir araya geldiğinde bir sinyal verir. Gösterge, daha yüksek zaman çerçevesinin verilerini kullanarak M1 grafiğinde belirli bir aralıktaki dalgaları hesaplar. Ve dalgayı doğrulamak için gösterge, hacme göre analizi kullanır. Bu gösterge hazır bir ticaret sistemidir. Bir tüccarın ihtiya
Advanced Supply Demand
Bernhard Schweigert
4.9 (271)
CURRENTLY 26% OFF !! Best Solution for any Newbie or Expert Trader! This indicator is a unique, high quality and affordable trading tool because we have incorporated a number of proprietary features and a new formula. With this update, you will be able to show double timeframe zones. You will not only be able to show a higher TF but to show both, the chart TF, PLUS the higher TF: SHOWING NESTED ZONES. All Supply Demand traders will love it. :) Important Information Revealed Maximize the potenti
IX Power MT4
Daniel Stein
5 (5)
IX Power nihayet FX Power'ın rakipsiz hassasiyetini Forex dışı sembollere getiriyor. En sevdiğiniz endeksler, hisse senetleri, emtialar, ETF'ler ve hatta kripto para birimlerindeki kısa, orta ve uzun vadeli eğilimlerin yoğunluğunu doğru bir şekilde belirler. Terminalinizin sunduğu her şeyi analiz edebilirsiniz. Deneyin ve işlem yaparken zamanlamanızın nasıl önemli ölçüde iyileştiğini deneyimleyin. IX Power Temel Özellikler 100 hassas, yeniden boyanmayan hesaplama sonuçları - terminalini
Break and Retest
Mohamed Hassan
3.83 (12)
This Indicator only places quality trades when the market is really in your favor with a clear break and retest. Patience is key with this price action strategy! If you want more alert signals per day, you increase the number next to the parameter called: Support & Resistance Sensitivity.  After many months of hard work and dedication, we are extremely proud to present you our  Break and Retest price action indicator created from scratch. One of the most complex indicators that we made with ove
Yazarın diğer ürünleri
Çok basit ama etkili bir gösterge. Hareketli ortalama MA'nın oluşturulduğu Ichimoku göstergesinin KijunSen çizgisine dayanmaktadır. Bu iki çizgi kesiştiğinde alım veya satım sinyalleri oluşur. Ticaretim için sıklıkla KijunSen gösterge çizgisini kullanırım: Fiyat bu çizginin ÜSTÜNDE olduğunda yalnızca SATIN ALMAYA odaklanırım, ALTINDA olduğunda ise SATMAYA odaklanırım. Ayrıca KijunSen çizgisinin ortalaması alınıp KijunSen hareketli ortalaması oluşturulduktan sonra bu çizgilerin ana kesişim
"SimSim Expert Assistant" утилита для сопровождению сделок трейдера в терминале МТ4. Утилита бесплатная, пользуйтесь. Кроме того, утилита открывает сделки по сигналам индикаторов SimSim Trading (через глобальные). Параметр индикатора "Signal shaping for SimSim Expert Assistan" указывает на это. Как работать с утилитой. Expert Assistant работает в терминале МТ4 и устанавливается в папку Expert, в утилите нет ни одного параметра при старте. Все параметры находятся в списке глобальных переменных
FREE
SimSim arrow open up or down The indicator calculates and summarizes data from 23 standard indicators. What standard indicators to use, the trader chooses himself. As a result of the calculation, we obtain the current signal level. Positive values of the signal indicate a possible purchase, negative values indicate a sale.  The indicator implements a testing system that can be tested by downloading the demo version. An indicator can be a good addition to your trading strategy. The indic
SimSim Histogram open up or down The indicator calculates and summarizes data from 25 standard indicators. What standard indicators to use, the trader determines for himself. As a result of the calculation, we obtain the current signal level, and color the histogram by color: buy, sell or neutral value. The indicator implements a testing system that can be tested by downloading the demo version. An indicator can be a good addition to your trading strategy. FIRST Trial on TRIAL - THEN RENT
SimSim Tournament Currency Strength Table   This is a multi-currency indicator; it shows the relative strength of the currency and 28 major currency pairs. There are many similar indicators on the market, but let there be one more. In this indicator, unlike others, you can specify weighting factors for each timeframe. Weighting factors. Why are they? Each trader prefers to work with a specific time frame, which is the main one for him, and the signals from him are most important. Examples of
The indicator calculates and summarizes data from 25 standard indicators. What standard indicators to use, the trader chooses himself. As a result of the calculation, we obtain the current signal level. Positive values of the signal indicate a possible purchase, negative values indicate a sale.  The indicator implements a testing system that can be tested by downloading the demo version. And the main user chooses the indicators necessary for him and indicates the parameters of these indicator
Indicator. "Indicator wave or Indicator Ma". Using 23 standard indicators and the author's algorithm, the levels of purchases (from 0 to +100) and sales (from 0 to -100) are calculated. Then, using the calculated levels, the "Wave Indicator" draws a wave with 21 moving averages. The wave number is equal to the averaging period of the calculated levels. Waves # 1 - 7 Fast Moving Averages Waves from No. 8 -14 moving averages Waves from No. 15-21 slow moving averages Looking at the figu
Это стрелочный индикатор. Он выбирает данные от 23-х стандартных индикаторов и расчитывает уровень сигнала который показывает предполагаемое движение цены инструмента торговли. Минимальный уровень сигнала индикатора установлен в пределах -100 до +100%. Используйте усреднение для формирования сигнала. Как работать с индикаторам. Следим за сигналом и принимаем решения. Индикатор перерисовывается только на нулевой свечи, поэтому решения принимаются после закрытия свечи с новым сигналом, и сигн
Это линейный индикатор. Он выбирает данные от 23-х стандартных индикаторов и рассчитывает уровень сигнала, который показывает предполагаемое движение цены инструмента торговли. Минимальный уровень сигнала индикатора установлен в пределах -100 до +100%. Используйте усреднение для формирования сигнала. Как работать с индикаторам. Следим за сигналом и принимаем решения. При пересечении нулевого уровня индикатора снизу вверх можно рассматривать покупки. При пересечении нулевого уровня сверху
Это индикатор гистограмма. Он выбирает данные от 23-х стандартных индикаторов и расчитывает уровень сигнала который показывает предполагаемое движение цены инструмента торговли. Минимальный уровень сигнала индикатора установлен в пределах -100 до +100%. Используйте усреднение для формирования сигнала. Как работать с индикаторам. Следим за сигналом и принимаем решения, цвета гистограммы показывают когда возможны покупки а когда продажи, или нейтральный цвет - сделать паузу. Индикатор перерис
MT4 trend indicator works without redrawing. Provides signals for entering trades, works on charts of any instrument. Трендовый индикатор МТ4, работает без перерисовки.  Выдает сигналы для входа в сделки, работает на графиках любого инструмента. Input parameters are for styling and messages only. / Входные параметры только для оформления и сообщений. All original signal calculations do not need additional parameters. / Все оригинальные расчеты сигнала, не нуждаются в дополнительных параметрах.
MT5 trend indicator works without redrawing. Provides signals for entering trades, works on charts of any instrument. Трендовый индикатор МТ5, работает без перерисовки.  Выдает сигналы для входа в сделки, работает на графиках любого инструмента. Input parameters are for styling and messages only. / Входные параметры только для оформления и сообщений. All original signal calculations do not need additional parameters. / Все оригинальные расчеты сигнала, не нуждаются в дополнительных параметрах.
Uzman Serisi: SimSim Çoklu ADX MT5 Danışmanı. Çoklu para birimi ve çoklu dönem, standart ADX (Ortalama Yönlü Hareket Endeksi) göstergesini kullanır. Danışman, optimizasyon sonucunda elde edilen verilerle çalışır. Danışmanın çalışması için kaynak dosyalar oluşturmak için üç adım. Aşama 1. ????.Xml dosyası oluşturuyoruz.      T_Tf = H1 - Zaman çerçevesi seçimi. Zaman aralığı.      K_Period = 21 - Ortalama periyodu.      P_Prof = 0 - Kâr Al. Kâr düzeyi.      S_Stop = 0 - Kaybı Durd
Uzman Serisi: SimSim Çoklu ADXWilder MT5 Danışmanı. Çoklu para birimi ve çoklu dönem, ADXWilder göstergesini kullanır (Welles Wilder'ın Ortalama Yönlü Hareket Endeksi). Danışman, optimizasyon sonucunda elde edilen verilerle çalışır. Danışmanın çalışması için kaynak dosyalar oluşturmak için üç adım. Aşama 1. ????.Xml dosyası oluşturuyoruz.      T_Tf = H1 - Zaman çerçevesi seçimi. Zaman aralığı.      K_Period = 21 - Ortalama periyodu.      P_Prof = 0 - Kâr Al. Kâr düzeyi.      S_S
Filtrele:
İnceleme yok
İncelemeye yanıt
Sürüm 1.7 2024.08.01
Регламентные работы и компиляция для новой версии терминала.
Sürüm 1.6 2023.07.25
Optimized indicator performance.
Sürüm 1.5 2023.06.22
Косметический ремонт. Redecorating.
Sürüm 1.4 2023.06.02
Küçük kozmetik düzeltmeler (sinyal hesaplamalarını etkilemez).
Sürüm 1.3 2023.05.30
Bildirimler oluşturulurken bazı hatalar düzeltildi.
Sürüm 1.2 2023.05.28
1.2 sürümünde bir ok işareti eklendi. Sinyal hesaplamaları, daha doğru.
Sürüm 1.1 2023.03.30
Updated message protocol on mobile.