Zigzag indicator
- Göstergeler
- Aleksandr Puchkin
- Sürüm: 1.2
- Güncellendi: 2 Mayıs 2023
- Etkinleştirmeler: 10
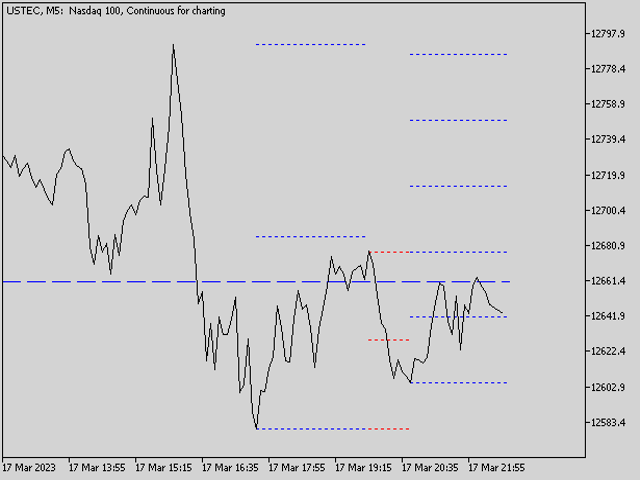
Gösterge iki zaman periyodu ile çalışır, dalgaları doğrudan çalışma tablosu üzerinde görsel olarak gösterir ve yatay dalga seviyelerini gösterir.
ZigZag göstergesi, dalga hareketinin algılanmasını kolaylaştıran ve dalgaları seviyelere göre aralıklara bölen görünür eğimli çizgilerle fiyat grafiğindeki önemli üst ve altları birleştirir. Ekstrem değerler, High\Low fiyatlar veya Close fiyatları ile hesaplanır.
Dalga seviyeleri bir sonraki dalgaya yansıtılır, bu da destek / direnç seviyeleri almanızı sağlar. Düzeyler, Fibonacci algoritması kullanılarak hesaplanır veya doğrusal bir ilişki kullanılır. Oluşan zaman periyodunun seviyeleri genellikle daha yüksek önceliğe sahiptir. Her seviyede, seviye hakkında gerekli bilgileri içeren bir araç ipucu bulunur.
ZigZag göstergelerinin bir özelliği, bir varlığın fiyatındaki bir değişikliğin, yalnızca bu seviyelere dayalı olarak alım satım kararları verirken dikkate alınması gereken önceki değerde bir değişikliğe neden olabilmesidir. Bununla birlikte, bu tür seviyeler, yön değiştirmenin veya hareketi yavaşlatmanın mümkün olduğu kotasyonların ve fiyat değerlerinin olası hareket yönü hakkında bir yargıya varmayı mümkün kılar.
Gösterge algoritması şu anda çalışacak şekilde uyarlanmıştır ve geçmiş verilerin analizi için tasarlanmamıştır.
Giriş parametreleri
- High period for plotting - bina seviyeleri için kıdemli dönem
- Waves plotting mode - seviye oluşturma modu ( Close veya HighLow )
- Levels plotting mode - seviye oluşturma modu (Fibo veya Line)
- Backstep - hesaplanacak çubuk sayısı
- Style of Current period lines - cari dönem seviye stili
- Style of High period lines - üst düzey stil
- Color of Up-Direction wave - yukarı yön ile seviyelerin rengi
- Color of Down-Direction wave - aşağı yönlü seviyelerin rengi