Fibonacci Retracements and Extensions MT4
- Göstergeler
- Gary E Joe
- Sürüm: 1.0
- Etkinleştirmeler: 5
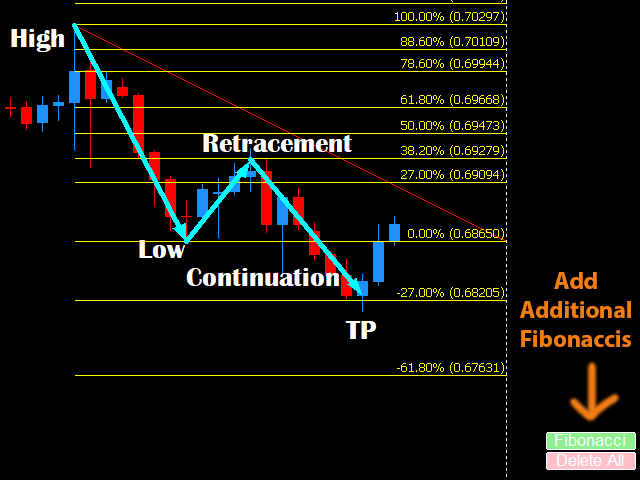
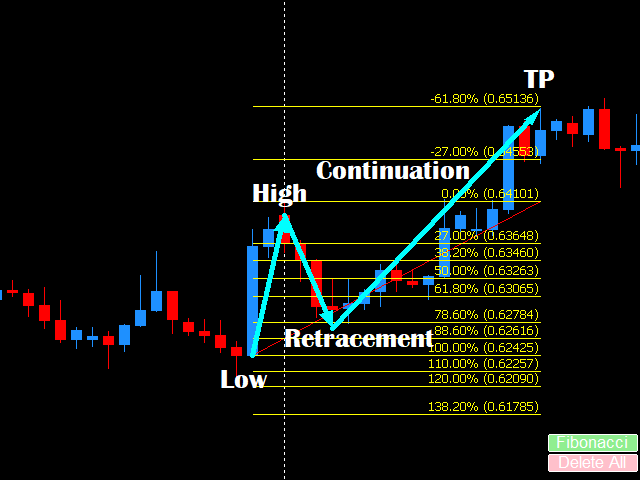
This dynamic indicator allows you to measure retracements of price between any two points in either direction. It displays the price points, percentages and also displays the extension levels.
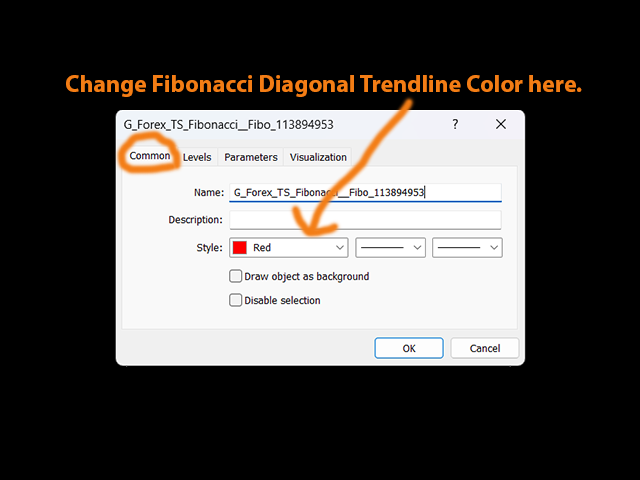
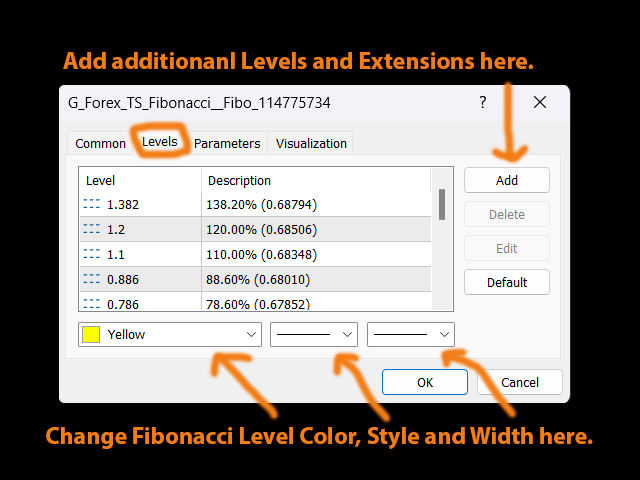
User may Modify and Add addition levels and extensions." User may also Add multiple Fibonacci indicators on the chart and change their colors, style and sizes.
Can be used on any timeframe.
This is the only Fibonacci Tool you'll need to measure and trade on Structure.
MT5 Version Available as well (below).
Complimentary MT4 Products you may also like available here:
ADR Reversal Indicator: https://www.mql5.com/en/market/product/94554
Key Swing Levels: Coming Soon!
AVAILABLE IN MT5 HERE:
Multiple Moving Average Crossover Alerts: https://www.mql5.com/en/market/product/94369
ADR Reversal Indicator: https://www.mql5.com/en/market/product/94148
Fibonacci Retracements and Extensions Tool: https://www.mql5.com/en/market/product/94303
Key Swing Levels: https://www.mql5.com/en/market/product/94545
Kullanıcı incelemeye herhangi bir yorum bırakmadı