• Genel bakış
  • İncelemeler
  • Yorumlar

Strategic scalping

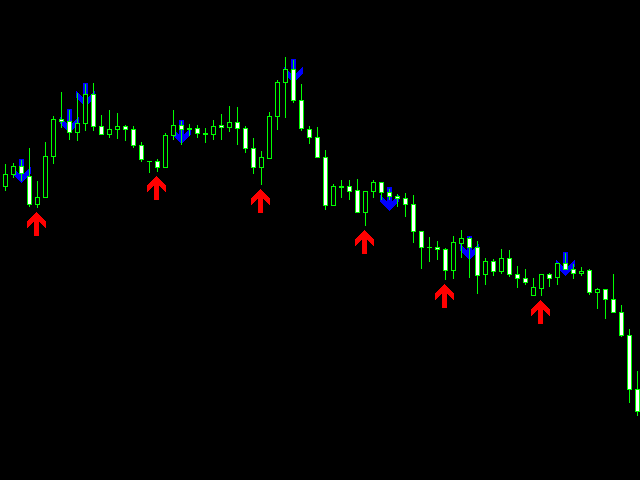
The "Strategic scalping" indicator displays possible trend reversal points on the chart. The indicator highlights two different pivot points: high points (pivot points from above) and low points (pivot points from below).
Upper pivot points are indicated by down arrows and appear on the chart when the price reaches a high and starts to fall. Pivot lows are indicated by arrows pointing up and appear on the chart when the price bottoms out and starts to rise.
The indicator can be useful for traders who are looking for entry and exit points in the market. It can help traders identify moments when price reaches extremes and signals a possible trend reversal.
The indicator can be configured for various time intervals and instruments. It can also be supplemented with other indicators and trading strategies for more accurate signals.
In addition, the indicator can be used in combination with other indicators and market analysis to improve trading efficiency. It can help traders see more profit opportunities in the market and avoid potential losses.

Indicator settings:
  • period_signal - indicator period.
  • UpperBorder - the upper border of the market overbought, for sell signals.
  • LowerBorder - the lower border of the market oversold, for buy signals.
  • width - the size of the arrows that the indicator draws on the chart.
Önerilen ürünler
Capital Pivot
Mr Nisit Noijeam
Pivot Points และระดับ (Support) และ(Resistance) บนแผนภูมิการเทรดใน MetaTrader 4 สำหรับตลาด Forex : คำนวณ Pivot Points : สคริปต์คำนวณจุด Pivot โดยใช้ข้อมูลราคาประวัติศาสตร์ เช่น ราคาเปิด, ราคาสูงสุด, ราคาต่ำสุด, และราคาปิด จากช่วงเวลาที่กำหนด (เช่น วัน, ชั่วโมง, ฯลฯ) จุด Pivot และระดับต่างๆ เช่น R1, R2, R3 (ระดับการต้านทาน) และ S1, S2, S3 (ระดับการสนับสนุน) ถูกคำนวณออกมา แสดงบนแผนภูมิ : หลังจากคำนวณจุด Pivot และระดับต่างๆ, สคริปต์จะแสดงเส้นเหล่านี้บนแผนภูมิ MT4 เพื่อช่วยให้นักเทรดสามารถเห็นจุดที่
This is a unique multi-currency trading strategy developed for trading on H1 timeframe, which allows you to determine the global market entry points and obtain the maximum profit for each transaction. The market entry point is calculated using a variety of author equations and algorithms. We recommend using the indicator simultaneously on several trading instruments . A huge advantage of Big Deals System is an information panel in which the user can see the current information on potential entry
FiboZag
Andriy Sydoruk
Indicator FiboZag - transfer the indicator to the chart and the Fibonacci levels will be built automatically on the last ZigZag turn. The main advantage lies in the correct construction of Fibonacci levels and markup of price levels. Simple, visual and effective use. The indicator is not redrawn and does not lag. Works on all currency pairs and on all timeframes.
KT Auto Trendline MT4
KEENBASE SOFTWARE SOLUTIONS
KT Auto Trendline draws the upper and lower trendlines automatically using the last two significant swing highs/lows. Trendline anchor points are found by plotting the ZigZag over X number of bars. Features No guesswork requires. It instantly draws the notable trendlines without any uncertainty. Each trendline is extended with its corresponding rays, which helps determine the area of breakout/reversal. It can draw two separate upper and lower trendlines simultaneously. It works on all timefr
Set TP and SL like Financial Institutions Traders' TP expectations do not often occur and their SL often hits when they only rely on primitive indicators like pivot-points and Fibonacci or classic support or resistance areas. There are a variety of indicators for support/resistance levels, whereas they are seldom accurate enough. Classical support/resistance indicators, often present miss levels and are not noteworthy based on current market volatility dynamic. Fibonacci is good but not enou
Pivot Points MT4
KEENBASE SOFTWARE SOLUTIONS
KT Pivot Points automatically plots the daily, weekly, and monthly pivot levels on a chart with the precise calculation based on the latest data. Pivot points is a widely used indicator in technical analysis, particularly in the Forex market. Features Send alerts when the price touches the pivot level.  It offers complete customization for each kind of pivot level.   Shows daily, weekly, and monthly pivot levels without any fuss. It uses minimum CPU resources for faster calculation. Compati
The Auto Super Pivot indicator is an indicator designed to calculate support points and resistance points for pivot points. this indicator has the ability to calculate standard pivot, fibonacci, camarilla, woodie and demark pivot points. It also allows you to use all time zones with the time frame feature. Another feature of the indicator is the auto time slice feature. This feature allows automatic calculations without having to set any time zone. Features 6 different pivot calculation modes
This support and resistance indicator gives u a)support level b)resistance level c)direction(trend) all in one.The indicator is based on the top 3 best levels there are!Red dots are sell direction and green dots are buy direction,if candles dont break these levels u get in after the 3rd dot,always use higher time frames from h1 up so its more clear where direction is going,also u can set the indicator to your time frame that u are lookin at.
This indicator is designed based on Mr.   WD   Gann's square of nine methods. Using this indicator, we can enter the desired   pivot   price and, based on the coefficient we assign to it, extract 8   support and resistance   numbers with 8 angles of 45, 90, 135, 180, 225, 270, 315, and 360. Calculates 8   support and resistance   points and draws   support and resistance   lines. The coefficient is to triple the number of executions. To select   pivot points   in which a price is a lar
Classic Fractals indicator for MT4, with additional Trendlines connecting the latest couples of fractals ( fractals are showing highest high, and lowest low on each period) Rules for trendlines: -if new top fractal is below the last one = new resistance line -if new bot fractal is above the last one = new support line -Trendlines can be hidden -Fractals can be hidden Fractal Period = can be both even or uneven number, as it is setting for half (one side) of the bars sequence
What are "pivot points"? Pivot point analysis is often used in conjunction with the calculation of support and resistance levels, as is the case with trend line analysis. Pivot point analysis calculates the first support and resistance levels using the trading range width between the pivot point and the previous day's high or low price. The second support and resistance levels are calculated using the entire width between the previous day's high and low prices. Looking for a quality pivot poi
TrendControl is an arrow indicator of technical analysis for determining a trend, which can adjust to the price, is a graphical plot calculated using mathematical formulas, the initial data for which is a price chart. The indicator shows the direction of the trend, takes into account the minimum and maximum values ​​of the extreme candles on the chart, then brings them to the average and compares them with the past data. The principle of operation of the indicator is to automatically determin
The new update makes this indicator a complete tool for studying, analyzing and operating probabilistic patterns. It includes: On-chart Multi-asset percentage monitor. Configurable martingales. Twenty-one pre-configured patterns , including Mhi patterns and C3. An advanced pattern editor to store up to 5 custom patterns. Backtest mode to test results with loss reports. Trend filter. Hit operational filter. Martingale Cycles option. Various types of strategies and alerts. Confluence between patte
Supply Demand Zone Pro Indicator works with all products and timeframes. It is using a new calculation method, and now you can select the desired zone on any timeframe! Strongest Zones are already enabled by default This is a great advantage in trading.This indicator has a built in backtester enabled by default, just move the chart. Supply and Demand ? Supply is a price zone where sellers outnumbered buyers and drove the price lower. Demand is a price zone where buyers outnumbers sellers and
VJ Pivot Levels
Vijayaratna Kumar Boda
4.4 (5)
Introduction: Whatever trading method you use, it is important to know the Pivot levels to take the key attention for your entries & exits. This indicator has been made using the standard classic formula for Auto drawing the Pivot levels. Also based on the previous day trading range, the probable expected today trading range has been highlighted in a different color for your reference. Output of the Indicator: This Indicator gives the Pivot level Different resistance Levels Different Support l
SuperRSI
Andriy Sydoruk
The SuperRSI indicator is an advanced index of internal strength. The indicator shows not the relative strength of the trading instruments being compared, but the internal strength of a single instrument, therefore, it is the “Internal Strength Index”. This is an advanced form of the SuperRSI indicator. It converts the signal so that low-frequency components are delayed much more than high-frequency components. In general, the data of the last bar have more weight than previous data, like an exp
Fibonacci Wave Bands Indicator The Fibonacci Wave Bands indicator utilizes Fibonacci ratios to create dynamic bands around a central moving average. These bands are derived from key Fibonacci ratios (typically 38.2%, 50%, 61.8%) and adapt to market volatility, offering insights into potential support and resistance zones. Key Features: Fibonacci Levels: The indicator plots multiple bands above and below a central moving average based on Fibonacci ratios. Dynamic Support and Resistance: Bands ser
Possible Price reversals levels - based on  Fibonacci + Support +  Resistance Levels Auto levels drawn based on input index (Bars Count )  ---->>> Price Over 50% Fibo line ---> UP TREND ---> BUY when price drop near Support Lines  ---->>> Price Down 50% Fibo line ---> DOWN TREND ---> SELL when price goes up  near Resistance Lines  --->>> The more close price levels ----> the more possibility for price reversals --->>> are you a scalper --> try it on M1 charts with big index like 5000 bars  or
This indicator watch the Fibonacci retracement for levels and timeframes selected by the trader. In the workload of day trading, having your eyes on all the timeframes to validate some information, for Fibonacci traders, is really time consuming and requires constant focus.  With this in mind, this tool allows you to have your attention on other trading details while this one monitors the retracements of each timeframe in real time. In the charts, this indicator data (retracement %, age of the r
ON Trade Pivoteer
Abdullah Alrai
4 (1)
Introducing the Pivot Point Selector Indicator: Your Ultimate Tool for Custom Pivot Levels Are you ready to take your trading to the next level? Say hello to the Pivot Point Selector Indicator, a game-changing tool that puts you in control of your pivot levels. This innovative indicator empowers you to choose three specific points that will determine the pivot level calculations, giving you unparalleled customization and precision in your trading strategy. Key Features and Benefits: Custom Pivo
FREE
Binary Options Support Resistance Indicator This indicator is designed for binary options trading and effectively shows retracements from support and resistance levels. Signals appear on the current candle. A red arrow pointing downwards indicates a potential selling opportunity, while a blue arrow pointing upwards suggests buying opportunities. All that needs adjustment is the color of the signal arrows. It is recommended to use it on the M1-M5 timeframes as signals are frequent on these timef
5TT Pivot Lines is a visual display of pivot lines. These are primarily support and resistance points with the 'Blue' Pivot Point. Pivot points are useful for determining key levels for entry or exits (setting targets and stop loss levels). Having these support & resistance lines visually displayed on the chart is very useful for intraday traders. 5TT Pivot Lines come with some user-friendly settings to decide if to display the lines or connectors on the chart Settings CandlesBack: This gives th
Pivots indicator
Mahmoud Helmy Sedik Mohamed Mansour
Pivots Points are price levels chartists can use to determine intraday support and resistance levels. Pivot Points use the previous days Open, High, and Low to calculate a Pivot Point for the current day. Using this Pivot Point as the base, three resistance and support levels are calculated and displayed above and below the Pivot Point.     and below the Pivot Point.
YK-Fibo Pivot Indicator: Trade Smarter with Fibonacci Pivot Points The YK-Fibo Pivot Indicator is a powerful technical analysis tool that combines the precision of Fibonacci retracements with the insights of Pivot Points. Whether you're a novice or seasoned trader, this indicator empowers you to spot profitable opportunities in the market with ease. Why Choose YK-Fibo Pivot? Pinpoint Support & Resistance: By calculating Fibonacci levels based on the previous day's high, low, and close prices, y
Night ghost
Dmitriy Kashevich
Night Ghost - İkili opsiyonlar için ok göstergesi. Bu, gelecekte sizin için güvenilir bir yardımcıdır! - Grafikte yeniden çizim yok -Tüm döviz çiftlerinde harika çalışıyor! -%90'a varan gösterge doğruluğu (Özellikle geceleri) -Uzun süre kurulum yapmaya gerek yok (İkili Opsiyonlar için mükemmel kurulum) - Geç olmayan sinyaller - Mevcut mum üzerinde bir sinyalin görünümü -M1 dönemi için mükemmel (Artık Yok!) - Göz dostu mum rengi (Kırmızı ve Mavi) -Yüklü Uyarı Onunla çalış
Trend Bilio - an arrow indicator without redrawing shows potential market entry points in the form of arrows of the corresponding color: upward red arrows suggest opening a buy, green down arrows - selling. The entrance is supposed to be at the next bar after the pointer. The arrow indicator Trend Bilio visually "unloads" the price chart and saves time for analysis: no signal - no deal, if an opposite signal appears, then the current deal should be closed. It is Trend Bilio that is considered
The indicator determines the state of the market: trend or flat. The state of the market is determined by taking into account volatility. The flat (trading corridor)is displayed in yellow. The green color shows the upward trend. The red color shows the downward trend. The height of the label corresponds to the volatility in the market. The indicator does not redraw . Settings History_Size   - the amount of history for calculation. Period_Candles  - the number of candles to calculate the
"Adjustable Fractals" - is an advanced version of fractal indicator, very useful trading tool! As we know   Standard fractals mt4 indicator does not have settings at all   - this is very inconvenient for traders Adjustable Fractals has resolved that issue - it has all necessary settings: Adjustable period   of indicator (recommended values - above 7) Adjustable distance   from Highs/Lows of price Adjustable design   af fractal arrows // More great Expert Advisors and Indicators are available he
AutoPivot
Hafis Mohamed Yacine
This indicator will draw monthly, weekly, and daily pivot. Pivot line will be calculated automatically again when the period ends. Auto Pivot Metatrader 4 Indicator The Auto Pivot indicator for Metatrader 4 automatically updates the pivot point (PP), support (S1,S2,S3) and resistance levels (r1,r2,r3) every day. Price above the pivot point means positive while price below the pivot point means negative. S3 indicates extremely oversold while price above resistance r3 means extremely overbought.
Technical Analysis 4 in 1 give you Pivot points, Resistances, Supports, Fibo, OHCL all together with any timeframe and you can back as you want in candles Pivot points have been a trading strategy for a long time. Using this method, you can understand where the market is going in a day through a few simple calculations. you can switch on/off any line you want. please check the pictures to understand more about this indicator.
Bu ürünün alıcıları ayrıca şunları da satın alıyor
Atomic Analyst
Issam Kassas
5 (3)
Öncelikle belirtmek gerekir ki bu Ticaret Göstergesi Yeniden Çizim Yapmaz, Gecikmez ve Gecikme Göstermez, bu da hem manuel hem de robot ticareti için ideal hale getirir. Kullanıcı kılavuzu: ayarlar, girişler ve strateji. Atom Analisti, Piyasada Daha İyi Bir Avantaj Bulmak İçin Fiyatın Gücünü ve Momentumunu Kullanan PA Fiyat Hareketi Göstergesidir. Gürültüleri ve Yanlış Sinyalleri Kaldırmaya ve Ticaret Potansiyelini Artırmaya Yardımcı Olan Gelişmiş Filtrelerle Donatılmıştır. Birden fazla katma
Scalper Inside PRO
Alexey Minkov
4.75 (59)
An exclusive indicator that utilizes an innovative algorithm to swiftly and accurately determine the market trend. The indicator automatically calculates opening, closing, and profit levels, providing detailed trading statistics. With these features, you can choose the most appropriate trading instrument for the current market conditions. Additionally, you can easily integrate your own arrow indicators into Scalper Inside Pro to quickly evaluate their statistics and profitability. Scalper Inside
TPSpro RFI Levels
Roman Podpora
4.86 (21)
Reversal First Impulse levels (RFI)    INSTRUCTIONS        RUS       -       ENG              R ecommended to use with an indicator   -   TPSpro  TREND PRO -  Version MT5 A key element in trading is zones or levels from which decisions to buy or sell a trading instrument are made. Despite attempts by major players to conceal their presence in the market, they inevitably leave traces. Our task was to learn how to identify these traces and interpret them correctly. Main functions: Displaying activ
FX Power MT4 NG
Daniel Stein
5 (12)
Sabah Brifingimiz burada mql5 ve on Telegram! FX Power MT4 NG , uzun zamandır çok popüler olan döviz gücü ölçerimiz FX Power'ın yeni neslidir. Peki bu yeni nesil güç ölçer ne sunuyor? Orijinal FX Power hakkında sevdiğiniz her şey PLUS GOLD/XAU güç analizi Daha da hassas hesaplama sonuçları Ayrı ayrı yapılandırılabilir analiz dönemleri Daha da iyi performans için özelleştirilebilir hesaplama limiti Özel çokluDaha fazlasını görmek isteyenler için örnek ayarlar Her grafikte en sevdiğiniz renkler i
Quantum Breakout Indicator PRO
Bogdan Ion Puscasu
4.96 (26)
Tanıtım       Quantum Breakout PRO   , Breakout Bölgeleri ile ticaret yapma şeklinizi değiştiren çığır açan MQL5 Göstergesi! 13 yılı aşkın ticaret deneyimine sahip deneyimli tüccarlardan oluşan bir ekip tarafından geliştirilen   Quantum Breakout PRO   , yenilikçi ve dinamik koparma bölgesi stratejisiyle ticaret yolculuğunuzu yeni zirvelere taşımak için tasarlanmıştır. Kuantum Breakout Göstergesi, size 5 kar hedefi bölgesi ile kırılma bölgelerinde sinyal okları ve kırılma kutusuna dayalı ol
ŞU ANDA %26 INDIRIMLI Yeni Başlayanlar veya Uzman Tüccarlar için En İyi Çözüm! Bu Gösterge benzersiz, yüksek kaliteli ve uygun fiyatlı bir ticaret aracıdır çünkü bir dizi tescilli özellik ve yeni bir formül ekledik. Sadece BİR grafik ile 28 Forex çifti için Döviz Gücünü okuyabilirsiniz! Yeni bir trendin veya scalping fırsatının tam tetik noktasını belirleyebildiğiniz için ticaretinizin nasıl gelişeceğini hayal edin? Kullanım kılavuzu: buraya tıklayın Bu ilk olan, orijinal! Değersiz bir
GOLD Impulse with Alert
Bernhard Schweigert
4.56 (9)
Bu gösterge, 2 ürünümüz Advanced Currency IMPULSE with ALERT  +   Currency Strength Exotics  'in süper bir kombinasyonudur. Tüm zaman dilimleri için çalışır ve 8 ana para birimi artı bir Sembol için grafiksel olarak güç veya zayıflık dürtüsünü gösterir! Bu Gösterge, Altın, Egzotik Çiftler, Emtialar, Endeksler veya Vadeli İşlemler gibi herhangi bir sembol için para birimi gücü ivmesini göstermek için uzmanlaşmıştır. Türünün ilk örneğidir, Altın, Gümüş, Petrol, DAX, US30, MXN, TRY, CNH vb.
TPSproTREND PrO
Roman Podpora
4.78 (18)
TPSpro TRENDPRO  - is a trend indicator that automatically analyzes the market and provides information about the trend and each of its changes, as well as giving signals for entering trades without redrawing! The indicator uses each candle, analyzing them separately. referring to different impulses - up or down impulse. Exact entry points into transactions for currencies, crypto, metals, stocks, indices!  -  Version MT5               DETAILED DESCRIPTION                R ecommended to use with
Advanced Supply Demand
Bernhard Schweigert
4.92 (313)
CURRENTLY 26% OFF !! Best Solution for any Newbie or Expert Trader! This indicator is a unique, high quality and affordable trading tool because we have incorporated a number of proprietary features and a new formula. With this update, you will be able to show double timeframe zones. You will not only be able to show a higher TF but to show both, the chart TF, PLUS the higher TF: SHOWING NESTED ZONES. All Supply Demand traders will love it. :) Important Information Revealed Maximize the potenti
Cycle Sniper
Elmira Memish
4.41 (37)
NEW YEAR SALE PRICE FOR LIMITED TIME!!! Please contact us after your purchase and we will send you the complimentary indicators to complete the system Cycle Sniper is not a holy grail but when you use it in a system which is explained in the videos, you will feel the difference. If you are not willing to focus on the charts designed with Cycle Sniper and other free tools we provide, we recommend not buying this indicator. We recommend watching the videos about the indiactor and system before pu
Şu anda %20 İNDİRİMLİ! Herhangi bir Acemi veya Uzman Tüccar için En İyi Çözüm! Bu gösterge paneli yazılımı 28 döviz çifti üzerinde çalışıyor. Ana göstergelerimizden 2'sine (Gelişmiş Para Birimi Gücü 28 ve Gelişmiş Para Birimi Dürtüsü) dayanmaktadır. Tüm Forex piyasasına harika bir genel bakış sağlar. Gelişmiş Para Birimi Gücü değerlerini, para birimi hareket hızını ve tüm (9) zaman dilimlerinde 28 Forex çifti için sinyalleri gösterir. Trendleri ve / veya scalping fırsatlarını belirlemek içi
RelicusRoad Pro
Relicus LLC
4.73 (140)
Şimdi 147 $ (birkaç güncellemeden sonra 499 $ 'a yükseliyor) - Sınırsız Hesaplar (PC'ler veya Mac'ler) RelicusRoad Kullanım Kılavuzu + Eğitim Videoları + Özel Discord Grubuna Erişim + VIP Durumu PİYASAYA BAKMAK İÇİN YENİ BİR YOL RelicusRoad, forex, vadeli işlemler, kripto para birimleri, hisse senetleri ve endeksler için dünyanın en güçlü ticaret göstergesidir ve yatırımcılara kârlı kalmaları için ihtiyaç duydukları tüm bilgileri ve araçları sağlar. Başlangıç ​​seviyesinden ileri seviyey
Indicator : RealValueIndicator Description : RealValueIndicator is a powerful tool designed specifically for trading on the EURUSD pair. This indicator analyzes all EUR and USD pairs, calculates their real currency strength values, and displays them as a single realistic value to give you a head start on price. This indicator will tell you moves before they happen if you use it right. RealValueIndicator allows you to get a quick and accurate overview of the EURUSD currency pair tops and bottoms,
ŞU ANDA %31 INDIRIMLI !!! Yeni Başlayanlar veya Uzman Tüccarlar için En İyi Çözüm! Bu gösterge benzersiz, yüksek kaliteli ve uygun fiyatlı bir ticaret aracıdır çünkü bir dizi tescilli özellik ve gizli bir formül ekledik. Yalnızca BİR grafikle 28 döviz çiftinin tümü için Uyarılar verir. Yeni bir trendin veya scalping fırsatının tam tetik noktasını belirleyebildiğiniz için ticaretinizin nasıl gelişeceğini hayal edin! Yeni temel algoritmalar üzerine inşa edilen bu sistem, potansiyel işlemler
Tanıtım       Kuantum Trend Keskin Nişancı Göstergesi   , trend tersine dönmeleri belirleme ve ticaret yapma şeklinizi değiştiren çığır açan MQL5 Göstergesi! 13 yılı aşkın ticaret tecrübesine sahip deneyimli tüccarlardan oluşan bir ekip tarafından geliştirilmiştir.       Kuantum Trend Keskin Nişancı Göstergesi       trend dönüşlerini son derece yüksek doğrulukla belirlemenin yenilikçi yolu ile ticaret yolculuğunuzu yeni zirvelere taşımak için tasarlanmıştır. ***Kuantum Trend Keskin Nişancı Gö
JULY OFFER 80% OFF next price for unlimited version will be 17000$. This is the only time you can get this institutional and professional indicator at this price for unlimited version. Don't dare to miss this. The tool I am about to introduce to you you can't compare it with other tools due to its strategy and accuracy level in predicting the next price directional movement . This tool is designed for serious traders who have decided to make a difference through trading. Be the next person to wi
TrendMaestro
Stefano Frisetti
5 (3)
note: this indicator is for METATRADER4, if you want the version for METATRADER5 this is the link:  https://www.mql5.com/it/market/product/108106 TRENDMAESTRO ver 2.4 TRENDMAESTRO recognizes a new TREND in the bud, he never makes mistakes. The certainty of identifying a new TREND is priceless. DESCRIPTION TRENDMAESTRO identifies a new TREND in the bud, this indicator examines the volatility, volumes and momentum to identify the moment in which there is an explosion of one or more of these data a
FX Volume
Daniel Stein
4.61 (36)
Sabah Brifingimiz aracılığıyla ayrıntılar ve ekran görüntüleri ile günlük piyasa güncellemenizi alın burada mql5 ve on Telegram ! FX Volume, bir brokerin bakış açısından piyasa duyarlılığı hakkında GERÇEK bir fikir veren İLK ve TEK hacim göstergesidir. COT raporlarından çok daha hızlı bir şekilde, brokerlar gibi kurumsal piyasa katılımcılarının Forex piyasasında nasıl konumlandıklarına dair harika bilgiler sağlar. Bu bilgileri doğrudan grafiğinizde görmek, ticaretiniz için gerçek oyun değiştir
Currency Strength Exotics
Bernhard Schweigert
4.88 (33)
ŞU ANDA %20 INDIRIMLI! Herhangi bir Acemi veya Uzman Tüccar için En İyi Çözüm! Bu Gösterge, Egzotik Çiftler Emtialar, Endeksler veya Vadeli İşlemler gibi herhangi bir sembol için para birimi gücünü göstermek için uzmanlaşmıştır. Türünün ilk örneğidir, Altın, Gümüş, Petrol, DAX, US30, MXN, TRY, CNH vb. gerçek para birimi gücünü göstermek için 9. satıra herhangi bir sembol eklenebilir. Bu benzersiz, yüksek kaliteli ve uygun fiyatlı bir ticaret aracıdır çünkü bir dizi tescilli özelliği ve yeni
Entry Points Pro
Yury Orlov
4.7 (226)
Yeniden boyamadan bir ticarete girmek için doğru sinyaller sağlayan MT5 için en iyi gösterge! Herhangi bir finansal varlığa uygulanabilir: forex, kripto para birimleri, metaller, hisse senetleri, endeksler. MT5 versiyonu burada Oldukça doğru alım satım sinyalleri sağlayacak ve bir alım satımı açıp kapatmanın en iyi zamanını size söyleyecektir. Göstergeyi ödeyen yalnızca bir sinyali işleme örneğiyle videoyu (6:22) izleyin! Çoğu tüccar, Giriş Noktaları Pro göstergesinin yardımıyla ilk işl
AT Forex Indicator MT4
Marzena Maria Szmit
5 (2)
The AT Forex Indicator MT4 is a sophisticated trading tool designed to provide traders with a comprehensive analysis of multiple currency pairs. This   powerful indicator   simplifies the complex nature of the forex market, making it accessible for both novice and experienced traders. AT Forex Indicator uses   advanced algorithms   to detect trends, patterns and is an essential tool for traders aiming to enhance their forex trading performance. With its robust features, ease of use, and reliabl
NAM Order Blocks
NAM TECH GROUP, CORP.
5 (1)
MT4 Multi-timeframe Order Blocks detection indicator. Features - Fully customizable on chart control panel, provides complete interaction. - Hide and show control panel wherever you want. - Detect OBs on multiple timeframes. - Select OBs quantity to display. - Different OBs user interface. - Different filters on OBs. - OB proximity alert. - ADR High and Low lines. - Notification service (Screen alerts | Push notifications). Summary Order block is a market behavior that indicates order collection
MTF Supply Demand Zones
Georgios Kalomoiropoulos
4.83 (23)
Yeni Nesil Otomatik Arz ve Talep Bölgeleri. Her Grafikte Çalışan Yeni ve Yenilikçi Algoritma. Tüm Bölgeler Piyasanın Fiyat Hareketine Göre Dinamik Olarak Oluşturulmaktadır. İKİ TÜR UYARI --> 1) FİYAT BİR BÖLGEYE ÇIKTIĞINDA 2) YENİ BİR BÖLGE OLUŞTURDUĞUNDA Bir tane daha işe yaramaz gösterge almazsın. Kanıtlanmış Sonuçlarla eksiksiz bir Ticaret Stratejisi elde edersiniz.     Yeni özellikler:     Fiyat Arz/Talep Bölgesine ulaştığında uyarılar     Yeni bir Arz/Talep Bölgesi olu
ZeusArrow Smart Liquidity Finder  Smart Liquidity Finder is Ai controlled indicator based on the Idea of Your SL is My Entry. It scan and draws the major Liquidity areas on chart partitioning them with Premium and Discount Zone and allows you find the best possible trading setups and help you decide the perfect entry price to avoid getting your Stop Loss hunted . Now no more confusion about when to enter and where to enter. Benefit from this one of it's kind trading tool powered by Ai an trade
Welcome to the world of SMC (Smart Money Concepts) Trading, where we empower traders with the tools and knowledge to make smarter trading decisions. Our latest addition to our suite of trading tools is the SMC Trading Pro indicator, version 1.0. Key Features: Major Market Structure Identification with BODY break. Order Block must be in Major Swing ( not Small Swing ). Order Block with Fair Value Gap Detection. Order Block in Discount | Premium zone. Filter for only Bullish, Bearish or All Order
Reversal Master
Alexey Minkov
4.92 (12)
The Reversal Master is an indicator for determining the current direction of price movement and reversal points. The indicator will be useful for those who want to see the current market situation better. The indicator can be used as an add-on for ready-made trading systems, or as an independent tool, or to develop your own trading systems. The Reversal Master indicator, to determine the reversal points,  analyzes a lot of conditions since the combined analysis gives a more accurate picture of t
ŞU ANDA %26 INDIRIMLI !!! Bu gösterge, her iki ana göstergemizin ( Advanced Currency Strength 28  &   Advanced Currency IMPULSE with ALERT )  süper bir kombinasyonudur. TICK-UNITS için Para Birimi Gücü değerlerini ve 28 Forex çifti için uyarı sinyallerini gösterir. 11 farklı Tick-Unit kullanılabilir. Bunlar 1, 2, 3, 4, 5, 6, 10, 12, 15, 20 ve 30 Saniyedir. Alt penceredeki Tick-Unit çubuğu, saniyenin zamanlayıcısı içinde en az 1 tik olduğunda gösterilecek ve sola kaydırılacaktır.  Yalnızca B
This indicator uses support and resistance, volume and some special formula to calculate the volume to filter the candles. If the volume reaches a specific value, And at the same time, Candle breaks the support/resistance line, There would be a signal and we can enter the market. Signals appear when the current candle closes. then you can enter the trade when a new candle appears. Please don't forget to follow your money management plan. MT5 Version Support/Resistance Breakout MT5 :   https:
Bu gösterge paneli, seçilen semboller için mevcut en son harmonik kalıpları gösterir, böylece zamandan tasarruf edersiniz ve daha verimli olursunuz / MT5 sürümü . Ücretsiz Gösterge: Basic Harmonic Pattern Gösterge sütunları Symbol : seçilen semboller görünecektir Trend: yükseliş veya düşüş Pattern : desen türü (gartley, kelebek, yarasa, yengeç, köpekbalığı, cypher veya ABCD) Entry : giriş fiyatı SL: zararı durdur fiyatı TP1: 1. kar alma fiyatı TP2: 2. kar alma fiyatı TP3: 3. kar alma fiya
Break and Retest
Mohamed Hassan
4.4 (15)
Biggest V.7 update for Break and Retest since the official release! ️ V.7 UPDATE includes the following: Multi Symbol Screener Panel where you can automatically add any symbol you want. Each symbol is clickable to automatically switch between them! Multi Timeframe Screener Panel where you can automatically scan all the timeframes for the selected symbols! Timeframe Screener is clickable for on/off! This means that you can open only 1 chart and let the indicator scan for sig
Yazarın diğer ürünleri
Market Scanner Elite is a new generation of indicators of the Market Scanner series. The Elite version features an improved market analysis algorithm, with a better identification of the entry points and filtering of the false signals. The logic of market analysis and calculation of effective entry points applied in this product are significantly different from those applied in Market Scanner . This indicator cannot be called a big brother, as it is a completely new product with innovative analy
FREE
XPointer
Andrey Kozak
5 (3)
XPointer is a completely ready trading system. It shows the trader when to open and close a trade. It works on all currency pairs and all time frames. Very easy to use and does not require additional indicators for its operation. Even a beginner trader can start working with XPointer. But it will also be useful for professional traders to confirm the opening of orders. Features of the XPointer indicator It does not redraw its values. It works on all currency pairs and all time frames. It has a
Forex Gump Pro
Andrey Kozak
3.67 (6)
Attention! Friends, since there have been many scammers on the Internet recently selling indicators called ForexGump, we decided to warn you that only on our page is the LICENSE AUTHOR'S VERSION of the INDICATOR sold! We do not sell this indicator on other sites at a price lower than this! All indicators are sold cheaper - fakes! And even more often sold demo versions that stop working in a week! Therefore, in order not to risk your money, buy this indicator only on this site! Forex Gump Pro i
Scalper Zoom is a new trading system designed to facilitate the process of Forex trading both for beginners and professionals. The Scalper Zoom indicator uses an adaptive method of operation and analyzes the market using multiple trading algorithms, while selecting the most efficient one for the given currency pair and timeframe. Working with this indicator is very simple. When a red vertical line appears, open a sell order. Close it when a blue vertical line appears. Follow the opposite steps f
Attention! Friends, since there have been many scammers on the Internet recently selling indicators called ForexGump, we decided to warn you that only on our page is the LICENSE AUTHOR'S VERSION of the INDICATOR sold! We do not sell this indicator on other sites at a price lower than this! All indicators are sold cheaper - fakes! And even more often sold demo versions that stop working in a week! Therefore, in order not to risk your money, buy this indicator only on this site! Forex Gump Scalpin
Forex Gump
Andrey Kozak
2.83 (6)
Forex Gump is a fully finished semi-automatic trading system. In the form of arrows, signals are displayed on the screen for opening and closing deals. All you need is to follow the instructions of the indicator. When the indicator shows a blue arrow, you need to open a buy order. When the indicator shows a red arrow, you need to open a sell order. Close orders when the indicator draws a yellow cross. In order to get the most effective result, we recommend using the timeframes H1, H4, D1. There
The Quantum Expert Advisor is designed for trading EURUSD H1 . The trading algorithm lies in placing pending orders at the peaks of currency fluctuations, after a preliminary analysis of the market conditions. Trading is fully automated. Lot size is calculated automatically based on the lot percentage. Parameters MaxRisk - percentage of the deposit, used for the automatic calculation of the lot. LongWave - long wave of price fluctuation. ShortWave - short wave of price fluctuation. Level contr
XL Arrow is a signal indicator that displays market entry points. The red arrow and the DOWN signal at the right corner indicate it is time to sell, while the blue arrow and the UP signal indicate it is time to buy. Settings PeriodSlower - indicator slowing period. PeriodFaster - indicator acceleration period. Recommendations trading pairs: EURUSD, GBPUSD and USDJPY timeframes: M5 - H4
The BoxetFx Expert Advisor analyzes the market using multiple trading strategies. Once the optimal signals for opening trades are obtained, the EA automatically determines the order volume as a percentage pf the deposit. Next, a pending order is placed in the direction of the expected price movement. When the deal reaches an optimal profit or loss level, it is automatically closed. Multiple analytical centers of information processing allow the EA to diversify the possible risks of the trader by
Medok
Andrey Kozak
The Medok indicator shows the market entry and exit points on the chart using arrows and resistance lines. The indicator is very easy to use. Buy when a blue arrow appears and sell when a red arrow appears. After an order is opened, it is recommended to close a buy position when the price reaches the lower resistance level or to close a sell position when the price reaches the upper resistance level. Recommended values for EURUSD H1 Periods - 2; Acceleration - 0.02. Recommended values for EU
TOP Xios is a ready-made trading system, which provides the trader with signals for opening and closing deals. The information panel in the right corner of the screen shows the total number of signals, the number of points in profit or loss and the percentage of valid and false signals. Working with this indicator is very simple. As soon as a blue arrow appears, open a buy deal and wait for a red cross to appear, which indicates the necessity to close the deal. When a red arrow appears, open a s
Buy Market Scanner is a ready-made trading system, which shows the moments when it is necessary to open or close deals. Buy arrows appear on the zero bar without delay and redrawing. The same applies to signals for closing orders. They appear on the zero bar and are not redrawn. The number of profit or loss in points for a certain time period is displayed in the top right corner of the indicator. The indicator works best on the EURUSD currency pair with the H1 timeframe. Operation Principles I
DayWay
Andrey Kozak
The DayWay indicator shows the current trend direction on the chart as a colored line. The best timeframes for operation are M5 and higher. Works on all currency pairs. Suitable for any scalping strategies. Quite easy to use. Recommendations on usage When a blue line appears, wait for a candle to close and open a buy order. When a red line appears, wait for the current candle to close and open a sell order. Parameters Periods - period of the indicator.
Leo Trend is a signal indicator that shows the market entry points, as well as the trend direction and flat on the chart in the form of arrows and lines. Leo Trend will be useful both for beginners creating a trading strategy, and for professionals to integrate into ready-made trading systems. Leo Trend works without redrawing and without significant delays. The operation of the indicator is demonstrated in the video. In addition, you can test this indicator in the strategy tester free of charge
Nizma
Andrey Kozak
NIZMA is a ready-made trading system, that is the most efficient on the EURUSD, AUDUSD and GBPUSD currency pairs. The best timeframes are M5 and higher. The system shows the market entry points in the form of arrows, and also displays the information on the strength and direction of the trend. The signals are easy to interpret. It is suitable for both novice and professional traders. With the properly selected settings, it gives the minimum number of false signals. In tests, this number did not
Lobster
Andrey Kozak
Lobster is a ready-made trading system with a flexible market analysis algorithm. It performs most of the work for a trader. All you have to do is open and close orders following the indicator signals. The indicator will be very useful for both beginners and professionals. It is able to work with other indicators and independently. Features No signal repainting; Any pair; Any timeframe; Flexible market analysis system. How to trade When the blue arrow appears, open a buy order; When the blue
Gets
Andrey Kozak
Gets is a smart trading system with complex market analysis mechanism. The operation principle of Gets is based on neural networks and diversified collection of information from various market analyzers. Then the system analyzes the statistical databases to create a general idea of the current market situation and the further price movement. The information is displayed on the screen in a simple and intuitive way - in the form of buy and sell arrows. Also, the information on the current trend st
Brabux
Andrey Kozak
Brabux is a ready-made mechanical trading system. It works on all currency pairs and timeframes automatically adjusting to them. It also selects the most efficient trading parameters for receiving a necessary profit. In the indicator parameters, specify the trading period used for calculations and the least acceptable profit in points. Next, the system automatically selects the necessary trading parameters. Trading data is displayed on the info panel. After setting the indicator on the chart and
CoolLine is a signal indicator displaying on a chart points for opening and closing trade positions. The indicator signals are not redrawn. It draws arrows on the zero bar Open[0]. It works on all currency pairs and all time frames. Indicator Advantages Precisely shows the opening and closing points on the chart Does not redraw signals Works on all currency pairs and timeframes Very easy to use; suitable even for beginners Has a very flexible system of settings Can send push and email notifica
The Master Figures indicator analyzed the market for the most common chart patterns. The first pattern is called Pin bar . This pattern can rightly be considered one of the most widespread. This pattern looks like a candle with a small body and large tail (wick). Once you see it on the chart, open a position against the wick. It is better to use the resistance lines for closing. Master Figures shows this pattern in the form of circles. A position should be opened when a new candle appears after
Market Trend - a comprehensive system for determining the trend direction. Analyzes the market using a formula which considers the values of multiple technical indicators and other trading strategies. IT determines not only the current trend direction, but also its movement strength. The indicator is intuitive and very easy to use. The information on the current trend direction and its movement strength are displayed on the chart. If the indicator shows "UP!" then an uptrend is currently present
Aggressive intraday scalper is a mechanical system for intraday scalping, which displays trade opening and closing signals as arrows on the chart. When a signal emerges, the indicator sends email and push notifications. So, you don't have to stay by the monitor analyzing the market and waiting for a signal. Aggressive intraday scalper will do it for you. The system has been developed for those traders who do not have their own trading system and who would love to quickly start trading using the
Jerus Line Scalper is an indicator for scalping on EURUSD, GBPUSD, AUDUSD, USDJPY and USDCAD pairs. Recommended pairs: M5, M15, M30 and H1. The trading strategy is as follows: as soon as the arrow appears, open an order in the direction of the arrow and set take profit to +10 points. Set stop loss at the indicator's stop line. Stop line is displayed in red or blue depending on the indicator signal. Also, the Martingale system can be applied in the system. If a trade is closed at a loss, the next
DotaScalping is a semi-automated trading system for scalping. The indicator shows recommended moments for opening Buy/Sell trades as dots on the chart. Signals are generated based on the algorithm for price amplitude smoothing. The indicator tries to accurately calculate the moments of the maximum peak price values ​​and produces signals based on the smoothed correlation. The indicator determines the High and Low price values and generates signals based on the trend direction. The indicator is v
ForexGumpUltra
Andrey Kozak
3.25 (4)
ForexGumpUltra is a new and more advanced indicator of the ForexGump series. This indicator easily determines the price direction on any currency pair and any timeframe. The indicator draws its signals on the zero bar and does not redraw them (see the video). In the 34th second of the video it can be seen that this indicator uses new filters to determine the changes in price movement direction without delay, despite the market noise present at the moment (see the video on the 34th second). Once
Bomb Scalper is a ready-made mechanical trading system that analyzes the market using 12 market signals, as well as candle patterns, providing signals for opening and closing trades. On the screenshot below, you can see how the system draws the blue arrow for buying and the red one for selling. Order close signal is shown as the yellow arrow. Besides, during a closing signal, the indicator calculates potential profit/loss. How the indicator works After launching, Bomb Scalper navigates through
Stiker is a robot capable of trading in automatic or semi-automatic mode . If auto=true in the robot settings, the robot automatically opens and closes orders on its own when a signal appears. If auto=false, the robot analyzes the market and shows signals on the screen, while a trader manually confirms opening or closing orders by clicking the Open Buy and Close Order buttons. This is done to enable traders make trading decisions themselves. This reduces the trading risk. Striker is a smart syst
If you do not yet have your trading strategy, you can take advantage of our ready-made trading strategy, which is most effective for EURUSD H1 currency pair. The indicator "Ready Made Scalping System" automatically analyzes the market and shows the trader when to open and close orders. You just need to follow his instructions. When the arrow appears - open the order, when a square appears with a tick - close the warrant. For convenience of the trader, the indicator when signals appear sends a
Amok is a fully automatic trading system that was developed for trading on the EURUSD currency pair, H1 timeframe on micro accounts. Nevertheless, as practice shows, this trading system works well in other currency pairs. Principle of work of the trading robot Amok In the algorithm of the robot, there are more than 7 different trading strategies. This was done to ensure that the robot could work more stably in different market conditions. The program part of the robot uses 12 different indicat
ForexGumpXL
Andrey Kozak
4.5 (2)
ForexGumpXL is a new generation in the forex gump indicator line. More accurate, faster, less complicated in the settings is all about the new ForexGumpXL indicator. In the new version of the indicator, we have applied a truly new algorithm of work. Now he does not just analyze the market for a price reversal, but with the help of an adaptation algorithm, determining the current volatility in the market indicator with a high degree of probability is able to anticipate false price reversals in or
Filtrele:
İnceleme yok
İncelemeye yanıt