ZigZag with Extras for MT5
- Göstergeler
- Fernando Carreiro
- Sürüm: 2.0
- Etkinleştirmeler: 20
(Google Çevirisi)
Bu gösterge, MetaTrader yüklemeleriyle birlikte kaynak kodu örneği olarak sağlanan orijinal ZigZag'a dayalıdır.
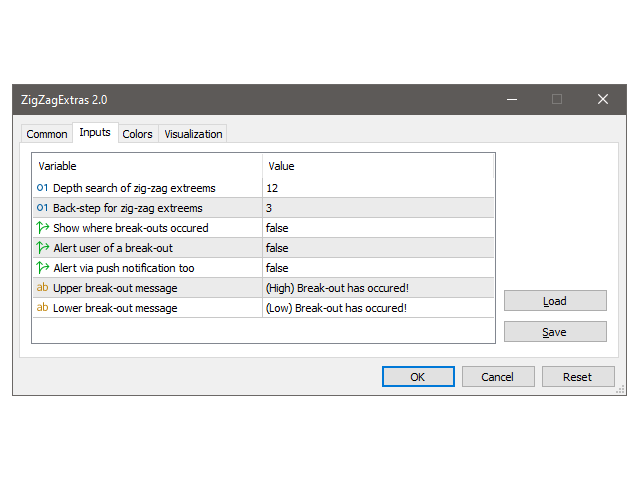
"Derinlik" kanalını ve ilgili kırılmaları görüntülemek için bazı ekstra özellikler ekleyerek yeniden yazdım. Ayrıca önceki zikzak noktalarını gözlemlemenizi sağlar.
Opsiyonel olarak, arızalar meydana geldiğinde kullanıcıyı uyarabilir. Uyarılar, kendi özel metninizle yalnızca terminalde veya bir mobil cihazdaki push bildirimleri aracılığıyla olabilir.
(Original text)
This indicator is based on the original ZigZag provided as a source code example with MetaTrader installations.
I rewrote it with some extra features for displaying the “depth” channel and the respective break-outs. It also allows one to observe prior zig-zag points.
Optionally, it can alert the user when break-outs occur. The alerts can be simply on the terminal or also via push notifications on a mobile device, with your own custom text.
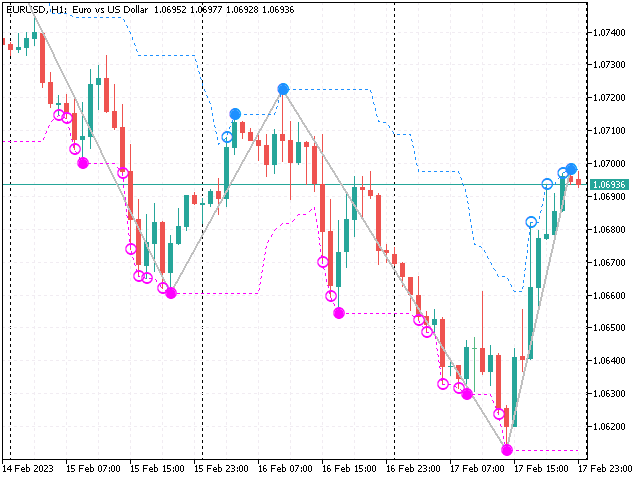


This was fun to run in the strategy tester. I would actually say that this could be one of the strongest signal indicators out there. The zig zag alone famously repaints, but this version may actually alert you at the point of divergence along with a useful trailing stop/trend line