MP Colored MACD
- Göstergeler
- Pierre Ksachikian
- Sürüm: 1.0
- Etkinleştirmeler: 6
History
- Gerald Appel created the MACD line in the late 1970s.
- Thomas Aspray added the histogram feature to Appel's MACD in 1986.
The three major components and their formula
1. The MACD line:
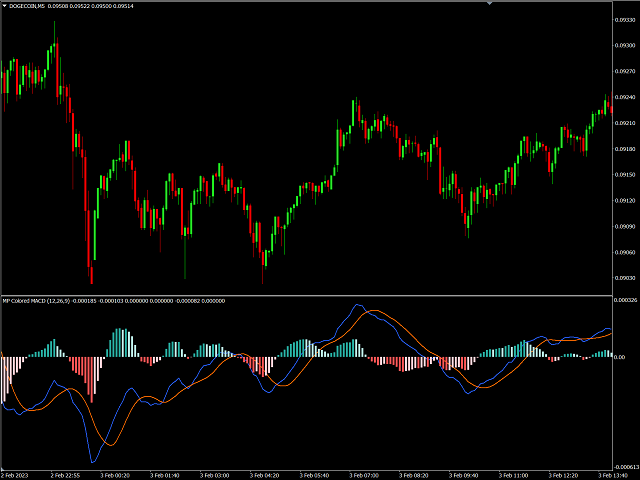
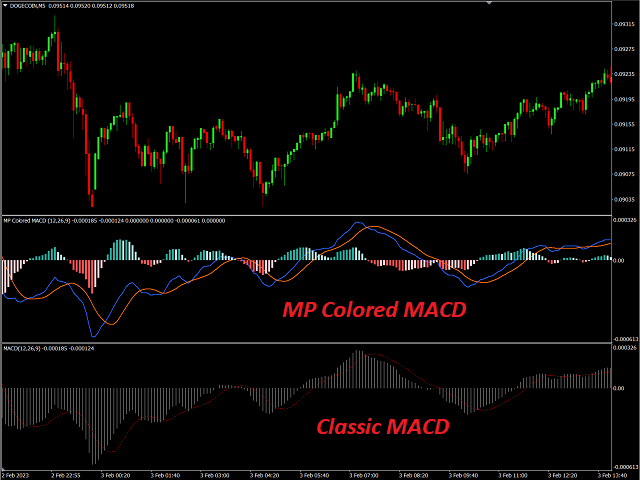
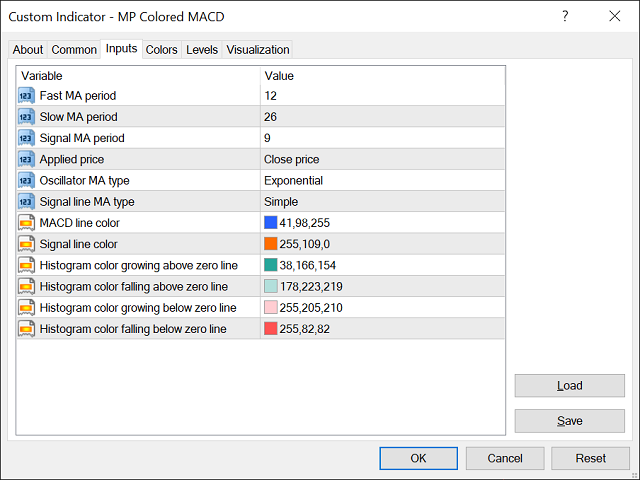
First, "PM Colored MACD" employs two Moving Averages with varying lengths of usually the close prices (which are lagging indicators) to identify trend direction and duration. The most commonly used values are 26 periods for the longer term MA and 12 periods for the shorter term MA, but it is the trader's choice. Then, PM Colored MACD takes the difference in values between those two Moving Averages. This line is used to identify trend direction and duration.
MACD = Fast MA - Slow MA
2. The Signal line:
The Signal Line is a Moving Average of the MACD Line. Although 9 is the most common period length for this MA but it can be chosen by trader.
Signal Line = MA of MACD Line
3. The histogram:
The difference between the MACD Line and Signal Line is plotted as a histogram which oscillates above and below a center Zero Line. The histogram is used as a good indication of a security's momentum.
Histogram = MACD line - Signal line
Download Impulse MACD, an enhanced version of Colored MACD here.
Trading interpretation:
In general, when MACD is positive and the histogram value is increasing, then upside momentum is increasing. When MACD is negative and the histogram value is decreasing, then downside momentum is increasing.
Signal line crossover:
A "Signal line crossover" occurs when the MACD and Signal lines cross. When the MACD line crosses up through the Signal line (a "bullish" crossover) it is a recommendation to buy , or to sell if it crosses down through the Signal line (a "bearish" crossover).
Zero crossover:
A "zero crossover" event occurs when the MACD series changes sign, that is, the MACD line crosses the horizontal zero axis. A change from positive to negative MACD is interpreted as "bearish", and from negative to positive as "bullish". Zero crossovers provide evidence of a change in the direction of a trend but less confirmation of its momentum than a signal line crossover.
Divergence:
A "positive divergence" or "bullish divergence" occurs when the price makes a new lower low but the MACD does not confirm it and records a higher low. A "negative divergence" or "bearish divergence" occurs when the price makes a new higher high but the MACD records a lower high.
#Tags: MACD, MACD, Moving Average Convergence Divergence, Colored MACD, Extended MACD, Multicolor MACD, MultiColored MACD, Multi-color MACD, Multi-Colored MACD, Two line MACD, Extended MultiColored MACD, Advanced MACD, Enhanced MACD, Signal, Momentum Indicator, Momentum
___________________________________________________________________________________
Disclaimer:
Do NOT trade or invest based upon the analysis presented on this channel. Always do your own research and due diligence before investing or trading. I’ll never tell you what to do with your capital, trades or investments. I’ll also never recommend for you to buy, sell, long or short any asset, commodity, security, derivative or cryptocurrency related instrument as it's extremely HIGH RISK! You should always consult with a professional/licensed financial adviser before trading or investing in any type of assets.


Kullanıcı incelemeye herhangi bir yorum bırakmadı