• Genel bakış
  • İncelemeler (2)
  • Yorumlar (16)
  • Yenilikler

Inside Bar Dashboard

5
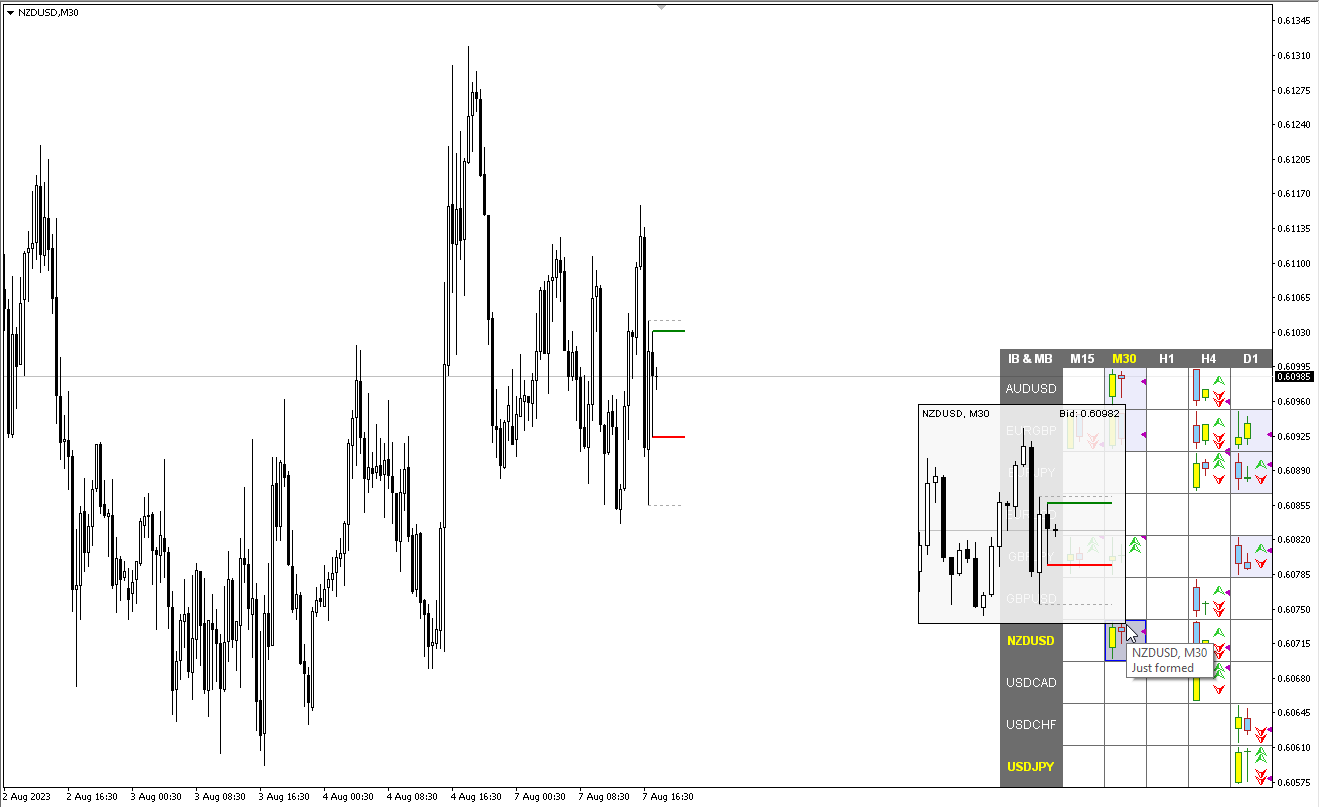
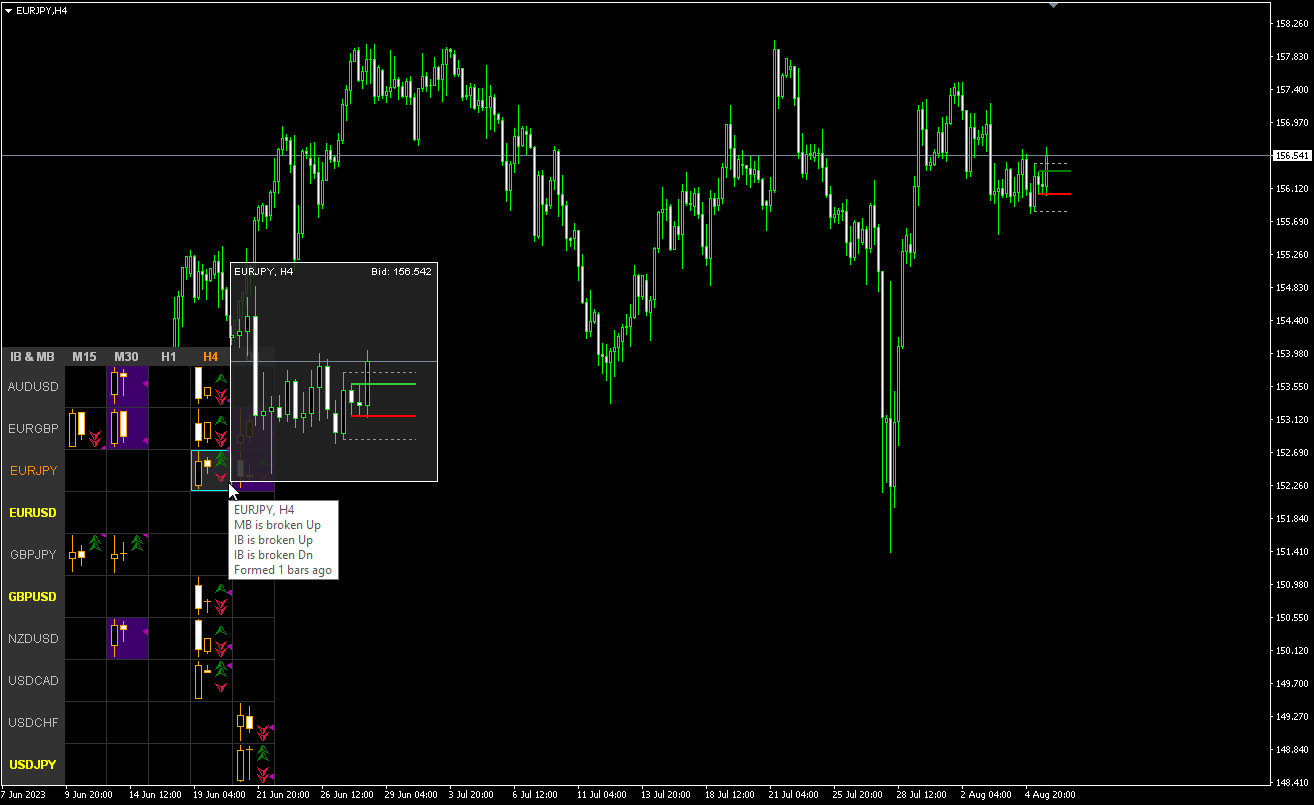
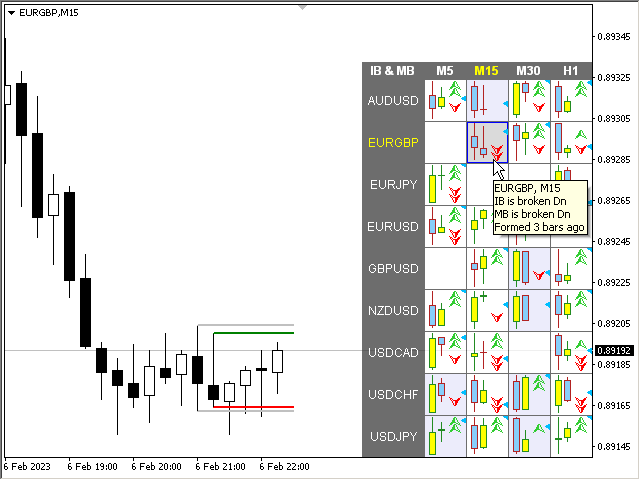
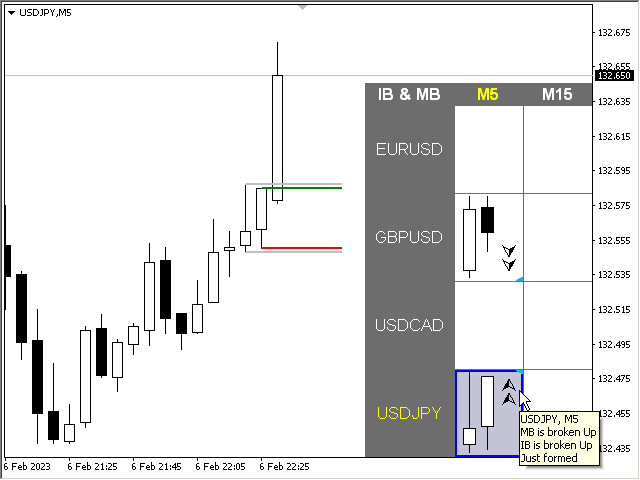
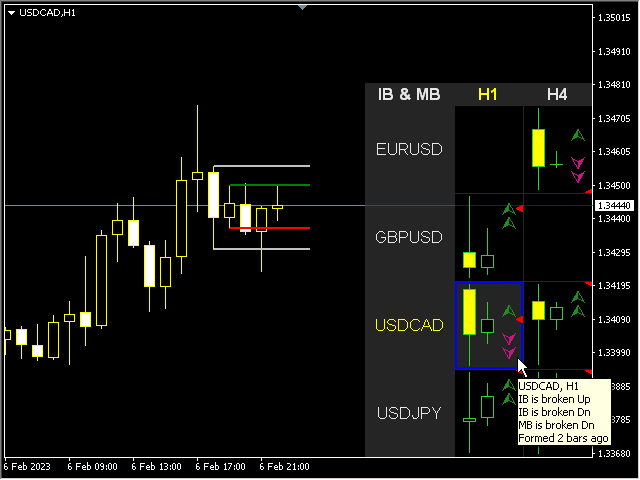
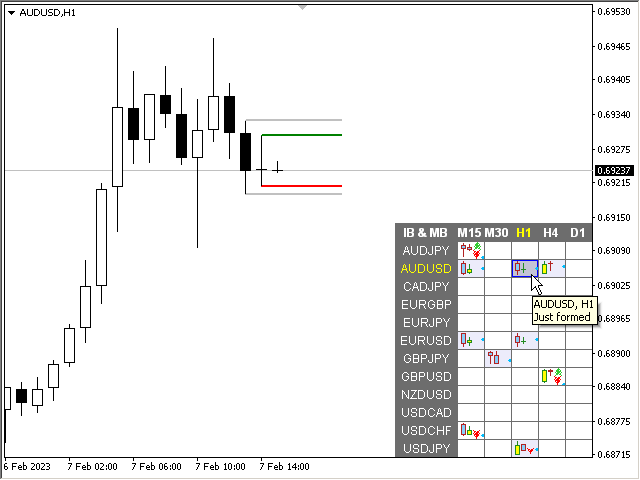
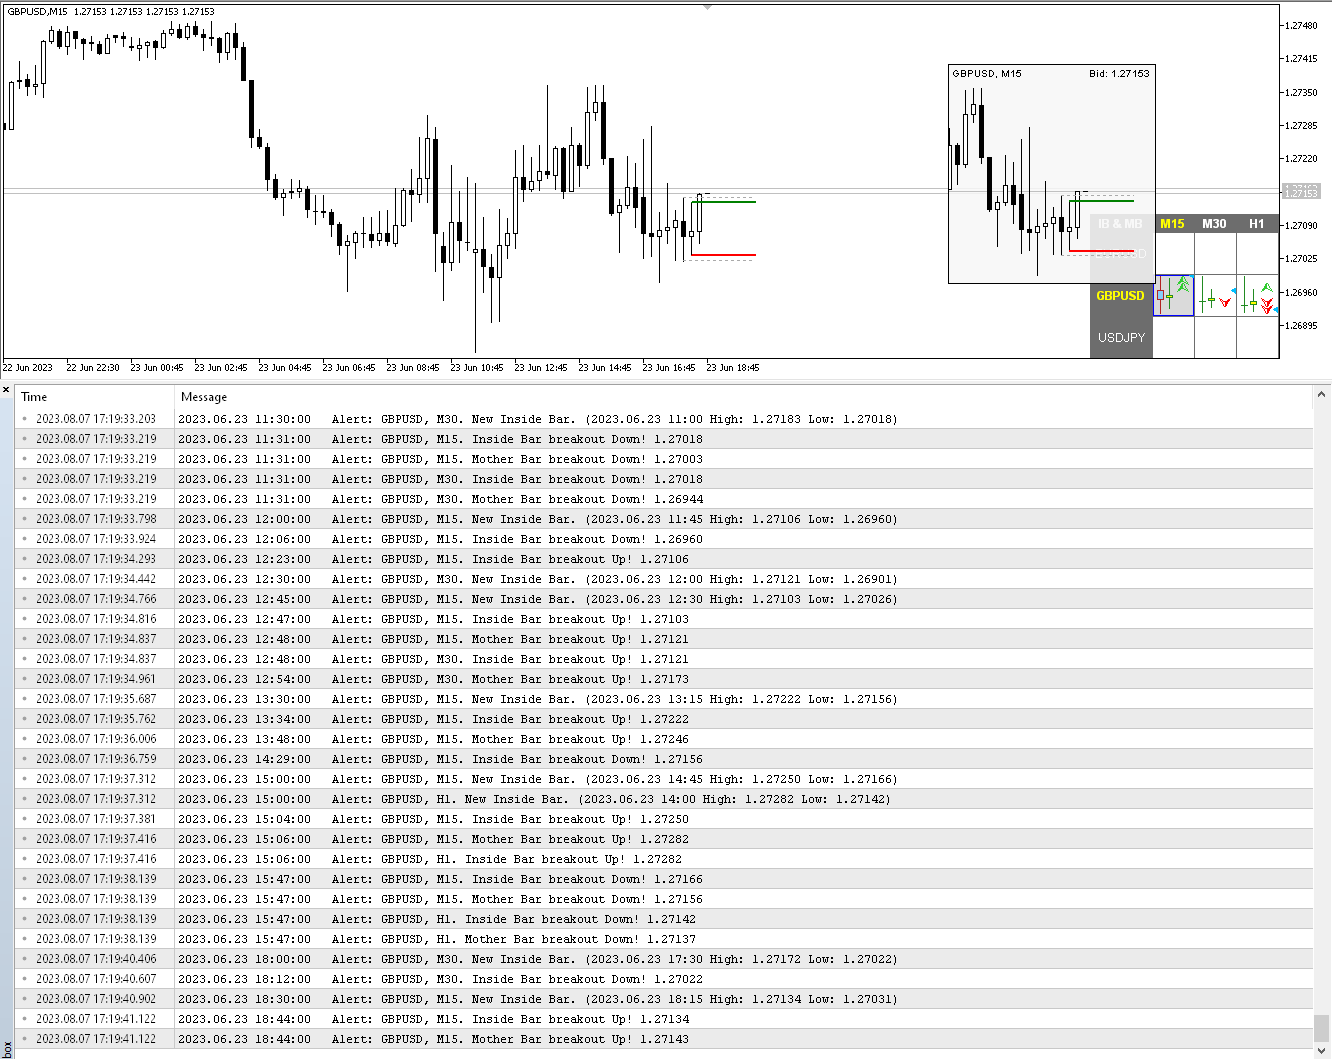
Çoklu para birimi ve çoklu zaman dilimi göstergesi Inside Bar (IB). Parametrelerde istediğiniz para birimini ve zaman dilimini belirtebilirsiniz. Panel, en son bulunan İç Çubuk (ve Ana Çubuk) formasyonunu, mevcut fiyat pozisyonunu ve Ana ve İç Çubuk seviyelerinin kırılmasını görüntüler. Hücrelerdeki çubukların ve metnin boyutunu ve rengini ayarlayabilirsiniz. Gösterge aynı zamanda seviyeler kırıldığında da bildirim gönderebiliyor. Noktalı bir hücreye tıkladığınızda belirtilen sembol ve nokta açılacaktır. Bu MTF Tarayıcıdır.

Kontrol panelini grafikten gizlemenin anahtarı varsayılan olarak "D"dir.


Parametreler

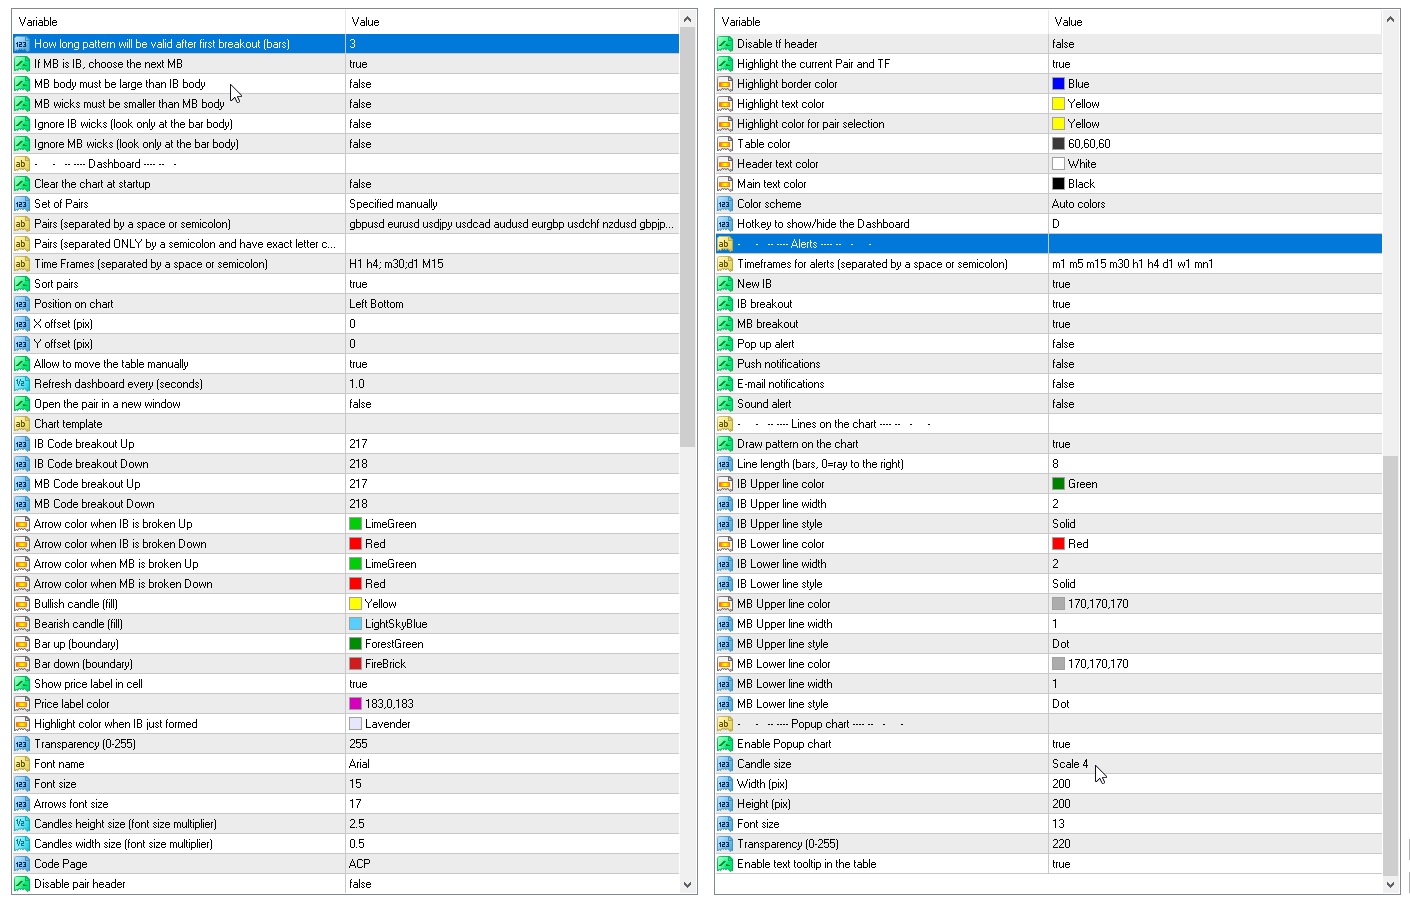
  • How long pattern will be valid after first breakout (bars) — sinyalin bir hücrede kaç çubuk gösterileceği.
  • IB body must be inside of the MB body - IB gövdesi MB gövdesinin içinde olmalıdır.
  • IB body and wicks must be inside the MB body - IB gövdesi ve fitilleri MB gövdesinin içinde olmalıdır.
  • If MB is IB, choose the next MB — MB IB ise sonraki MB'yi seçin; bulunan Ana Çubuk önceki sinyalin İç Çubuğu ise, önceki sinyal görüntülenecektir.
  • MB body must be large than IB body - MB gövdesi IB gövdesinden büyük olmalıdır
  • MB wicks must be smaller than MB body - MB fitilleri MB gövdesinden daha küçük olmalıdır
  • Ignore IB wicks (look only at the bar body) - IB fitillerini göz ardı edin (yalnızca çubuk gövdesine bakın)
  • Ignore MB wicks (look only at the bar body) - MB fitillerini dikkate almayın (yalnızca çubuk gövdesine bakın)
Gösterge Paneli
Clear the chart at startup - Başlangıçta grafiği temizle
Set of Pairs - Çift Seti:
— Market Watch - Piyasa Gözlemi
— Specified manually - Manüel olarak belirtildi
— Current pair - Mevcut çift.
Pairs (separated by a space or semicolon) — boşluk veya noktalı virgülle ayrılmış sembollerin listesi. Para birimi adları, büyük/küçük harf ve önek/sonek korunarak tam olarak komisyoncununki gibi yazılmalıdır.
Time Frames (separated by a space or semicolon) (multi timeframe) - Zaman Çerçeveleri (boşluk veya noktalı virgülle ayrılmış) (çoklu zaman dilimi)
Sort pairs - Çiftleri sırala
Position on chart - Grafikteki konum
X offset (pix) - X ofseti (piksel)
Y offset (pix) - Y ofseti (piks)
Refresh dashboard every (seconds) - Kontrol panelini her (saniyede bir) yenile
Open the pair in a new window - Çifti yeni bir pencerede aç
Chart template - Grafik şablonu
Code breakout Up - Kod dökümü Yukarı
Code breakout Down - Kod dökümü Aşağı
Arrow color when IB is broken Up - IB kırıldığında ok rengi Yukarı
Arrow color when IB is broken Down - IB bozulduğunda ok rengi Aşağı
Arrow color when MB is broken Up - MB bölündüğünde ok rengi Yukarı
Arrow color when MB is broken Down - MB bozulduğunda ok rengi Aşağı
Bullish candle (fill) - Boğa mumu (doldur)
Bearish candle (fill) - Ayı mumu (doldur)
Bar up (boundary) - Çubuk yukarı (sınır)
Bar down (boundary) - Çubuk aşağı (sınır)
Show price label in cell - Fiyat etiketini hücrede göster
Price label color - Fiyat etiketi rengi
Highlight color when IB just formed - IB yeni oluştuğunda rengi vurgulayın
Candles height size (font size multiplier) - Mumların yükseklik boyutu (yazı tipi boyutu çarpanı)
Candles width size (font size multiplier) - Mumların genişlik boyutu (yazı tipi boyutu çarpanı).

Uyarılar
New IB - Yeni IB - yeni bir IB oluşturulduğunda uyarı verir.
IB breakout - IB kırılması - IB seviyeleri bozulduğunda uyarı verir.
MB breakout - MB kırılması - MB seviyeleri bozulduğunda uyarı verir.

Lines on the chart - Grafikteki çizgiler
Draw pattern on the chart - Grafiğe desen çizin.
Lines length (bars) - Çizgi uzunluğu (çubuklar).


İncelemeler 2
aworex
1737
aworex 2024.06.27 18:19 
 

A very good tool to have to make easy money on any instrument. I already use a few other tools from this developer and can confirm his coding and attention to detail is next to none.

forix7
617
forix7 2023.08.28 04:12 
 

I use a number of indicators from Taras and the programming is excellent. The attention to detail and response from the author is excellent. Always happy to assist and always very busy making advancements to each indicator. One of the best authors I have purchased from and also very knowledgeable in his craft and the markets. Thank you Taras keep up the great work.

Önerilen ürünler
Trend Ray
Andriy Sydoruk
The indicator shows the potential trend direction by cyclical-wave dependence. Thus, all the rays of the intersection will be optimal rays, in the direction of which the price is expected to move, taking into account the indicator period. Rays can be used as a direction for potential market movement. But we must not forget that the approach must be comprehensive, the indicator signals require additional information to enter the market.
Indicador de sesion de trabajo
Edmundo Antonio Bazan Garcia
Permite ver el horario comprendido entre la hora inicial que indique el usuario y la hora final, de esa manera, si el usuario desea ver sobre el grafico una sesion de trabajo, solo tiene que indicar la hora incial y la hora final de la sesion que desee. Esto permite que el usuario identifique con mayor facilidad el horario que comprenda la sesion de trabajo que el usuario desee vigilar, o trabajar, o simplemente tener como referencia.
Engulfingfinder
Miracle Obinna Okafor
The indicator is based on identifying engulfing candlestick patterns within the current timeframe. When such patterns are found, it generates buy and sell signals represented by up and down arrows, respectively. However, the user is responsible for determining the prevailing trend. Once the trend is identified, they should trade in line with the corresponding signal that aligns with the trend direction.
FREE
The indicator,   Support and Resistance Detect Signal   automatically detects support and resistance levels and trend lines, emitting a signal whenever the condition is met, as configured. It reads support and resistance drawn manually or automatically built into the chart by other external indicators. Note:   Support and Resistance Detect Signal   is compatible with almost all external indicators that draw on the chart, support and resistance levels, in addition to trend lines. Discover
Bu, bir mumun kapanış fiyatını tahmin eden bir göstergedir. Gösterge öncelikle D1 çizelgelerinde kullanılmak üzere tasarlanmıştır. Bu gösterge hem geleneksel forex ticareti hem de ikili opsiyon ticareti için uygundur. Gösterge, bağımsız bir ticaret sistemi olarak kullanılabilir veya mevcut ticaret sisteminize ek olarak hareket edebilir. Bu gösterge, mevcut mumu analiz ederek mumun gövdesi içindeki belirli güç faktörlerini ve önceki mumun parametrelerini hesaplar. Böylece gösterge, piyasa hareket
This indicator plots in the candles the divergence found in the selected indicator and can also send a notification by email and / or to the cell phone. Works on all TIMEFRAMES. Meet Our Products   He identifies the divergences in the indicators: Relative Strength Index (RSI); Moving Average Convergence and Divergence (MACD); Volume Balance (OBV) and;. iStochastic Stochastic Oscillator  (STOCHASTIC). It is possible to choose the amplitude for checking the divergence and the indicator has
FREE
Bermaui Pin Bars
Muhammad Elbermawi
5 (22)
Bermaui Pim Çubukları Veya (BPB), grafikte Pin Bar fiyat hareket modelini bulan bir göstergedir. Pin Barlar, Hammer, Inverted-Hammer, Hanging Man, Shooting Star, Dragon Fly Doji veya Grave Stone Doji gibi uzun üst veya alt gölgeli ve çok küçük gövdeli Japon şamdanlarına alternatif olan klasik bir çubuk deseni olan "Pinokyo Çubukları" için bir kısayoldur. . Bermaui Pin Bars göstergesi, sonraki adımlarda açıklanabilecek bir formüle bağlı olarak bu kalıbı bulur: İlk BPB'de mum gövdesinin merkez
Gold Phoenix
Yaroslav Varankin
The perfect tool for Scalng in the Forex markets You can trade both from signal to signal and using take profit  The algorithm does not use Zigzag!  No redrawing!  This is a channel instrument that uses a moving average as a filter. Moving Average  There are 2 parameters for the settings Ma Period = 5 period Moving Average  Channel 1.0 distance of channel lines from the chart Price Signal Filter - calculation of signal opening and filter There is a complete set of Alert There is a multi-timefram
The LordAdvancedPivot Indicator is an indicator for META TRADER 4, with the function of analyzing the main daily channels of the currency pair, known as RESISTANCE, SUPPORT and PIVOT (center), to determine the levels at which market sentiment can change from "bullish" "to" low ". Pivot points can be points that correspond to trend lines, Fibonacci levels, moving averages, previous highs / lows or closings and many more indicators, depending on the trader's philosophy. LordAdvancedPivot has
Trend PA
Mikhail Nazarenko
5 (3)
The Trend PA indicator uses   Price Action   and its own filtering algorithm to determine the trend. This approach helps to accurately determine entry points and the current trend on any timeframe. The indicator uses its own algorithm for analyzing price changes and Price Action. Which gives you the advantage of recognizing, without delay, a new nascent trend with fewer false positives. Trend filtering conditions can be selected in the settings individually for your trading style. The indicator
The indicator shows you buy/sell signals and does not repaint. It works well with almost all pairs, while the best ones are GBPUSD, XAUUSD and EURUSD. The product works better on H1 and H4. You can change the parameters in the inputs tab to get the best signals and the best trade results on each pair. You can enable/disable alerts when signal appears. The indicator is easy to use. Parameters barstrip & Sensitive: amount of bars to process the highest and lowest prices (relates to the internal
Pivot Point RSouza
Rosenildo Araujo De Souza
The indicator automatically calculates the levels of pivot points and draws the lines on the chart. The lines that are drawn: Pivot line, R1 line, R2 line, R3 line, S1 line, S2 line, S3 line. Below each line, the value for your level is displayed. The point of pivot is calculated using the traditional method. The colors of the lines and font are configurable, as is a font size of the text. The indicator can only be used in periods equal to or less than D1. Parameters Font color - text color. F
"Adjustable Fractals" - is an advanced version of fractal indicator, very useful trading tool! As we know   Standard fractals mt4 indicator does not have settings at all   - this is very inconvenient for traders Adjustable Fractals has resolved that issue - it has all necessary settings: Adjustable period   of indicator (recommended values - above 7) Adjustable distance   from Highs/Lows of price Adjustable design   af fractal arrows // More great Expert Advisors and Indicators are available he
Indicator. "Indicator wave or Indicator Ma". Using 23 standard indicators and the author's algorithm, the levels of purchases (from 0 to +100) and sales (from 0 to -100) are calculated. Then, using the calculated levels, the "Wave Indicator" draws a wave with 21 moving averages. The wave number is equal to the averaging period of the calculated levels. Waves # 1 - 7 Fast Moving Averages Waves from No. 8 -14 moving averages Waves from No. 15-21 slow moving averages Looking at the figu
Trend Moment
Maryna Shulzhenko
Using the Trend Moment indicator, you can find not only overbought and oversold zones, but also be able to identify the strongest reversals of the current trend. This will take your trading to a whole new level. Forget about slipping in oscillators, be it Stochastic or RSI or any other oscillator. Trend Moment signals 100% do not redraw and do not require adjusting the parameters - the indicator will work equally well on any chart, even with default parameters.
Trend Scanner
Vladimir Kalendzhyan
4.38 (8)
By purchasing this indicator, you have the right to receive a free copy of one of   my other indicator's or advisor’s!  (All future updates are included. No limits) . To get it , please contact me by  mql5 message ! The Trend Scanner trend line indicator displays the trend direction and its changes. The indicator works on all currency pairs and  timeframes. The indicator simultaneously displays multiple readings on the price chart: the support and resistance lines of the currency pair, the exist
Mean Reversion Supply Demand Indicator Mean Reversion Supply Demand is the indicator to detect the important supply demand zone in your chart. The concept of supply demand trading relies on the quantity mismatching between buying and selling volumes in the financial market. Typically, supply demand zone serves to predict the turning point. The wave pattern, for any supply demand zone to work as an successful trade, looks like the price must touch the base zone, move away and then return to zone
The Penta-O is a 6-point retracement harmonacci pattern which usually precedes big market movements. Penta-O patterns can expand and repaint quite a bit. To make things easier this indicator implements a twist: it waits for a donchian breakout in the right direction before signaling the trade. The end result is an otherwise repainting indicator with a very reliable trading signal. The donchian breakout period is entered as an input. [ Installation Guide | Update Guide | Troubleshooting | FAQ | A
If you are good at trading at levels This indicator is all you need levels to manage your trades Market is usually follow current trend when break out some levels or reverse Trade at the Institutional traders level with the best supply and demand zone indicator available in MT4 and MT5 The Secret Profit Levels Signals indicator for MT4 is a complete trading system that provides traders with the entry price and 2 take profit levels. Technical analysts use support and resistance levels to iden
Candlestick Patterns MT4 is a simple and convenient indicator able to define 29 candle patterns. Advantages Defines and highlights 29 candle patterns; Estimated trading direction is shown as an arrow; Each candlestick pattern can be disabled in the settings; The indicator can be used as an arrow indicator in EAs. Parameters TextSize - chart text size; TextColor - chart text color; Alert - enable/disable alerts; ---------- Candlestick Patterns ------------- - settings separator; AdvanceBlock
Provides Regression Channel on the current chart. Combined by Trend of Moving Averages and Multi timeframes Oscillator Indicators: CCI, RSI, Stochastic, and MACD with specific working logic . It could make us easier to identify swing high-low as an entry point, the retracement area while following the current trend. Consists of 2 types of signal, main and secondary. The main signal will draw very clearly triangle and lines on the chart with the word " BUY" or 'SELL'. and the secondary is the sta
Infinity Trend Pro
Yaroslav Varankin
1 (1)
This is a trend indicator without redrawing Developed instead of the binary options strategy (by the color of the Martingale candlestick) Also works well in forex trading When to open trades (binary options) A signal will appear in the place with a candle signaling the current candle It is recommended to open a deal for one candle of the current timeframe M1 and M5 When a blue dot appears, open a deal up When a red dot appears, open a trade down. How to open trades on Forex. When a signal is rec
The indicator places Semaphore points on the maximum and minimum of a higher, medium and lower period. It includes A,B,C Triangles for easier spotting of reversal chart pattern which occurs very frequently and has a very high success ratio. Both Semaphore and A,B,C Triangles have Alerts and Push notifications to a mobile device when they occur on the chart. These indicators are very useful for breakout trading and spotting support/resistance levels which gives good opportunities for positions.
Extremum Reverse Bar
Yurij Izyumov
3.55 (11)
This indicator has been created for finding the probable reversal points of the symbol price. A small candlestick reversal pattern is used it its operation in conjunction with a filter of extremums. The indicator is not redrawn! If the extremum filter is disabled, the indicator shows all points that have a pattern. If the extremum filter is enabled, the condition works – if the history Previous bars 1 candles back contains higher candles and they are farther than the Previous bars 2 candle, such
FREE
PZ Support Resistance
PZ TRADING SLU
3.33 (3)
Unlock key market insights with automated support and resistance lines Special Offer: Purchase now to receive free bonuses worth $89! (Read more for details) Tired of plotting support and resistance lines? This is a multi-timeframe indicator that detects and plots supports and resistance lines in the chart with the same precision as a human eye would. As price levels are tested over time and its importance increases, the lines become thicker and darker, making price leves easy to glance and ev
The main idea of this indicator is rates analysis and prediction by Fourier transform. Indicator decomposes exchange rates into main harmonics and calculates their product in future. You may use the indicator as a standalone product, but for better prediction accuracy there is another related indicator - FreqoMaster - which uses FreqoMeterForecast as a backend engine and combines several instances of FreqoMeterForecast for different frequency bands. Parameters: iPeriod - number of bars in the ma
MQLTA Support Resistance Lines is an indicator that calculates the historical levels of Support and Resistance and display them as Lines on chart. It will also Alert you if the price is in a Safe or Dangerous zone to trade and show you the distance to the next level. The indicator is ideal to be used in other Expert Advisor through the iCustom function. This DEMO only works with AUDNZD, the full product can be found at https://www.mql5.com/en/market/product/26328 How does it work? The indicato
FREE
KT Horizontal Lines MT4
KEENBASE SOFTWARE SOLUTIONS
In MetaTrader, plotting multiple   horizontal lines   and then tracking their respective price levels can be a hassle. This indicator automatically plots multiple horizontal lines at equal intervals for setting price alerts, plotting support and resistance levels, and other manual purposes. This indicator is suitable for Forex traders who are new and looking for chances to make quick profits from buying and selling. Horizontal lines can help traders find possible areas to start trading when the
The Divergent Accuracy indicator is designed to identify discrepancies on the price chart of a currency pair. The Divergent Accuracy indicator recognizes bullish and bearish divergences, and can also output a signal that a divergence has been detected... In addition to identifying divergences, the indicator works with overbought and oversold levels, and also shows arrows to enter the market...
Atomic Analyst
Issam Kassas
5 (3)
Öncelikle belirtmek gerekir ki bu Ticaret Göstergesi Yeniden Çizim Yapmaz, Gecikmez ve Gecikme Göstermez, bu da hem manuel hem de robot ticareti için ideal hale getirir. Kullanıcı kılavuzu: ayarlar, girişler ve strateji. Atom Analisti, Piyasada Daha İyi Bir Avantaj Bulmak İçin Fiyatın Gücünü ve Momentumunu Kullanan PA Fiyat Hareketi Göstergesidir. Gürültüleri ve Yanlış Sinyalleri Kaldırmaya ve Ticaret Potansiyelini Artırmaya Yardımcı Olan Gelişmiş Filtrelerle Donatılmıştır. Birden fazla katma
Bu ürünün alıcıları ayrıca şunları da satın alıyor
Gann Made Easy
Oleg Rodin
4.88 (100)
Gann Made Easy , bay teorisini kullanarak ticaretin en iyi ilkelerine dayanan, profesyonel ve kullanımı kolay bir Forex ticaret sistemidir. WD Gann. Gösterge, Zararı Durdur ve Kâr Al Seviyeleri dahil olmak üzere doğru SATIN AL ve SAT sinyalleri sağlar. PUSH bildirimlerini kullanarak hareket halindeyken bile işlem yapabilirsiniz. Lütfen satın aldıktan sonra benimle iletişime geçin! Alım satım ipuçlarımı ve harika bonus göstergelerini ücretsiz olarak sizinle paylaşacağım! Muhtemelen Gann ticaret y
Gold Stuff
Vasiliy Strukov
4.9 (270)
Gold Stuff, özellikle altın için tasarlanmış bir trend göstergesidir ve herhangi bir finansal enstrümanda da kullanılabilir. Gösterge yeniden çizilmez ve gecikmez. Önerilen zaman dilimi H1. Bu göstergede tam otomatik Uzman Danışman EA Gold Stuff çalışır. Profilimde bulabilirsiniz. Ayarları ve kişisel bir bonusu almak için satın alma işleminden hemen sonra benimle iletişime geçin!  Güçlü Destek ve Trend Tarayıcı göstergemizin ücretsiz bir kopyasını pm'den alabilirsiniz. Ben! AYARLAR Ok Ç
Trend Punch
Mohamed Hassan
4.91 (23)
This indicator is unstoppable when combined with our other indicator called  Support & Resistance . After purchase, send us a message and you will get it   for  FREE as a BONUS! Introducing Trend Punch , the revolutionary forex trend indicator that will transform the way you trade! Trend Punch is uniquely designed to provide precise buy and sell arrows during strong market trends, making your trading decisions clearer and more confident. Whether you're trading major currency pairs or exotic sym
ÜRÜNÜ SATIN ALMADAN ÖNCE LÜTFEN AŞAĞIDAKİ BİLGİLERİ OKUYUNUZ! Apollo Pips PLUS SP benzersiz bir üründür! YENİ "APOLLO PIPS" GÖSTERGEMİ ARTI TÜM İŞLEM GÖSTERGELERİME ERİŞİM İLE "SÜPER PAKET" BONUSUNU ALMAK İSTEYENLER İÇİN! Apollo Pips PLUS SP ürününü satın alarak aslında Apollo Pips göstergemin tamamen yeni bir versiyonunu satın almış oluyorsunuz. Göstergenin bu sürümü, geliştirilmiş bir algoritmaya ve kullanımı kolay bir parametreye sahiptir; bu, size göstergeyi herhangi bir piyasada ve herhangi
Scalper Inside PRO
Alexey Minkov
4.75 (60)
An exclusive indicator that utilizes an innovative algorithm to swiftly and accurately determine the market trend. The indicator automatically calculates opening, closing, and profit levels, providing detailed trading statistics. With these features, you can choose the most appropriate trading instrument for the current market conditions. Additionally, you can easily integrate your own arrow indicators into Scalper Inside Pro to quickly evaluate their statistics and profitability. Scalper Inside
Trend Pulse
Mohamed Hassan
5 (5)
Please contact me after purchase to immediately get your PDF strategy + documentation for Trend Pulse !  Official release price of $89  (2 /50 copies left). Next price is $199 . Introducing Trend Pulse , a unique and robust indicator capable of detecting bullish, bearish, and even ranging trends! Trend Pulse uses a special algorithm to filter out market noise with real precision. If the current symbol is moving sideways, Trend Pulse will send you a ranging signal, letting you know that it'
FX Power MT4 NG
Daniel Stein
5 (12)
Sabah Brifingimiz burada mql5 ve on Telegram! FX Power MT4 NG , uzun zamandır çok popüler olan döviz gücü ölçerimiz FX Power'ın yeni neslidir. Peki bu yeni nesil güç ölçer ne sunuyor? Orijinal FX Power hakkında sevdiğiniz her şey PLUS GOLD/XAU güç analizi Daha da hassas hesaplama sonuçları Ayrı ayrı yapılandırılabilir analiz dönemleri Daha da iyi performans için özelleştirilebilir hesaplama limiti Özel çokluDaha fazlasını görmek isteyenler için örnek ayarlar Her grafikte en sevdiğiniz renkler i
TPSproTREND PrO
Roman Podpora
4.79 (19)
TPSpro TREND PRO,   piyasayı otomatik olarak analiz eden, trend ve değişimlerinin her biri hakkında bilgi sağlayan, ayrıca yeniden çizmeden işlemlere girme sinyalleri veren bir trend göstergesidir! Gösterge her mumu ayrı ayrı analiz ederek kullanır. farklı dürtülere atıfta bulunur - yukarı veya aşağı dürtü. Para birimleri, kripto paralar, metaller, hisse senetleri ve endeksler için işlemlere tam giriş noktaları! Sürüm MT5                   GÖSTERGENİN TAM AÇIKLAMASI       Bunu -   RFI SEVİYELER
Trend Screener
STE S.S.COMPANY
4.82 (92)
Trend Göstergesi, Trend Alım Satım ve Filtreleme için Çığır Açan Benzersiz Çözüm, Tüm Önemli Trend Özellikleriyle Tek Bir Araç İçinde Yerleştirildi! Forex, emtialar, kripto para birimleri, endeksler ve hisse senetleri gibi tüm sembollerde/araçlarda kullanılabilen %100 yeniden boyamayan çoklu zaman çerçevesi ve Çoklu para birimi göstergesidir. Trend Screener, grafikte noktalarla ok trend sinyalleri sağlayan etkili bir trend trend göstergesidir. Trend analizörü göstergesinde bulunan özellikler: 1.
Gold Channel is a volatility-based indicator, developed with a specific timing algorithm for the XAUUSD pair, which consists of finding possible corrections in the market. This indicator shows two outer lines, an inner line (retracement line) and an arrow sign, where the theory of the channel is to help identify overbought and oversold conditions in the market. The market price will generally fall between the boundaries of the channel. If prices touch or move outside the channel it is a tra
Currency Strength Wizard , başarılı ticaret için size hepsi bir arada çözüm sağlayan çok güçlü bir göstergedir. Gösterge, birden çok zaman dilimindeki tüm para birimlerinin verilerini kullanarak şu veya bu forex çiftinin gücünü hesaplar. Bu veriler, şu veya bu para biriminin gücünü görmek için kullanabileceğiniz, kullanımı kolay para birimi endeksi ve para birimi güç hatları biçiminde temsil edilir. İhtiyacınız olan tek şey, işlem yapmak istediğiniz tabloya göstergeyi eklemektir ve gösterge size
Şu anda %20 İNDİRİMLİ! Herhangi bir Acemi veya Uzman Tüccar için En İyi Çözüm! Bu gösterge paneli yazılımı 28 döviz çifti üzerinde çalışıyor. Ana göstergelerimizden 2'sine (Gelişmiş Para Birimi Gücü 28 ve Gelişmiş Para Birimi Dürtüsü) dayanmaktadır. Tüm Forex piyasasına harika bir genel bakış sağlar. Gelişmiş Para Birimi Gücü değerlerini, para birimi hareket hızını ve tüm (9) zaman dilimlerinde 28 Forex çifti için sinyalleri gösterir. Trendleri ve / veya scalping fırsatlarını belirlemek içi
- Real price is 80$ - 40% Discount ( It is 49$ now ) Contact me for instruction, any questions! Introduction The breakout and retest strategy is traded support and resistance levels. it involves price breaking through a previous level.  The break and retest strategy is designed to help traders do two main things, the first is to avoid false breakouts. Many false breakouts start with a candlestick that breaks out of a level but ends with an immediate candlestick that brings the price back into t
PZ Day Trading
PZ TRADING SLU
3.67 (3)
Effortless trading: non-repainting indicator for accurate price reversals Special Offer: Purchase now to receive free bonuses worth $189! (Read more for details) This indicator detects price reversals in a zig-zag fashion, using only price action analysis and a donchian channel. It has been specifically designed for short-term trading, without repainting or backpainting at all. It is a fantastic tool for shrewd traders aiming to increase the timing of their operations. [ Installation Guide | Up
Clear Breakout
Martin Alejandro Bamonte
5 (1)
"Breakout Buy-Sell" göstergesi, farklı piyasa seansları (Tokyo, Londra ve New York) sırasında fiyat kırılmalarına dayalı olarak potansiyel alım ve satım fırsatlarını belirlemek ve vurgulamak için tasarlanmıştır. Bu gösterge, traderların alım ve satım bölgelerini, ayrıca kâr alma (TP) ve zarar durdurma (SL) seviyelerini net bir şekilde görselleştirmelerine yardımcı olur. Kullanım Stratejisi Gösterge şu şekilde kullanılabilir: İlk Kurulum : Piyasa seansını seçin ve GMT farkını ayarlayın. Piyasa Gö
ŞU ANDA %26 INDIRIMLI Yeni Başlayanlar veya Uzman Tüccarlar için En İyi Çözüm! Bu Gösterge benzersiz, yüksek kaliteli ve uygun fiyatlı bir ticaret aracıdır çünkü bir dizi tescilli özellik ve yeni bir formül ekledik. Sadece BİR grafik ile 28 Forex çifti için Döviz Gücünü okuyabilirsiniz! Yeni bir trendin veya scalping fırsatının tam tetik noktasını belirleyebildiğiniz için ticaretinizin nasıl gelişeceğini hayal edin? Kullanım kılavuzu: buraya tıklayın Bu ilk olan, orijinal! Değersiz bir
PRO Renko Sistemi, RENKO grafikleri ticareti için özel olarak tasarlanmış son derece hassas bir ticaret sistemidir. Bu, çeşitli ticaret araçlarına uygulanabilen evrensel bir sistemdir. Sistemi etkin piyasa sana doğru ters sinyallerine erişim hakkı denilen ses nötralize eder. Göstergenin kullanımı çok kolaydır ve sinyal üretiminden sorumlu tek bir parametreye sahiptir. Aracı, seçtiğiniz herhangi bir ticaret aracına ve renko çubuğunun boyutuna kolayca uyarlayabilirsiniz. Yazılımımla karlı b
Öncelikle, bu Ticaret Aracının Non-Repainting, Non-Redrawing ve Non-Lagging Gösterge olduğunu vurgulamakta fayda var, bu da onu profesyonel ticaret için ideal hale getiriyor. Çevrimiçi kurs, kullanıcı kılavuzu ve demo. Akıllı Fiyat Hareketi Kavramları Göstergesi, hem yeni hem de deneyimli tüccarlar için çok güçlü bir araçtır. İleri ticaret fikirlerini, Inner Circle Trader Analizi ve Smart Money Concepts Ticaret Stratejileri gibi 20'den fazla kullanışlı göstergeyi bir araya getirerek bir araya g
ŞU ANDA %31 INDIRIMLI !!! Yeni Başlayanlar veya Uzman Tüccarlar için En İyi Çözüm! Bu gösterge benzersiz, yüksek kaliteli ve uygun fiyatlı bir ticaret aracıdır çünkü bir dizi tescilli özellik ve gizli bir formül ekledik. Yalnızca BİR grafikle 28 döviz çiftinin tümü için Uyarılar verir. Yeni bir trendin veya scalping fırsatının tam tetik noktasını belirleyebildiğiniz için ticaretinizin nasıl gelişeceğini hayal edin! Yeni temel algoritmalar üzerine inşa edilen bu sistem, potansiyel işlemler
IX Power MT4
Daniel Stein
5 (6)
IX Power nihayet FX Power'ın rakipsiz hassasiyetini Forex dışı sembollere getiriyor. En sevdiğiniz endeksler, hisse senetleri, emtialar, ETF'ler ve hatta kripto para birimlerindeki kısa, orta ve uzun vadeli eğilimlerin yoğunluğunu doğru bir şekilde belirler. Terminalinizin sunduğu her şeyi analiz edebilirsiniz. Deneyin ve işlem yaparken zamanlamanızın nasıl önemli ölçüde iyileştiğini deneyimleyin. IX Power Temel Özellikler 100 hassas, yeniden boyanmayan hesaplama sonuçları - terminalini
Advanced Supply Demand
Bernhard Schweigert
4.9 (314)
CURRENTLY 26% OFF !! Best Solution for any Newbie or Expert Trader! This indicator is a unique, high quality and affordable trading tool because we have incorporated a number of proprietary features and a new formula. With this update, you will be able to show double timeframe zones. You will not only be able to show a higher TF but to show both, the chart TF, PLUS the higher TF: SHOWING NESTED ZONES. All Supply Demand traders will love it. :) Important Information Revealed Maximize the potenti
NAM Order Blocks
NAM TECH GROUP, CORP.
5 (1)
MT4 Multi-timeframe Order Blocks detection indicator. Features - Fully customizable on chart control panel, provides complete interaction. - Hide and show control panel wherever you want. - Detect OBs on multiple timeframes. - Select OBs quantity to display. - Different OBs user interface. - Different filters on OBs. - OB proximity alert. - ADR High and Low lines. - Notification service (Screen alerts | Push notifications). Summary Order block is a market behavior that indicates order collection
Enigmera
Ivan Stefanov
5 (4)
ENIGMERA: Pazarın çekirdeği https://www.enigmera.com Giriş Bu gösterge ve ticaret sistemi, finansal piyasalar için dikkate değer bir yaklaşımdır. ENIGMERA, destek ve direnç seviyelerini doğru bir şekilde hesaplamak için fraktal döngüleri kullanır. Gerçek birikim aşamasını gösterir ve yön ve hedefler verir.  İster bir trendde ister bir düzeltmede olalım çalışan bir sistem.  Nasıl çalışır? ENIGMERA üç çizgiden oluşur: destek/direnç çizgisi, hedef çizgisi ve sapma çizgisi. Sistem, geçmiş veril
PZ Trend Trading
PZ TRADING SLU
4.8 (5)
Capture every opportunity: your go-to indicator for profitable trend trading Special Offer: Purchase now to receive free bonuses worth $159! (Read more for details) Trend Trading is an indicator designed to profit as much as possible from trends taking place in the market, by timing pullbacks and breakouts. It finds trading opportunities by analyzing what the price is doing during established trends. [ Installation Guide | Update Guide | Troubleshooting | FAQ | All Products ] Trade financial
TPSpro RFI Levels
Roman Podpora
4.83 (24)
Reversal First Impulse levels (RFI)    INSTRUCTIONS        RUS       -       ENG              R ecommended to use with an indicator   -   TPSpro  TREND PRO -  Version MT5 A key element in trading is zones or levels from which decisions to buy or sell a trading instrument are made. Despite attempts by major players to conceal their presence in the market, they inevitably leave traces. Our task was to learn how to identify these traces and interpret them correctly. Main functions: Displaying activ
Scalper Vault
Oleg Rodin
5 (29)
Scalper Vault , başarılı bir scalping için ihtiyacınız olan her şeyi size sağlayan profesyonel bir scalping sistemidir. Bu gösterge, forex ve ikili opsiyon tüccarları tarafından kullanılabilecek eksiksiz bir ticaret sistemidir. Önerilen zaman çerçevesi M5'tir. Sistem size trend yönünde doğru ok sinyalleri sağlar. Ayrıca size üst ve alt sinyaller ve Gann piyasa seviyeleri sağlar. Göstergeler, PUSH bildirimleri dahil her türlü uyarıyı sağlar. Göstergeyi satın aldıktan sonra lütfen benimle iletişim
M1 Arrow
Oleg Rodin
4.73 (15)
Piyasanın iki temel ilkesine dayanan bir gün içi stratejisi. Algoritma, ek filtreler kullanarak hacimlerin ve fiyat dalgalarının analizine dayanmaktadır. Göstergenin akıllı algoritması, yalnızca iki piyasa faktörü bir araya geldiğinde bir sinyal verir. Gösterge, daha yüksek zaman çerçevesinin verilerini kullanarak M1 grafiğinde belirli bir aralıktaki dalgaları hesaplar. Ve dalgayı doğrulamak için gösterge, hacme göre analizi kullanır. Bu gösterge hazır bir ticaret sistemidir. Bir tüccarın ihtiya
Order Block Hunter
Noha Mohamed Fathy Younes Badr
5 (2)
Order block hunter indicator is the best indicator for  hunt the order blocks that area where there has been a large concentration of limit orders waiting to be executed Order blocks are identified on a chart by observing previous price action and looking for areas where the price experienced significant movement or sudden changes in direction .This indicator does that for you by using very complicated codes and helps you to take the best areas To buy and sell because it make marks at the best a
Backtest and Read Overview before purchase. Chart patterns have been a topic of debate among traders; some believe they are reliable signalers, while others do not. Our Chart Patterns All-in-One indicator displays various chart patterns to help you test these theories for yourself. The profitability of these patterns is not a reflection of the indicator's effectiveness but rather an evaluation of the patterns themselves. The Chart Patterns All-in-One indicator is an excellent tool for visualizin
Break and Retest
Mohamed Hassan
4.17 (18)
This Indicator only places quality trades when the market is really in your favor with a clear break and retest. Patience is key with this price action strategy! If you want more alert signals per day, you increase the number next to the parameter called: Support & Resistance Sensitivity.  After many months of hard work and dedication, we are extremely proud to present you our  Break and Retest price action indicator created from scratch. One of the most complex indicators that we made with ove
Yazarın diğer ürünleri
Time Scale for MT5
Taras Slobodyanik
4.73 (22)
The indicator draws the time scale on the chart. You can specify the time offset, adjust the size and font to display on the chart ( it is displaying your local time on your chart instead of MT time ). You can also select the desired format for displaying the date and time. You may be interested in my other product , which contains a more advanced version of the Time Scale . Parameters Hours (time shift) — time shift (hours); Minutes (time shift) — time shift (minutes); Show time on mouse — sh
FREE
ADX Dashboard
Taras Slobodyanik
5 (4)
ADX göstergesi trendi ve gücünü belirlemek için kullanılır. Fiyatın yönü +DI ve -DI değerleriyle, ADX değeri ise trendin gücünü gösterir. +DI -DI'nin üzerindeyse piyasa yükseliş trendindedir, tam tersi ise düşüş trendindedir. ADX 20'nin altında ise kesin bir yön yoktur. Gösterge bu seviyeyi kırdığı anda orta güçte bir trend başlıyor. 40'ın üzerindeki değerler güçlü bir trendi (düşüş trendi veya yükseliş trendi) gösterir. Ortalama Yönlü Hareket Endeksi (ADX) göstergesinin çoklu para birimi ve
ZigZag Dashboard for MT4
Taras Slobodyanik
4.75 (4)
ZigZag göstergesinin çoklu para birimi ve çoklu zaman çerçevesi modifikasyonu. Piyasanın mevcut yönünü, son hareketin yüksekliğini, bu hareketteki çubuk sayısını ve ZigZag'ın önceki noktasının (yatay çizgi) kırılmasını görüntüler. Bu MTF Tarayıcıdır. Parametrelerde istediğiniz para birimini ve zaman dilimlerini belirtebilirsiniz. Ayrıca panel, ZigZag yön değiştirdiğinde veya önceki noktada bir ilerleme olduğunda bildirim gönderebilir. Noktalı bir hücreye tıkladığınızda bu sembol ve nokta açıl
Gösterge, ZigZag göstergesine, İşlem Seanslarına, Fraktallara veya Mumlara (standart olmayan zaman dilimleri dahil: Yıl, 6 Ay, 4 Ay, 3 Ay, 2 Ay) (Otomatik Fibo Geri Çekme) dayalı olarak Fibonacci seviyelerini otomatik olarak çizer. Fibonachi hesaplaması için daha yüksek bir zaman dilimini seçebilirsiniz. Mevcut çubuk her kapandığında seviyeler yeniden çizilir. Belirtilen seviyeleri geçerken uyarıları etkinleştirmek mümkündür. Ayrıca tarihteki seviyeleri de analiz edebilirsiniz. Bunun için "Ge
MA Dashboard MT5
Taras Slobodyanik
5 (4)
Hareketli Ortalama (MA) göstergesinin çok para birimi ve çok zaman çerçeveli modifikasyonu. Kontrol panelinde göstergenin mevcut durumunu görebilirsiniz - Hızlı MA ve Yavaş MA'nın kırılmaları ve dokunuşları (fiyata göre) ve ayrıca MA çizgilerinin birbirleri arasındaki kesişimi (hareketli ortalama geçiş). Parametrelerde istediğiniz para birimini ve zaman dilimlerini belirleyebilirsiniz. Ayrıca gösterge, fiyatın çizgilere temas etmesi ve geçişleri hakkında bildirimler gönderebilir. Noktalı bir hü
Heikin Ashi Dashboard
Taras Slobodyanik
5 (4)
Çoklu para birimi ve çoklu zaman çerçeveli Heikin Ashi göstergesi. Piyasanın mevcut durumunu gösterir. Tarayıcı panelinde mevcut trendin yönünü, gücünü ve çubuk sayısını görebilirsiniz. Konsolidasyon/Tersine Dönme mumları da renk kullanılarak gösterilir. Parametrelerde istediğiniz para birimini ve periyodu belirtebilirsiniz. Ayrıca gösterge, trend değiştiğinde veya tersine dönüş ve konsolidasyon mumları (dojiler) göründüğünde bildirim gönderebilir. Bir hücreye tıkladığınızda bu simge ve nokta a
Stokastik Osilatörün çoklu para birimi ve çoklu zaman çerçevesi modifikasyonu. Parametrelerde istediğiniz para birimini ve zaman dilimlerini belirtebilirsiniz. Panel, Sinyal ve Ana (stokastik geçiş) çizgilerinin mevcut değerlerini ve kesişimlerini görüntüler. Ayrıca gösterge aşırı alım ve aşırı satım seviyelerini geçerken bildirim gönderebilir. Noktalı bir hücreye tıkladığınızda bu sembol ve nokta açılacaktır. Bu MTF Tarayıcıdır. Para Birimi Gücü Ölçer'e benzer şekilde, Kontrol Paneli belirli b
ZigZag Lines MTF
Taras Slobodyanik
4.33 (12)
Çoklu zaman dilimi ZigZag göstergesi. Destek/direnç yatay çizgilerini ve bunların kırılmalarını gösterir, ayrıca piyasanın mevcut hedeflerini de çizer. Ayrıca Fraktallar göstergesinin çizgilerini ve diğer dönemlere ait mumları da görüntüleyebilir (Üç Aylığa kadar). Gösterge son (geçerli) noktayı yeniden çizer ve bazı durumlarda son 2-3 noktayı değiştirebilir. Tüm çizgiler nesneler olarak çizilir (gösterge arabellekleri değil, ancak EA için veri alma olasılığı vardır). Uzman Danışmanda kulla
Lines Profit Loss MT5
Taras Slobodyanik
4.61 (18)
Gösterge mevcut sembol üzerinde kârı (zararı) gösterir. Mevcut kar veya zararı görüntülemek için çizgiyi serbestçe sürükleyip bırakabilirsiniz. Parametreler Calculation in money or in points — kar/zararı puan veya para cinsinden hesaplayın. Add pending orders to calculate — hesaplamalarda bekleyen siparişleri dikkate alın. Magic Number (0 - all orders on symbol) — belirli sıraları değerlendirmek gerekiyorsa sihirli sayı. Offset for first drawing (points from the average price) — ilk başla
FREE
MACD Dashboard
Taras Slobodyanik
Çoklu para birimi ve çoklu zaman dilimi göstergesi MACD. Kontrol paneli hem Geleneksel (gerçek) MACD'yi hem de MetaTrader'da yerleşik olan MACD'yi görüntüleyebilir. Panelde göstergenin mevcut durumunu, MACD çizgilerinin hareket yönünü, kesişimlerini ve gösterge grafiğini içeren bir açılır pencereyi görebilirsiniz. Parametrelerde istediğiniz herhangi bir çift sembolü ve zaman dilimini belirleyebilirsiniz. Tarayıcı aynı zamanda birbirini kesen çizgiler ve Sıfır seviyesini geçen çizgiler hakkınd
Gösterge, ZigZag göstergesine, İşlem Seanslarına, Fraktallara veya Mumlara (standart olmayan zaman dilimleri dahil: Yıl, 6 Ay, 4 Ay, 3 Ay, 2 Ay) (Otomatik Fibo Geri Çekme) dayalı olarak Fibonacci seviyelerini otomatik olarak çizer. Fibonachi hesaplaması için daha yüksek bir zaman dilimini seçebilirsiniz. Mevcut çubuk her kapandığında seviyeler yeniden çizilir. Belirtilen seviyeleri geçerken uyarıları etkinleştirmek mümkündür. Ayrıca tarihteki seviyeleri de analiz edebilirsiniz. Bunun için "Ge
Lines Profit Loss
Taras Slobodyanik
4.82 (22)
Gösterge mevcut sembol üzerinde kârı (zararı) gösterir. Mevcut kar veya zararı görüntülemek için çizgiyi serbestçe sürükleyip bırakabilirsiniz. Parametreler Calculation in money or in points — kar/zararı puan veya para cinsinden hesaplayın. Add pending orders to calculate — hesaplamalarda bekleyen siparişleri dikkate alın. Magic Number (0 - all orders on symbol) — belirli sıraları değerlendirmek gerekiyorsa sihirli sayı. Offset for first drawing (points from the average price) — ilk başla
FREE
CCI Dashboard for MT5
Taras Slobodyanik
5 (1)
Emtia Kanalı Endeksi (CCI) göstergesinin çok para birimi ve çok zaman çerçeveli modifikasyonu. Parametrelerde istediğiniz para birimini ve zaman dilimlerini belirtebilirsiniz. Ayrıca panel aşırı alım ve aşırı satım seviyelerini geçerken bildirim gönderebilir. Noktalı bir hücreye tıkladığınızda bu sembol ve nokta açılacaktır. Bu MTF Tarayıcıdır. Kontrol panelini grafikten gizlemenin anahtarı varsayılan olarak "D"dir. Parametreler CCI Period — ortalama dönem. CCI Applied price — fiyat tür
MA Dashboard
Taras Slobodyanik
4.5 (2)
Hareketli Ortalama (MA) göstergesinin çok para birimi ve çok zaman çerçeveli modifikasyonu. Kontrol panelinde göstergenin mevcut durumunu görebilirsiniz - Hızlı MA ve Yavaş MA'nın kırılmaları ve dokunuşları (fiyata göre) ve ayrıca MA çizgilerinin birbirleri arasındaki kesişimi (hareketli ortalama geçiş). Parametrelerde istediğiniz para birimini ve zaman dilimlerini belirleyebilirsiniz. Ayrıca gösterge, fiyatın çizgilere temas etmesi ve geçişleri hakkında bildirimler gönderebilir. Noktalı bir hü
Stokastik Osilatörün çoklu para birimi ve çoklu zaman çerçevesi modifikasyonu. Parametrelerde istediğiniz para birimini ve zaman dilimlerini belirtebilirsiniz. Panel, Sinyal ve Ana (stokastik geçiş) çizgilerinin mevcut değerlerini ve kesişimlerini görüntüler. Ayrıca gösterge aşırı alım ve aşırı satım seviyelerini geçerken bildirim gönderebilir. Noktalı bir hücreye tıkladığınızda bu sembol ve nokta açılacaktır. Bu MTF Tarayıcıdır. Para Birimi Gücü Ölçer'e benzer şekilde, Kontrol Paneli belirli b
Göstergenin üç ana aracı vardır: Büyüteç (Yakınlaştırma grafiği), Cetvel (Zaman ve Fiyat ölçekleri) ve Artı İşareti. Farenizle her yeri hareket ettirebilir ve farklı görüntüleme formatlarını özelleştirebilir, her öğenin boyutunu ve rengini özelleştirebilirsiniz. Büyüteç (yakınlaştırma tablosu), mumları herhangi bir zaman diliminde ve farklı ölçeklerde görüntülemenizi sağlar. Varsayılan kısayol tuşları: 'Q' - daha yüksek zaman aralığı, 'A' - daha düşük zaman aralığı, 'W' - mum boyutunu azalt,
Göstergenin üç ana aracı vardır: Büyüteç (Yakınlaştırma grafiği), Cetvel (Zaman ve Fiyat ölçekleri) ve Artı İşareti. Farenizle her yeri hareket ettirebilir ve farklı görüntüleme formatlarını özelleştirebilir, her öğenin boyutunu ve rengini özelleştirebilirsiniz. Büyüteç   (yakınlaştırma tablosu), mumları herhangi bir zaman diliminde ve farklı ölçeklerde görüntülemenizi sağlar. Varsayılan kısayol tuşları: 'Q' - daha yüksek zaman aralığı, 'A' - daha düşük zaman aralığı, 'W' - mum boyutunu azalt
Çoklu zaman dilimi ZigZag göstergesi. Destek/direnç yatay çizgilerini ve bunların kırılmalarını gösterir, ayrıca piyasanın mevcut hedeflerini de çizer. Ayrıca Fraktallar göstergesinin çizgilerini ve diğer dönemlere ait mumları da görüntüleyebilir (Üç Aylığa kadar). Gösterge son (geçerli) noktayı yeniden çizer ve bazı durumlarda son 2-3 noktayı değiştirebilir. Tüm çizgiler nesneler olarak çizilir (gösterge arabellekleri değil, ancak EA için veri alma olasılığı vardır). Uzman Danışmanda kulla
Inside Bar MT4
Taras Slobodyanik
4 (4)
The indicator determines the inside bar and marks its High/Low. It is plotted based on the closed candles (does not redraw). The identified inside bar can be displayed on the smaller periods. You may set a higher period (to search for the inside bar) and analyze on a smaller one. Also you can see the levels for Mother bar. Indicator Parameters Period to find Inside Bar — the period to search for the inside bar. If a specific period is set, the search will be performed in that period. Type of i
MTF RSI for MT5
Taras Slobodyanik
5 (1)
Multi-timeframe indicator Relative Strength Index displays information simultaneously from different periods in one subwindow of the chart. Parameters Period of averaging — averaging period for the RSI calculation. Type of price — price used. Timeframes for RSI — list of periods, separated by a space or comma or semicolon. Number of bars for each period — the number of bars displayed for each period. Sort periods — sort periods if they are listed in no particular order. Current period first —
ZigZag göstergesinin çoklu para birimi ve çoklu zaman çerçevesi modifikasyonu. Piyasanın mevcut yönünü, son hareketin yüksekliğini, bu hareketteki çubuk sayısını ve ZigZag'ın önceki noktasının (yatay çizgi) kırılmasını görüntüler. Bu MTF Tarayıcıdır. Parametrelerde istediğiniz para birimini ve zaman dilimlerini belirtebilirsiniz. Ayrıca panel, ZigZag yön değiştirdiğinde veya önceki noktada bir ilerleme olduğunda bildirim gönderebilir. Noktalı bir hücreye tıkladığınızda bu sembol ve nokta açıl
Symbol Manager or Grid Manager, designed to group orders into one position (by symbol and by direction). This utility will be useful to multi-currency traders, who can have multiple orders on several pairs. You will be able to see the total number of lots, the total profit, and set virtual stop loss and virtual take profit. To set a real TP (or SL), you must first set the virtual value, and then enter the command in this cell: "set". If you want to set real TP/SL for all orders at once, then en
Bu kontrol paneli üç kaynaktan güncel haberleri görüntüler: ForexFactory.com web sitesinden (FFC takvimi), Investing.com web sitesinden ve mql5.com Ekonomik Takviminden. Haberleri etki alanına ve ülkeye göre sıralayabilir, tek tıkla grafikte görüntüleyebilirsiniz. 'Ctrl' tuşunu basılı tutarak sıralamak için birkaç farklı 'para birimi' veya 'etki' seçebilirsiniz. Ayrıca bu yardımcı program yalnızca tahmini değil, aynı zamanda sitede göründükten sonraki gerçek değerleri de gösterir. Her haber içi
Time Scale
Taras Slobodyanik
4.8 (10)
The indicator draws the time scale on the chart. You can specify the time offset, adjust the size and font to display on the chart (it is displaying your local time on your chart instead of MT time). You can also select the desired format for displaying the date and time. While holding down the middle mouse button, and moving the cursor, a slider will appear on the scale. You may be interested in my other product , which contains a more advanced version of the Time Scale. Parameters Hours (tim
FREE
ADX Dashboard MT5
Taras Slobodyanik
5 (3)
ADX göstergesi trendi ve gücünü belirlemek için kullanılır. Fiyatın yönü +DI ve -DI değerleriyle, ADX değeri ise trendin gücünü gösterir. +DI -DI'nin üzerindeyse piyasa yükseliş trendindedir, tam tersi ise düşüş trendindedir. ADX 20'nin altında ise kesin bir yön yoktur. Gösterge bu seviyeyi kırdığı anda orta güçte bir trend başlıyor. 40'ın üzerindeki değerler güçlü bir trendi (düşüş trendi veya yükseliş trendi) gösterir. Ortalama Yönlü Hareket Endeksi (ADX) göstergesinin çoklu para birimi ve
News Dashboard MT4
Taras Slobodyanik
4.43 (7)
Bu kontrol paneli üç kaynaktan güncel haberleri görüntüler: ForexFactory.com web sitesinden (FFC takvimi), Investing.com web sitesinden ve mql5.com Ekonomik Takviminden. Haberleri etki alanına ve ülkeye göre sıralayabilir, tek tıkla grafikte görüntüleyebilirsiniz. 'Ctrl' tuşunu basılı tutarak sıralamak için birkaç farklı 'para birimi' veya 'etki' seçebilirsiniz. Ayrıca bu yardımcı program yalnızca tahmini değil, aynı zamanda sitede göründükten sonraki gerçek değerleri de gösterir. Her haber içi
Gösterge Bollinger Bantlarının çoklu para birimi ve çoklu zaman çerçevesi modifikasyonu. Kontrol panelinde Bollinger Bantlarının kırılmalarını ve dokunuşlarını görebilirsiniz. Parametrelerde istediğiniz para birimini ve zaman dilimlerini belirleyebilirsiniz. Gösterge ayrıca fiyat Bollinger Bantlarına dokunduğunda, mevcut oynaklık değiştiğinde (genişlediğinde veya düştüğünde) ve fiyat tüm bantlara dokunduğunda bildirim gönderebilir. Noktalı bir hücreye tıkladığınızda bu sembol ve nokta açılacakt
Göreceli Güç Endeksi (RSI) göstergesinin çoklu para birimi ve çoklu zaman çerçeveli modifikasyonu. Parametrelerde istediğiniz para birimini ve zaman dilimlerini belirtebilirsiniz. Ayrıca panel aşırı alım ve aşırı satım seviyelerini geçerken bildirim gönderebilir. Noktalı bir hücreye tıkladığınızda bu sembol ve nokta açılacaktır. Bu MTF Tarayıcıdır. Kontrol panelini grafikten gizlemenin anahtarı varsayılan olarak "D"dir. Para Birimi Gücü Ölçer'e benzer şekilde, Kontrol Paneli belirli bir par
Çoklu para birimi ve çoklu zaman çerçeveli Heikin Ashi göstergesi. Piyasanın mevcut durumunu gösterir. Tarayıcı panelinde mevcut trendin yönünü, gücünü ve çubuk sayısını görebilirsiniz. Konsolidasyon/Tersine Dönme mumları da renk kullanılarak gösterilir. Parametrelerde istediğiniz para birimini ve periyodu belirtebilirsiniz. Ayrıca gösterge, trend değiştiğinde veya tersine dönüş ve konsolidasyon mumları (dojiler) göründüğünde bildirim gönderebilir. Bir hücreye tıkladığınızda bu simge ve nokta a
Pro Sessions MT5
Taras Slobodyanik
5 (1)
Bu, dört seans boyunca tüm seviyeleri (Açık-Yüksek-Düşük-Kapanış) görüntüleyebilen işlem seanslarının bir göstergesidir. Gösterge aynı zamanda oturum düzeylerini de tahmin edebilir. Oturumlar çizgiler veya dikdörtgenler (boş veya dolu) ile çizilebilir, çizgiler bir sonraki oturuma uzatılabilir. Kısayol tuşlarına (varsayılan olarak '1', '2', '3', '4') basarak her oturumu kolayca gizleyebilir/gösterebilirsiniz. ASR (Ortalama Oturum Aralığı)   satırlarını görebilirsiniz (varsayılan kısayol tuşu
Filtrele:
aworex
1737
aworex 2024.06.27 18:19 
 

A very good tool to have to make easy money on any instrument. I already use a few other tools from this developer and can confirm his coding and attention to detail is next to none.

forix7
617
forix7 2023.08.28 04:12 
 

I use a number of indicators from Taras and the programming is excellent. The attention to detail and response from the author is excellent. Always happy to assist and always very busy making advancements to each indicator. One of the best authors I have purchased from and also very knowledgeable in his craft and the markets. Thank you Taras keep up the great work.

İncelemeye yanıt
Sürüm 1.90 2024.03.14
1) Changed the behavior of setting the timer at startup. Now the indicator tries to start the timer again when a new tick arrives. If there is no tick for a long time (or it’s a weekend), you can click on the button on the chart and restart the timer yourself.
Sürüm 1.80 2023.12.09
1) Added the "Code Page for Characters" parameter. If your system uses a different encoding (for example, Chinese or Japanese), then you may need to change this setting in order to see the characters correctly in the dashboard.
Sürüm 1.70 2023.11.11
1) Added automatic shifting of the dashboard to the foreground.
Sürüm 1.60 2023.10.15
1) The "Y-offset (pix, +/-)" parameter can now be negative.
2) Changed the behavior of the pop-up chart when the window is small.
Sürüm 1.50 2023.09.03
1) Added "Hotkey to enable/disable the Popup chart" parameter for "Popup chart".
2) Added "Y-offset (pix)" parameter for "Popup chart".
Sürüm 1.40 2023.08.27
1) Added parameter "IB body must be inside of the MB body".
2) Added parameter "IB body and wicks must be inside the MB body".
3) Added a Dashboard recovery check when running multiple copies on the same chart.
Sürüm 1.30 2023.08.25
1) Returned the deletion of the dashboard from the chart at startup.
Sürüm 1.10 2023.08.07
1) Added a hotkey to hide the dashboard, by default "D".
2) Added "Popup chart" parameters. Now, when you hover the mouse over the cells, you can see a pop-up chart from this timeframe.
3) Added "Color scheme" parameter.
4) Added the ability to enable/disable alerts for each Symbol when clicking on the name of the Pair. If no Pair is selected then alerts are enabled for all Symbols.
5) The condition of the list of pairs for the second parameter has been changed. Pairs in the second parameter must be typed only with a semicolon and must be in exact case. "Pairs (separated ONLY by a semicolon and have exact letter case)"