• Genel bakış
  • İncelemeler
  • Yorumlar
  • Yenilikler

UR Vortex MT5

UR Vortex MT5
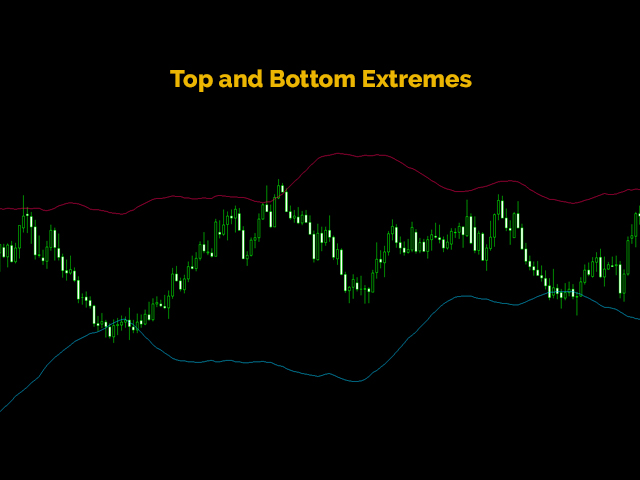
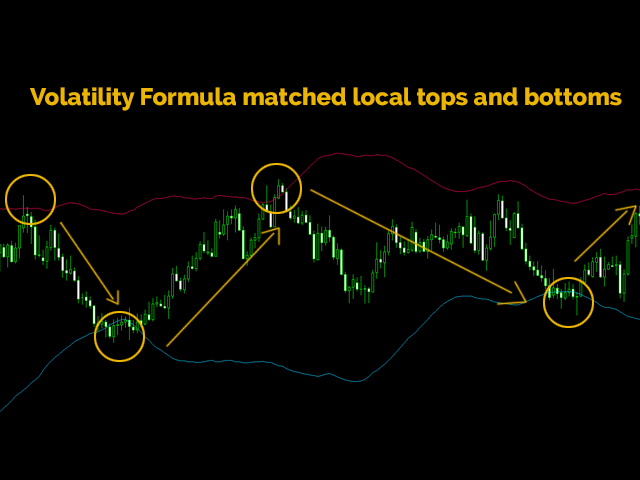
The Probabilistic UR Vortex Formula: An Accurate System for Predictive Market Analysis using Volatility and Standard Deviation Calculations.

The UR Vortex MT5 indicator is a technical analysis tool that uses volatility and standard deviation calculations to predict potential tops and bottoms in a market. It measures the strength of a trend by calculating the distance between the current price and a moving average, and then standardizing this distance by dividing it by the average true range (ATR) of the market. The result is a normalized value that represents the volatility of the market.

Advantages of using UR Vortex MT5 :

  1. Visually easy to understand and use
  2. Highly Accurate <<<
  3. No settings
  4. Adjusted to every kind of asset
  5. Perfect addition to any strategy <<<

There is a special telegram chat on which you can stay up-to-date with the tools updates and also send request if you feel there is something missing!


Why UR 
Vortex MT5 
?

The UR Vortex Formula has been developed based on years of experience and price action observation. It is a proven to work tool used by many professional traders. This formula, combining the power of volatility and standard deviation calculations with advanced probability analysis, provides traders with an accurate and reliable tool for predicting market tops and bottoms. Say goodbye to guesswork and missed opportunities, and take control of your financial future with the UR Vortex system.

How to use UR Vortex MT5 ?

  • Track the price action until it gets exhausted (crosses any line). At first show of weakness - a potential reversal may surge starting a new trend.
  • Highly suggested using multi-timeframe setups for better accuracy of entry


DISPLAY

  • Two sided Lines: Show levels of volatility exhaustion - predicted with the probabilistic formula based on Volatility and Price Action

WWW -> https://urtradingcoder.carrd.co

Twitter -> https://twitter.com/URTradingCoder

Facebook -> https://www.facebook.com/profile.php?id=61559349091899

YouTube -> https://www.youtube.com/channel/UCihthoKQYrhj91jkUO8B1kg

MQL Store -> https://www.mql5.com/en/users/youreacoder/seller


Önerilen ürünler
Renko Plus
Eadvisors Software Inc.
With Renko Plus you can use the features in the Indicator functionality, just add it to the Metatrader5 chart.             The Renko chart is a type of chart, developed by the Japanese, that is constructed using price movement rather than standardized prices and time intervals like most charts. It is believed to be named after the Japanese word for bricks, "renga", as the graphic looks like a series of bricks.             A new brick is created when the price moves a specified p
Introduction to Smart Renko The main characteristics of Renko Charting concern price movement. To give you some idea on its working principle, Renko chart is constructed by placing a brick over or below when the price make the movement beyond a predefined range, called brick height. Therefore, naturally one can see clear price movement with less noise than other charting type. Renko charting can provide much clearer trend direction and it helps to identify important support and resistance level
Gino Renko
Stephane, Andr Valette
1 (1)
Another renko-based indicator. It returns different usable values ​​for an EA, and is directly displayed on the main chart. Its setting is very simple: The size of the renko The number of bars taken into account The falling color The color on the rise Returned values: Buffer 0 : Value of the middle Buffer 1 : Value of the Top Buffer 2 : Value of the Bottom Buffer 3 : Direction of renko (0.0 for top ; 1.0 for bottom) Buffer 4 : Ratio of the renko, for example, if it is twice, 3 times, ro more of
What Is Market Imbalance? Market Imbalance, also known as "IPA" or Improper Price Action, is when price moves so quick in one direction with no orders on the other side of the market to mitigate the price movement. We all know Big Banks, or "Smart Money", can move the market by placing huge orders which in turn can move price significantly. They can do this because Big Banks are the  top 10 Forex traders in the world . But unfortunately, the Big Banks cannot leave these orders in drawdown and mu
All about time and price by ICT. This indicator provides a comprehensive view of ICT killzones, Silver Bullet times, and ICT Macros, enhancing your trading experience.  In those time windows price either seeks liquidity or imbalances and you often find the most energetic price moves and turning points. Features: Automatic Adaptation: The ICT killzones intelligently adapt to the specific chart you are using. For Forex charts, it follows the ICT Forex times: In EST timezone: Session: Asia: 20h00-0
Your Pointer is no ordinary Forex channel. This corridor is built on the basis of the analysis of several candles, starting from the last one, as a result of which the extremes of the studied interval are determined. They are the ones who create the channel lines. Like all channels, it has a middle line as well as a high and low line. This channel is worth watching for its unusual behavior. The use of the Your Pointer indicator allows the trader to react in time to the price going beyond the bo
This SMT (Smart Money Technique) divergence indicator identifies discrepancies in price movement between two different trading symbols, helping traders detect potential market reversals. This tool compares the price action of two correlated assets, such as two currency pairs or indices, to spot divergences where one asset's price moves in the opposite direction of the other. For example, while one symbol may be making higher highs, the other might be making lower highs, signaling a divergence. T
FREE
VI Vortex
Fernando Lahude Ritter
4.67 (3)
Description : Enhance Your Trading Strategy with the Advanced Vortex Indicator for MT5! Discover the power of the Vortex Indicator (VI), a robust technical analysis tool now available for MetaTrader 5. This custom-built indicator is designed to help traders identify trends and reversals, offering a critical edge in the dynamic Forex market. Key Features: Dynamic Trend Identification : With the VI's unique calculations of VI+ (positive) and VI- (negative) lines, you can easily spot trend strength
FREE
Based on the trading model/strategy/system of gold double-position hedging and arbitrage launched by Goodtrade Brokers, problems encountered in daily operations: 1. Account B immediately places an order immediately following account A. 2: After account A places an order, account B will automatically copy the stop loss and take profit. 3: Account A closes the position of Account B and closes the position at the same time. 4: When account B closes the position, account A also closes the position.
Advanced 4xZeovo MT5 Indicator (MetaTrader 5)   Product Description  4xZeovo is a powerful trading indicator system monitoring 24/7 financial markets. Metatrader5 tool designed to find the best buying/selling opportunities and notifies the user.    Making life easy for traders in helping with the two most difficult decisions with the use of advanced innovate trading indicators aiming to encourage users to hold the winning positions and take profit at the best times.    Equipped with a unique tra
This indicator uses a mathematical calculation algorithm . This algorithm calculates the remainder between the updated model and the actual values and produces the possible progress of the graph on the graph. It is not a super prophet in trading, but it is very good for the trader when entering the market and to analyze it before entering. Applicable for all currencies. Данный индикатор использует алгоритм математических вычислений . Данный алгоритм вычисляет остаток между обновленной моделью и
Trading patterns on Forex is considered to be the highest level of trading, since it usually requires years of mastering various patterns (shapes and candle combinations) and the ways they affect the price. Patterns are different combinations of Japanese candles on a chart, shapes of classical technical analysis, as well as any regularities of the market behavior repeating many times under the same conditions. After the patterns appear on a chart, the price starts behaving in a certain way allow
Auto Channel Trader
Ross Adam Langlands Nelson
The Auto Channel Trader creates a channel by plotting a line along the high points and low points of the chart, the EA then makes long trades near the bottom of the channel and short trades near the top of the channel. The channel is created by finding high points for the top line and low points for the bottom line, these points are shown with arrows. A line of best fit is then plotted through these points and extended until the end of the chart.  The length of the channel is determined by the M
Renko Chart
Marcin Konieczny
3.63 (8)
This indicator allows to display Renko charts in the indicator window. Renko charts show only price movements that are bigger than the specified box size. It helps to eliminate noise and allows to focus on main trends. Time is not a factor here. Only price movements are taken into account. That's why Renko chart is not synchronized with the main chart it is attached to. Indicator works in two modes: CLOSE - only close prices are taken into account while building the chart HIGH_LOW - only high/
FREE
Bands are a form of technical analysis that traders use to plot trend lines that are two standard deviations away from the simple moving average price of a security. The goal is to help a trader know when to enter or exit a position by identifying when an asset has been overbought or oversold. This indicator will show upper and lover bands. You can change input parameters nPeriod and  nMethod to calculate those bands for each timeframe. Aqua clouds represent up or down trends.
Trend Direction ADX indicator Trend Direction ADX is part of a serie of indicators used to characterize market conditions. Almost any strategy only work under certain market conditions. Therefore it is important to be able to characterize market conditions at any time: trend direction, trend strength, volatility, etc.. Trend Direction ADX is an indicator to be used to characterize trend direction: trending up trending down ranging Trend Direction ADX is based on ADX standard indicator.
PipFinite Strength Meter MT5
Karlo Wilson Vendiola
5 (1)
How To Determine If The Market is Strong Or Weak? Strength Meter uses an Adaptive Algorithm That Detect Price Action Strength In 4 Important Levels! This powerful filter gives you the ability to determine setups with the best probability. Features Universal compatibility to different trading systems Advance analysis categorized in 4 levels Level 1 (Weak) - Indicates us to WAIT. This will help avoid false moves Weak Bullish - Early signs bullish pressure Weak Bearish - Early signs bearish pre
KT Renko Live Chart utility creates the Renko charts on MT5 that can be further used for speculation or live trading. The Renko chart created by this utility supports most of the custom indicators and automated Expert Advisors. Fully compatible with our Renko Patterns indicator and Renko Patterns EA . Features A simple and straightforward Renko utility that provides the Renko chart on MT5 without any complicated settings. It supports most of the custom indicators and Expert Advisors for 100%
KT ROC Divergence MT5
KEENBASE SOFTWARE SOLUTIONS
KT ROC divergence shows the regular and hidden divergences build between the price and Rate of change oscillator. Rate of change (ROC) is a pure momentum oscillator that calculates the change of percentage in price from one period to another. It compares the current price with the price "n" periods ago. ROC = [(Close - Close n periods ago) / (Close n periods ago)] * 100 There is an interesting phenomenon associated with ROC oscillator. In ROC territory there is no upward limit, but there is a do
Gekko MACD Plus
Rodrigo Galeote
3 (3)
Type: Oscillator This is Gekko's Cutomized Moving Average Convergence/Divergence (MACD), a customized version of the famous MACD indicator. Use the regular MACD and take advantage of several entry signals calculations and different ways of being alerted whenever there is potential entry point. Inputs Fast MA Period: Period for the MACD's Fast Moving Average (default 12); Slow MA Period: Period for the MACD's Slow Moving Average (default 26); Signal Average Offset Period: Period for the Signal
The indicator is designed to work on any trading platform. The program is based on proprietary algorithms and W.D.Ganna's mathematics, allowing you to calculate target levels of price movement based on three points with the highest degree of certainty. It is a great tool for stock trading. The indicator has three buttons: NEW - call up a triangle for calculation. DEL - delete the selected triangle. DELS - completely remove all constructions. The probability of achieving the goals is more than 80
This indicator shows a candle combination based on dodge, dodge and pin bar. The logic of the pattern is to stand on the side of strength, after uncertainty. The indicator is universal and is useful for trading binary options, forex, ETFs, cryptocurrency, stocks. The indicator supports timeframes from M5 to MN, including non-standard TF presented in MT5. (М5,М6,М10,M12, M15, M20, M30, H1, H2, H3, H4, H6, H8, H12, D1, W1, MN). The ability to enable and disable TF is implemented. Sound alerts and
Golden Spikes Detector
Batsirayi L Marango
2.67 (3)
Golden Spikes Detector This indicator is based on an advanced strategy primarily for trading spikes on Boom and Crash Indices. Complex algorithms were implemented to detect high probability entries only. It alerts on potential Buy and Sell entries. To trade spikes on the Deriv or Binary broker, only take Buy Boom and Sell Cash alerts. It was optimised to be loaded on 5-minute timeframe although multiple timeframe analysis is done in the background. Features ·             Desktop pop up and sound
Increase trade accuracy with the time-tested cup and handle patterns The Cup and Handle pattern is a technical price formation that resembles a cup and handle, where the cup is in the shape of a "U" and the handle has a slight downward drift. The right-hand side of the pattern -the handle- is smaller than the left-hand side -cup-, and retraces no more than 50% from the top. It can be both a continuation and a reversal pattern.  [ Installation Guide | Update Guide | Troubleshooting | FAQ | All P
Double HMA MTF for MT5
Pavel Zamoshnikov
4 (4)
This is an advanced multi-timeframe version of the popular Hull Moving Average (HMA) Features Two lines of the Hull indicator of different timeframes on the same chart. The HMA line of the higher timeframe defines the trend, and the HMA line of the current timeframe defines the short-term price movements. A graphical panel with HMA indicator data from all timeframes at the same time . If the HMA switched its direction on any timeframe, the panel displays a question or exclamation mark with a tex
Vortex MT5
KEENBASE SOFTWARE SOLUTIONS
The Vortex Indicator was first presented by Douglas Siepman and Etienne Botes in January 2010 edition of Technical Analysis of Stocks & Commodities. Despite its based on a complex implosion phenomenon, the vortex is quite simple to interpret. A bullish signal is generated when +VI line cross above the -VI line and vice versa. The indicator is mostly used as a confirmation for trend trading strategies. The Vortex was inspired by the work of Viktor Schauberger, who studied the flow of water in tur
A machine translation from the English product description was used. We apologize for possible imprecisions. İngilizce ürün açıklamasından bir makine çevirisi kullanıldı. Olası yanlışlıklar için özür dileriz. Favori şamdan fiyat hareket kalıpları için bir görselleştirme sistemi. Eklendikten sonra, gösterge tablodaki sonraki kalıpları otomatik olarak işaretleyecektir: Pinokyo çubuğu  - çok iyi bilinen ters desenli uzun bir 'burnu' olan küçük gövdeli bir çubuk; İç çubuk  - aralığı önceki çubuğun a
The True Oversold Overbought indicator provides you with ability to swiftly check whether the asset is oversold or overbought.  Other than complementing your trading with True Oversold Overbought, you can use the indicator as your only trading system. It works with all forex instruments and will save you the headache of estimating when the market is due for a reversal or retracement.  When the "Super Charge" feature is enabled, the areas where the price is in oversold/overbought status are ampli
Cumulative Vol Bands
Thalles Nascimento De Carvalho
CVB Cumulative Volume Bands: Birikmiş Hacim ile İşlemlerinizi Güçlendirin! CVB Cumulative Volume Bands , birikmiş hacme dayalı kesin sinyaller arayan traderlar için tasarlanmış ileri düzey bir göstergedir. Birikmiş hacim bantlarını kullanarak, bu gösterge piyasanın alım ve satım baskılarının net okumasını sağlar ve dönüşleri ve güçlü fiyat hareketlerini tanımlamada yardımcı olur. Temel Özellikler: Birikmiş Hacim Analizi : Hacme dayalı baskı noktalarını tespit edin. Açık Giriş/
ATrend
Zaha Feiz
4.88 (8)
ATREND: Nasıl Çalışır ve Nasıl Kullanılır ### Nasıl Çalışır "**ATREND**" göstergesi, MT5 platformu için tasarlanmış olup, traderlara sağlam alım ve satım sinyalleri sağlamak amacıyla teknik analiz metodolojilerinin bir kombinasyonunu kullanır. Bu gösterge, öncelikle volatilite ölçümü için Ortalama Gerçek Aralık (ATR) kullanır ve potansiyel piyasa hareketlerini belirlemek için trend tespit algoritmalarıyla birleştirir. Satın aldıktan sonra bir mesaj bırakın ve özel bir bonus hediyesi kazanın. ##
Bu ürünün alıcıları ayrıca şunları da satın alıyor
TPSproTREND PrO MT5
Roman Podpora
4.83 (12)
TPSpro TREND PRO  - is a trend indicator that automatically analyzes the market and provides information about the trend and each of its changes, as well as giving signals for entering trades without redrawing! The indicator uses each candle, analyzing them separately. referring to different impulses - up or down impulse. Exact entry points into transactions for currencies, crypto, metals, stocks, indices!  Version MT4               DETAILED DESCRIPTION               R ecommended to use with an
TALİMATLAR         RUS   -        ENG       Bir gösterge ile kullanılması   önerilir       -       TPSpro   TREND PRO -   Sürüm MT4         Ticarette önemli bir unsur, bir ticaret aracını satın alma veya satma kararlarının alındığı bölgeler veya seviyelerdir. Büyük oyuncuların piyasadaki varlıklarını gizleme girişimlerine rağmen, kaçınılmaz olarak izler bırakırlar. Bizim görevimiz bu izleri nasıl tanımlayacağımızı ve doğru şekilde nasıl yorumlayacağımızı öğrenmekti. Ana işlevler:: Satıcılar ve
FX Power MT5 NG
Daniel Stein
4.75 (8)
FX Power NG'nin Tüm Gücünün Kilidini Açın: Nihai Para Birimi Güç Ölçer FX Power, sekiz yılı aşkın süredir dünya çapındaki yatırımcıları güvenilir ve hassas döviz gücü analizleriyle güçlendirmektedir. Şimdi, FX Power NG bu güvenilir aracı bir sonraki seviyeye taşıyarak, ticaretinize benzersiz doğruluk, özelleştirme ve içgörüler getiren gelişmiş özellikler sunuyor. FX Power NG'yi Ciddi Yatırımcılar İçin Olmazsa Olmaz Kılan Nedir? FX Power NG, orijinal FX Power'da sevdiğiniz her şeyi temel ekle
Öncelikle, bu Ticaret Sistemi'nin Non-Repainting, Non-Redrawing ve Non-Lagging Göstergesi olduğunu vurgulamak önemlidir, bu da hem manuel hem de robot ticareti için ideal hale getirir. Online kurs, kılavuz ve ön ayarları indir. "Smart Trend Trading System MT5", yeni ve deneyimli tüccarlar için özelleştirilmiş kapsamlı bir ticaret çözümüdür. 10'dan fazla premium göstergeyi birleştiriyor ve 7'den fazla sağlam ticaret stratejisi sunuyor, bu da çeşitli piyasa koşulları için esnek bir seçim yapar. Tr
FX Volume MT5
Daniel Stein
4.93 (14)
FX Hacmi ile Forex'te Gerçek Bir Avantaj Elde Edin: Nihai Hacim Göstergesi FX Volume, gerçek piyasa duyarlılığını içeriden bir bakış açısıyla ortaya koyan ilk ve tek hacim göstergesidir. FX Volume, kurumsal piyasa katılımcılarının ve brokerlerin nasıl konumlandıklarına dair benzersiz bilgiler sağlayarak, genellikle büyük oyuncular için ayrılmış öngörü ile ticaret yapmanıza olanak tanır. COT raporlarının gecikmelerine elveda deyin - FX Volume size bu önemli bilgileri anında grafiğinizde sunarak
Bu gösterge paneli, seçilen semboller için mevcut en son   harmonik kalıpları   gösterir, böylece zamandan tasarruf edersiniz ve daha verimli olursunuz /   MT4 sürümü . Ücretsiz Gösterge:   Basic Harmonic Pattern Gösterge sütunları Symbol :   seçilen semboller görünecektir Trend:   yükseliş veya düşüş Pattern :   desen türü (gartley, kelebek, yarasa, yengeç, köpekbalığı, cypher veya ABCD) Entry :   giriş fiyatı SL:   zararı durdur fiyatı TP1:   1. kar alma fiyatı TP2:   2. kar alma fiyatı
IVISTscalp5
Vadym Zhukovskyi
5 (6)
What's new about iVISTscalp5 forecast indicator (Version 10)? iVISTscalp5 is a unique nonlinear forecasting for a week ahead system for any financial instrument which executes fast scalping using time levels. iVISTscalp5 is a tool for easy study and understanding of financial market. 1) iVISTscalp5 forecast indicator has been completely rewritten into another programming language (C++), which has accelerated data loading and processing. As a result, a different graphical display of forecast
Gold Stuff mt5
Vasiliy Strukov
4.92 (171)
Gold Stuff mt5, özellikle altın için tasarlanmış bir trend göstergesidir ve herhangi bir finansal enstrümanda da kullanılabilir. Gösterge yeniden çizilmez ve gecikmez. Önerilen zaman dilimi H1. Ayarları ve kişisel bir bonusu almak için satın alma işleminden hemen sonra benimle iletişime geçin!  Güçlü Destek ve Trend Tarayıcı göstergemizin ücretsiz bir kopyasını pm'den alabilirsiniz. Ben!   AYARLAR Ok Çiz - açık kapalı. grafik üzerinde oklar çizmek. Uyarılar - sesli uyarılar kapalı. E-post
FX Seviyelerini Keşfedin: Ticarette Başarı için Nihai Destek ve Direnç Göstergeniz FX Levels bir destek ve direnç göstergesinden daha fazlasıdır; döviz çiftleri, endeksler, hisse senetleri veya emtialar olsun, tüm ticaret sembollerinde hassasiyet, güvenilirlik ve sorunsuz işlevsellik isteyen ciddi tüccarlar için oyunun kurallarını değiştirir. Kanıtlanmış Lighthouse yöntemi üzerine inşa edilen ve dinamik, gerçek zamanlı uyarlanabilirlik ile geliştirilen FX Levels, hassas kar hedefleri belirleme
Atomic Analyst MT5
Issam Kassas
4.28 (18)
Öncelikle belirtmek gerekir ki bu Ticaret Göstergesi Yeniden Çizim Yapmaz, Gecikmez ve Gecikme Göstermez, bu da hem manuel hem de robot ticareti için ideal hale getirir. Kullanıcı kılavuzu: ayarlar, girişler ve strateji. Atom Analisti, Piyasada Daha İyi Bir Avantaj Bulmak İçin Fiyatın Gücünü ve Momentumunu Kullanan PA Fiyat Hareketi Göstergesidir. Gürültüleri ve Yanlış Sinyalleri Kaldırmaya ve Ticaret Potansiyelini Artırmaya Yardımcı Olan Gelişmiş Filtrelerle Donatılmıştır. Birden fazla katmanl
Quantum TrendPulse
Bogdan Ion Puscasu
5 (4)
SuperTrend   ,   RSI   ve   Stochastic'in   gücünü tek bir kapsamlı göstergede birleştirerek işlem potansiyelinizi en üst düzeye çıkaran nihai işlem aracı olan   Quantum TrendPulse'u   tanıtıyoruz. Hassasiyet ve verimlilik arayan yatırımcılar için tasarlanan bu gösterge, piyasa trendlerini, momentum değişimlerini ve en uygun giriş ve çıkış noktalarını güvenle belirlemenize yardımcı olur. Temel Özellikler: SuperTrend Entegrasyonu:   Güncel piyasa trendlerini kolayca takip edin ve karlılık dalgası
TrendMaestro5
Stefano Frisetti
note: this indicator is for METATRADER4, if you want the version for METATRADER5 this is the link:  https://www.mql5.com/it/market/product/108106 TRENDMAESTRO ver 2.4 TRENDMAESTRO recognizes a new TREND in the bud, he never makes mistakes. The certainty of identifying a new TREND is priceless. DESCRIPTION TRENDMAESTRO identifies a new TREND in the bud, this indicator examines the volatility, volumes and momentum to identify the moment in which there is an explosion of one or more of these data a
Top indicator for MT5   providing accurate signals to enter a trade without repainting! It can be applied to any financial assets:   forex, cryptocurrencies, metals, stocks, indices .  Watch  the video  (6:22) with an example of processing only one signal that paid off the indicator! MT4 version is here It will provide pretty accurate trading signals and tell you when it's best to open a trade and close it. Most traders improve their trading results during the first trading week with the help of
Golden Trend Indicator MT5
Noha Mohamed Fathy Younes Badr
5 (2)
Golden Trend indicator  is The best indicator for predicting trend movement this indicator never lags and never repaints and never back paints    and give  arrow buy and sell    before the candle appear  and it will help you and  will make your trading decisions clearer its work on all currencies and  gold and crypto and all time frame This unique  indicator uses very secret algorithms to catch the  trends, so you can trade using this indicator and see the trend clear on charts  manual guide and
Tanıtım       Quantum Breakout PRO   , Breakout Bölgeleri ile ticaret yapma şeklinizi değiştiren çığır açan MQL5 Göstergesi! 13 yılı aşkın ticaret tecrübesine sahip deneyimli tüccarlardan oluşan bir ekip tarafından geliştirilmiştir.       Kuantum Breakout PRO       yenilikçi ve dinamik koparma bölgesi stratejisiyle ticaret yolculuğunuzu yeni zirvelere taşımak için tasarlanmıştır. Kuantum Breakout Göstergesi, size 5 kar hedefi bölgesi ile kırılma bölgelerinde sinyal okları ve kırılma kutusuna
FxaccurateLS
Shiv Raj Kumawat
WHY IS OUR FXACCCURATE LS MT5 THE PROFITABLE ? PROTECT YOUR CAPITAL WITH RISK MANAGEMENT Gives entry, stop and target levels from time to time. It finds Trading opportunities by analyzing what the price is doing during established trends. POWERFUL INDICATOR FOR A RELIABLE STRATEGIES We have made these indicators with a lot of years of hard work. It is made at a very advanced level. Established trends provide dozens of trading opportunities, but most trend indicators completely ignore them!
Matrix Arrow Indicator MT5
Juvenille Emperor Limited
5 (13)
Matrix Arrow Indicator MT5 ,   forex ,   emtialar ,   kripto   para birimleri ,   endeksler ,   hisse senetleri   gibi tüm sembollerde/araçlarda kullanılabilen   %100 yeniden boyamayan   çoklu zaman çerçevesi göstergesini izleyen benzersiz bir 10'u 1 arada trenddir.  Matrix Arrow Indicator MT5 , mevcut eğilimi erken aşamalarında belirleyecek ve aşağıdakiler gibi 10'a kadar standart göstergeden bilgi ve veri toplayacaktır: Ortalama Yönlü Hareket Endeksi (ADX) Emtia Kanal Endeksi (CCI) Klasik Hei
TPA True Price Action indicator reveals the true price action of the market makers through 100% non-repainting signals strictly at the close of a candle! TPA shows entries and re-entries, every time the bulls are definitely stronger than the bears and vice versa. Not to confuse with red/green candles. The shift of power gets confirmed at the earliest stage and is ONE exit strategy of several. There are available now two free parts of the TPA User Guide for our customers. The first "The Basics"
Quantum Trend Sniper
Bogdan Ion Puscasu
4.71 (49)
Tanıtım       Kuantum Trend Keskin Nişancı Göstergesi   , trend tersine dönmeleri belirleme ve ticaret yapma şeklinizi değiştiren çığır açan MQL5 Göstergesi! 13 yılı aşkın ticaret tecrübesine sahip deneyimli tüccarlardan oluşan bir ekip tarafından geliştirilmiştir.       Kuantum Trend Keskin Nişancı Göstergesi       trend dönüşlerini son derece yüksek doğrulukla belirlemenin yenilikçi yolu ile ticaret yolculuğunuzu yeni zirvelere taşımak için tasarlanmıştır. ***Kuantum Trend Keskin Nişancı Gö
AT Forex Indicator MT5
Marzena Maria Szmit
5 (5)
The AT Forex Indicator MT5 is a sophisticated trading tool designed to provide traders with a comprehensive analysis of multiple currency pairs. This powerful indicator simplifies the complex nature of the forex market, making it accessible for both novice and experienced traders. AT Forex Indicator uses advanced algorithms to detect trends, patterns and is an essential tool for traders aiming to enhance their forex trading performance. With its robust features, ease of use, and reliable signal
PZ Trend Trading MT5
PZ TRADING SLU
3.67 (3)
Capture every opportunity: your go-to indicator for profitable trend trading Special Offer: Purchase now to receive free bonuses worth $109! (Read more for details) Trend Trading is an indicator designed to profit as much as possible from trends taking place in the market, by timing pullbacks and breakouts. It finds trading opportunities by analyzing what the price is doing during established trends. [ Installation Guide | Update Guide | Troubleshooting | FAQ | All Products ] Trade financial
Bill Williams Advanced
Siarhei Vashchylka
5 (8)
Bill Williams Advanced is designed for automatic chart analysis using Bill Williams' "Profitunity" system. The indicator analyzes four timeframes at once. Manual (Be sure to read before purchasing) Advantages 1. Automatically analyzes the chart using the "Profitunity" system of Bill Williams. The found signals are placed in a table in the corner of the screen. 2. Equipped with a trend filter based on the Alligator indicator. Most of the system signals are recommended to be used only accordi
IX Power MT5
Daniel Stein
4.17 (6)
IX Power ile tanışın - ticaret hassasiyetinizi güçlendirmek için nihai araç! FX Power ile aynı rakipsiz doğrulukla tasarlanan IX Power, endeksler ve hisse senetlerinden emtialara, ETF'lere ve hatta kripto para birimlerine kadar her türlü işlem sembolünde uzmanlaşmanızı sağlar. Tüm favori varlıklarınızdaki kısa, orta ve uzun vadeli trendler hakkında kesin bilgilerle ticaretinizi yükseltmeye hazır olun. Neden IX Power'ı Seçmelisiniz? IX Power ile zamanlamanız keskinleşir ve daha akıllı, daha hı
PZ Day Trading MT5
PZ TRADING SLU
2.83 (6)
Effortless trading: non-repainting indicator for accurate price reversals Special Offer: Purchase now to receive free bonuses worth $60! (Read more for details) This indicator detects price reversals in a zig-zag fashion, using only price action analysis and a donchian channel. It has been specifically designed for short-term trading, without repainting or backpainting at all. It is a fantastic tool for shrewd traders aiming to increase the timing of their operations. [ Installation Guide | Upd
SS7Trader'ın Neural FX Indicator ile yapay zekanın gücünü keşfedin! Bu ileri düzey, yapay sinir ağlarıyla desteklenen araç, Forex, Hisse Senetleri, Kripto Para Birimleri, Endeksler ve XAUUSD gibi birçok piyasada işlemlerinizi optimize etmek için tasarlanmıştır. Güçlü göstergemiz, sabit kalan ve yeniden çizilmeyen net Alım ve Satım sinyalleri sunarak gerçek zamanlı olarak kendinize güvenerek karar almanızı sağlar. Neural FX Indicator , yalnızca MetaTrader 5 (MT5) platformunda kullanılabilir ve dü
Elliott Wave Trend was designed for the scientific wave counting. This tool focuses to get rid of the vagueness of the classic Elliott Wave Counting using the guideline from the template and pattern approach. In doing so, firstly Elliott Wave Trend offers the template for your wave counting. Secondly, it offers Wave Structural Score to assist to identify accurate wave formation. It offers both impulse wave Structural Score and corrective wave Structure Score. Structural Score is the rating to sh
Şimdi 147 $ (birkaç güncellemeden sonra 499 $ 'a yükseliyor) - Sınırsız Hesaplar (PC'ler veya Mac'ler) RelicusRoad Kullanım Kılavuzu + Eğitim Videoları + Özel Discord Grubuna Erişim + VIP Durumu PİYASAYA BAKMAK İÇİN YENİ BİR YOL RelicusRoad, forex, vadeli işlemler, kripto para birimleri, hisse senetleri ve endeksler için dünyanın en güçlü ticaret göstergesidir ve yatırımcılara kârlı kalmaları için ihtiyaç duydukları tüm bilgileri ve araçları sağlar. Başlangıç ​​seviyesinden ileri seviyey
Advanced Supply Demand MT5
Bernhard Schweigert
4.5 (14)
Herhangi bir Acemi veya Uzman Tüccar için En İyi Çözüm! Bu gösterge benzersiz, yüksek kaliteli ve uygun fiyatlı bir ticaret aracıdır çünkü bir dizi tescilli özelliği ve yeni bir formülü bir araya getirdik. Bu güncelleme ile çift zaman dilimi dilimlerini gösterebileceksiniz. Yalnızca daha yüksek bir TF gösteremeyeceksiniz, aynı zamanda TF grafiğini ve ARTIK daha yüksek TF'yi de gösterebileceksiniz: YUVARLAK BÖLGELERİ GÖSTERMEK. Tüm Arz Talebi tüccarları buna bayılacak. :) Önemli Bilgiler Açıkland
Blahtech Supply Demand MT5
Blahtech Limited
4.54 (13)
Was: $299  Now: $99   Supply Demand uses previous price action to identify potential imbalances between buyers and sellers. The key is to identify the better odds zones, not just the untouched ones. Blahtech Supply Demand indicator delivers functionality previously unavailable on any trading platform. This 4-in-1 indicator not only highlights the higher probability zones using a multi-criteria strength engine, but also combines it with multi-timeframe trend analysis, previously confirmed swings
Quantum Heiken Ashi PRO MT5
Bogdan Ion Puscasu
4.44 (9)
Quantum Heiken Ashi PRO ile   tanışın Pazar eğilimleri hakkında net bilgiler sağlamak üzere tasarlanan Heiken Ashi mumları, gürültüyü filtreleme ve yanlış sinyalleri ortadan kaldırma yetenekleriyle ünlüdür. Kafa karıştırıcı fiyat dalgalanmalarına veda edin ve daha sorunsuz, daha güvenilir bir grafik sunumuna merhaba deyin. Quantum Heiken Ashi PRO'yu gerçekten benzersiz kılan şey, geleneksel şamdan verilerini okunması kolay renkli çubuklara dönüştüren yenilikçi formülüdür. Kırmızı ve yeşil çubukl
Yazarın diğer ürünleri
MetaTrader 4 için UR_TradeManager UR_TradeManager ile ticaret potansiyelinizi maksimize edin, bu araç özellikle MetaTrader 4 platformu için tasarlanmış nihai ticaret geliştirme aracıdır. Kesinlik ve işlevsellik düşünülerek yapılan bu kapsamlı araç, piyasa analizi, icraat ve yönetim becerilerini yükseltmeyi amaçlayan yatırımcılar için vazgeçilmezdir. Ana Özellikler: Görsel Ticaret Gösterge Paneli : MetaTrader 4 çalışma alanınıza entegre edilmiş sofistike bir gösterge panelinden doğrudan ticaretle
UR Control Panel
Krzysztof Jan Debski
5 (2)
UR Kontrol Paneli   UR Control Panel, sizinle ÜCRETSİZ olarak paylaşmak istediğim bir araçtır. Ticaretimde bana yardımcı olan ve her gün piyasa taramamı artıran etkileşimli bir Panel. Umarım ihtiyaçlarınıza da uygundur! UR Kontrol Paneli nasıl kullanılır? Hareket ettirilebilir, yeniden boyutlandırılabilir bir çift paneldir ve şunları içerir: - Bunlardan biri, verilen zaman dilimindeki para biriminin gücünü gösterir. - Diğeri, aynı grafiği kullanarak seçeneklerin semboller ve zaman dilimle
FREE
UR Basket
Krzysztof Jan Debski
Sepet   Yapabileceğiniz en iyi şey, siparişlerinizi kayıplara dönüşmekten korumaktır. Artık rahatlayabilir ve UR Basket'in halletmesine izin verebilirsiniz. UR Sepeti kullanmanın avantajları: Tüm parametreler grafiğinizdeki grafik panelinde dinamik olarak değiştirilebilir - Parametreleri değiştirmek veya hangi ayarları kullandığınızı hatırlamak için EA'yı yeniden başlatmanız GEREKMEZ! Siparişlerinizi şu adresten takip edebilirsiniz:   - Sihirli sayı   - EA Yorumu   - Yukarıdakilerin ikisi
UR Sapma Gözlemcisi   UR DivergenceSpotter, uzun yıllara dayanan deneyimin sonucudur ve bazen en kolay yollar en iyisidir. Birkaç gösterge arasında iyi bir korelasyon vardır, ancak bunlar uyumsuz olduğunda - fiyat "yeniden ayarlamaya" çalışır - ve işte o anda UR DivergenceSpotter ile bir sinyal alırız. UR Divergence Spotter kullanmanın avantajları: parametre yok Mum oluşturulduktan sonra yeniden boyanmaz Sinyal artık geçerli olmadığında sinyal verir (bu, işleminizi daha uzun süre tutabile
UR VolumeTrend
Krzysztof Jan Debski
UR Hacim Eğilimi   UR VolumeTrend, hacim olarak devam eden trendi gösteren en net hacim göstergesidir. Yerel zirveleri ve dipleri işaret etmek için UR TrendExhaustion gibi diğer göstergelerle mükemmel şekilde çalışır. Yalnızca 2 parametreyle sınırlıdır - değerler ne kadar yüksek olursa, o kadar uzun trendler gösterir. Aşırı gradyanlar, potansiyel bir tersine dönüşü yakalamak için hacmin olası tükenmelerini gösterir. İki satır - Hacim eğilimi ve Ortalama. En iyi avantaj: Kolay ve tüm varlıkl
UR TrendExhaustion
Krzysztof Jan Debski
UR TrendTükenme   UR TrendExhaustion, parametre değerleri veya diğer kurulumlarla uğraşmak istemeyen tüccarlar için en iyi çözümdür - herkes için hem kolay hem de görsel olarak anlaşılırdır. UR TrendExhaustion kullanmanın avantajları: parametre yok Grafikte neler olup bittiğini en iyi açıklayan 3 satırınız var: Trend Tükenme Hattı, Balina Para Hattı ve Perakende Para Hattı. Arayüz, her iki uçta da (kırmızı alanlar) herhangi bir satırın tükenmesini gösterir. En iyi avantaj: Kolay ve tüm va
UR HighsAndLows
Krzysztof Jan Debski
UR Yüksekler ve Düşükler   UR Highs&Lows, fiyat hareketinin ve oynaklığının derinlemesine bir analizini yapar ve fiyatın içinde hareket ettiği bir kanal oluşturur. Bu kanal artık bir osilatör olarak hareket ediyor ve potansiyel tükenmeleri ve olası tersine dönüşleri işaret etmek için fiyat sapması ile kaplanıyor. UR Yüksekler ve Düşükler kullanmanın avantajları: parametre yok Fiyat hareketini tanımlayan 3 çizginiz var - fiyatın ortalaması olan Beyaz Çizgi ve uç noktaları olan Mavi Çizgile
UR Momenter
Krzysztof Jan Debski
UR Momenteri   UR Momenter, bir osilatör olarak temsil edilen fiyat hareketinin tükenmesiyle ilişkili olarak fiyatın momentumunu mükemmel bir şekilde hesaplar. Bu nedenle, bu bize potansiyel geri dönüşlerin veya geri çekilmelerin gerçekten erken sinyallerini verir. Bu formül, 2018'de pazar balonu patladıktan sonra keşfedildi. UR Momenter kullanmanın avantajları: parametre yok Fiyat hareketini tanımlayan 2 çizginiz var - Fiyatın hareketli ortalama sapmasına bağlı olarak fiyatın Momentumu o
UR FrontEndBackEnd
Krzysztof Jan Debski
UR Ön UçArka Uç   UR FrontEndBackEnd, en doğru destek ve direnç seviyelerini bulmak için en sevdiğim formüldür. Ayrıca ne kadar güçlü olduklarını işaretlemek için bunları farklı kategorilere (kesikli çizgiler, düz çizgiler ve alanlar) ayırdım. Tümü arabelleklerde saklanır, böylece diğer araçlara kolayca erişilebilir ve uygulanabilir. Ek: Aracın uygulandığı varlığa göre ayarlanması gerekebilir - varlığın aracı etkileyen fiyattaki basamak sayısı farklılık gösterir. Bunun için gerekli parametr
UR Gamma
Krzysztof Jan Debski
UR Gama (Makine Öğrenimi sistemlerinde bulunan benzer hesaplamalarla desteklenir) UR Gamma, klasik WaveTrend göstergesine yeni ve geliştirilmiş bir bakış açısı sunan son teknoloji bir finansal analiz aracıdır. UR Gamma, gelişmiş Dijital Sinyal İşleme tekniklerini birleştirerek, geleneksel WaveTrend algoritmalarının bazı sınırlamalarını giderir ve fiyat hareketindeki eğilimleri belirlemeye ve ölçmeye yönelik daha doğru, sağlam ve dinamik bir yaklaşım sağlar. UR Gamma kullanmanın avantajları:
UR Bands
Krzysztof Jan Debski
UR Bantları (Makine Öğrenimi sistemlerinde kullanılan bir Formül ile) UR Bantları, prensip olarak makine öğrenimi sistemlerinde kullanılanlara benzer olan piyasa oynaklığını içeren bir formül aracılığıyla türetilen bir göstergedir. Piyasa koşullarının bu matematiksel temsili, finansal piyasaların doğasında var olan oynaklığı hesaba katarak, fiyat eğilimlerinin ve dinamiklerinin kesin bir analizini sunar. Volatiliteyi bir değişken olarak dahil eden gösterge, piyasa koşullarının daha doğru ve g
UR Vortex
Krzysztof Jan Debski
UR Vortex The Probabilistic UR Vortex Formula: An Accurate System for Predictive Market Analysis using Volatility and Standard Deviation Calculations. The   UR Vortex   indicator is a technical analysis tool that uses volatility and standard deviation calculations to predict potential tops and bottoms in a market. It measures the strength of a trend by calculating the distance between the current price and a moving average, and then standardizing this distance by dividing it by the average true
UR PulseScalp
Krzysztof Jan Debski
UR PulseScalp  Hızlı tempolu piyasalarda en üst noktayı arayan kazıyıcılar için kalibre edilmiş bir ticaret göstergesi UR PulseScalp , hızlı tempolu pazarlarda en üst noktayı arayan kazıyıcılar için son teknoloji bir ticaret çözümüdür. Bu yenilikçi gösterge, son derece doğru ve güvenilir bir sinyal oluşturmak için Volatilite, MoneyFlow ve Relative Strength'in gücünü harmanlayan bilimsel olarak kalibre edilmiş bir formül üzerine kurulmuştur. UR PulseScalp kullanmanın avantajları: Konforlu
Sepet   Yapabileceğiniz en iyi şey, siparişlerinizi kayıplara dönüşmekten korumaktır. Artık rahatlayabilir ve UR Basket'in halletmesine izin verebilirsiniz. UR Sepeti kullanmanın avantajları: Tüm parametreler grafiğinizdeki grafik panelinde dinamik olarak değiştirilebilir - Parametreleri değiştirmek veya hangi ayarları kullandığınızı hatırlamak için EA'yı yeniden başlatmanız GEREKMEZ! Siparişlerinizi şu adresten takip edebilirsiniz:   - Sihirli sayı   - EA Yorumu   - Yukarıdakilerin ikisi
UR Sapma Gözlemcisi   UR DivergenceSpotter, uzun yıllara dayanan deneyimin sonucudur ve bazen en kolay yollar en iyisidir. Birkaç gösterge arasında iyi bir korelasyon vardır, ancak bunlar uyumsuz olduğunda - fiyat "yeniden ayarlamaya" çalışır - ve işte o anda UR DivergenceSpotter ile bir sinyal alırız. UR Divergence Spotter kullanmanın avantajları: parametre yok Mum oluşturulduktan sonra yeniden boyanmaz Sinyal artık geçerli olmadığında sinyal verir (bu, işleminizi daha uzun süre tutabile
UR VolumeTrend MT5
Krzysztof Jan Debski
UR Hacim Eğilimi   UR VolumeTrend, hacim olarak devam eden trendi gösteren en net hacim göstergesidir. Yerel zirveleri ve dipleri işaret etmek için UR TrendExhaustion gibi diğer göstergelerle mükemmel şekilde çalışır. Yalnızca 2 parametreyle sınırlıdır - değerler ne kadar yüksek olursa, o kadar uzun trendler gösterir. Aşırı gradyanlar, potansiyel bir tersine dönüşü yakalamak için hacmin olası tükenmelerini gösterir. İki satır - Hacim eğilimi ve Ortalama. En iyi avantaj: Kolay ve tüm varlıkl
UR TrendTükenme   UR TrendExhaustion, parametre değerleri veya diğer kurulumlarla uğraşmak istemeyen tüccarlar için en iyi çözümdür - herkes için hem kolay hem de görsel olarak anlaşılırdır. UR TrendExhaustion kullanmanın avantajları: parametre yok Grafikte neler olup bittiğini en iyi açıklayan 3 satırınız var: Trend Tükenme Hattı, Balina Para Hattı ve Perakende Para Hattı. Arayüz, her iki uçta da (kırmızı alanlar) herhangi bir satırın tükenmesini gösterir. En iyi avantaj: Kolay ve tüm va
UR HighsAndLows MT5
Krzysztof Jan Debski
UR Yüksekler ve Düşükler   UR Highs&Lows, fiyat hareketinin ve oynaklığının derinlemesine bir analizini yapar ve fiyatın içinde hareket ettiği bir kanal oluşturur. Bu kanal artık bir osilatör olarak hareket ediyor ve potansiyel tükenmeleri ve olası tersine dönüşleri işaret etmek için fiyat sapması ile kaplanıyor. UR Yüksekler ve Düşükler kullanmanın avantajları: parametre yok Fiyat hareketini tanımlayan 3 çizginiz var - fiyatın ortalaması olan Beyaz Çizgi ve uç noktaları olan Mavi Çizgile
UR Momenter MT5
Krzysztof Jan Debski
UR Momenteri   UR Momenter, bir osilatör olarak temsil edilen fiyat hareketinin tükenmesiyle ilişkili olarak fiyatın momentumunu mükemmel bir şekilde hesaplar. Bu nedenle, bu bize potansiyel geri dönüşlerin veya geri çekilmelerin gerçekten erken sinyallerini verir. Bu formül, 2018'de pazar balonu patladıktan sonra keşfedildi. UR Momenter kullanmanın avantajları: parametre yok Fiyat hareketini tanımlayan 2 çizginiz var - Fiyatın hareketli ortalama sapmasına bağlı olarak fiyatın Momentumu o
UR Ön UçArka Uç   UR FrontEndBackEnd, en doğru destek ve direnç seviyelerini bulmak için en sevdiğim formüldür. Ayrıca ne kadar güçlü olduklarını işaretlemek için bunları farklı kategorilere (kesikli çizgiler, düz çizgiler ve alanlar) ayırdım. Tümü arabelleklerde saklanır, böylece diğer araçlara kolayca erişilebilir ve uygulanabilir. Ek: Aracın uygulandığı varlığa göre ayarlanması gerekebilir - varlığın aracı etkileyen fiyattaki basamak sayısı farklılık gösterir. Bunun için gerekli parametr
UR Gamma MT5
Krzysztof Jan Debski
UR Gama (Makine Öğrenimi sistemlerinde bulunan benzer hesaplamalarla desteklenir) UR Gamma, klasik WaveTrend göstergesine yeni ve geliştirilmiş bir bakış açısı sunan son teknoloji bir finansal analiz aracıdır. UR Gamma, gelişmiş Dijital Sinyal İşleme tekniklerini birleştirerek, geleneksel WaveTrend algoritmalarının bazı sınırlamalarını giderir ve fiyat hareketindeki eğilimleri belirlemeye ve ölçmeye yönelik daha doğru, sağlam ve dinamik bir yaklaşım sağlar. UR Gamma kullanmanın avantajları:
UR Bands MT5
Krzysztof Jan Debski
UR Bantları (Makine Öğrenimi sistemlerinde kullanılan bir Formül ile) UR Bantları, prensip olarak makine öğrenimi sistemlerinde kullanılanlara benzer olan piyasa oynaklığını içeren bir formül aracılığıyla türetilen bir göstergedir. Piyasa koşullarının bu matematiksel temsili, finansal piyasaların doğasında var olan oynaklığı hesaba katarak, fiyat eğilimlerinin ve dinamiklerinin kesin bir analizini sunar. Volatiliteyi bir değişken olarak dahil eden gösterge, piyasa koşullarının daha doğru ve g
UR PulseScalp MT5
Krzysztof Jan Debski
UR PulseScalp MT5 Hızlı tempolu piyasalarda en üst noktayı arayan kazıyıcılar için kalibre edilmiş bir ticaret göstergesi UR PulseScalp MT5, hızlı tempolu pazarlarda en üst noktayı arayan kazıyıcılar için son teknoloji bir ticaret çözümüdür. Bu yenilikçi gösterge, son derece doğru ve güvenilir bir sinyal oluşturmak için Volatilite, MoneyFlow ve Relative Strength'in gücünü harmanlayan bilimsel olarak kalibre edilmiş bir formül üzerine kurulmuştur. UR PulseScalp MT5 kullanmanın avantajları:
MetaTrader 5 için UR_TradeManager UR_TradeManager ile ticaret potansiyelinizi maksimize edin, bu araç özellikle MetaTrader 4 platformu için tasarlanmış nihai ticaret geliştirme aracıdır. Kesinlik ve işlevsellik düşünülerek yapılan bu kapsamlı araç, piyasa analizi, icraat ve yönetim becerilerini yükseltmeyi amaçlayan yatırımcılar için vazgeçilmezdir. Ana Özellikler: Görsel Ticaret Gösterge Paneli : MetaTrader 4 çalışma alanınıza entegre edilmiş sofistike bir gösterge panelinden doğrudan ticaretle
Filtrele:
İnceleme yok
İncelemeye yanıt
Sürüm 1.10 2024.05.21
Readjusted calculations, boosted indicator's performance. Works with Strategy tester.