• Genel bakış
  • İncelemeler
  • Yorumlar (4)
  • Yenilikler

Tillson T3 TMA

TILLSON MOVING AVERAGE

TMA veya T3 indikatörü olarak da bilinir. Formülünde EMA ve DEMA kullanan ve 3. derece Binom açılımı ile hesaplanan bir hareketli ortalamadır.

Artıları;

1-      Diğer hareketli ortalamalarda karşılaşılan hatalı sinyalleri (sürekli çizilen zig zag) olabildiğinde azaltmıştır.

2-      Klasik hareketli ortalamalardaki görülen gecikmelerin önüne geçmiştir.

3-      Trendlerde çok başarılıdır

Eksileri

1-      Yatay piyasalarda etkili değildir.

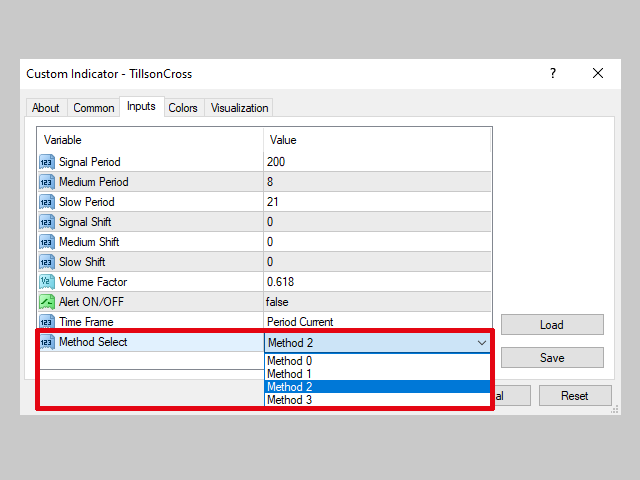
Parametrelerin ayarlanması;

Periyot; Tavsiye edilen değer 5 olsa da 7 veya 8 değerleri de kullanılabilmektedir.

Volume Factor; 0 ile 1 aralığı tavsiye edilen değer aralığı olmakla birlikte maksimum 2 ‘ye kadar çıkabilmektedir. Tavsiye edilen değer 0.7 ‘dir. Volume Factor ‘ün T3 ‘e etkisini daha basitçe anlatmak gerekirse 0 ‘a yakın değerler alırsa EMA ‘ya, 1 yakın değerleri alırsa DEMA ‘ya benzer davranışlar sergilemesini sağlayacaktır.

BUY/SELL Sinyalleri;

Method 1; 1 adet T3 ‘ün kullanıldığı bir strateji,

Volume Factor=0.7 iken Periyot=8 ve üstü değerler almalı

-          Barlar T3 ‘ü yukarı keserse BUY sinyal

-          Barlar T3 ‘ü aşağı keserse SELL sinyal

Methot 2; 2 adet T3 ‘ün kullanıldığı bir strateji,

-          Küçük Periyotlu T3 ‘ün büyük Periyotlu T3 ‘ü aşağıdan yukarı kesmesi BUY sinyal

-          Küçük Periyotlu T3 ‘ün büyük Periyotlu T3 ‘ü yukarıdan aşağıya kesmesi SELL sinyal

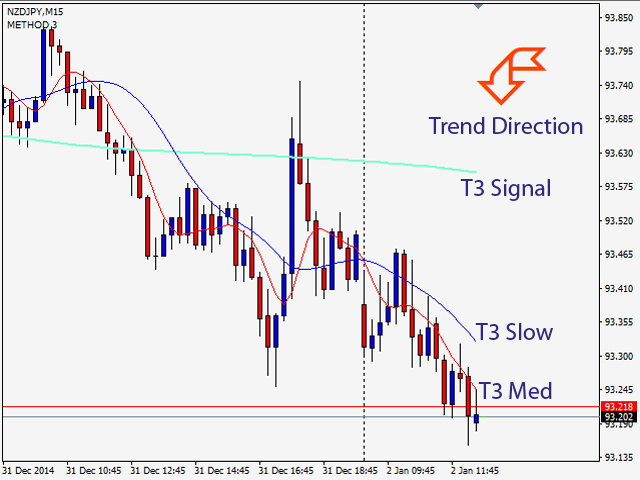
Methot 3; 3 adet T3 ‘ün kullanıldığı bir strateji,

Method 2 ‘ye trend yönü belirleyici üçüncü bir T3 ‘ün eklenmesinden oluşuyor. Varsayılan değerler; Periyot1=200, Periyot2=8, Periyot3=21 ve Volume Factor=0.7

            Periyot1=200 olan T3 trend yönü belirleyicisi olacak. Yani küçük periyotlu T3 ‘ler 200 ‘lük T3 ‘ün üzerinde iken trend yukarı olduğu kabul edilecek ve Methot 2 ye göre sadece BUY sinyaller dikkate alınacak. Aynı şekilde küçük periyotlu T3 ‘ler 200 ‘lük T3 ‘ün altında iken trendin yukarı olduğu kabul edilecek ve Methot 2 ye göre sadece SELL sinyaller dikkate alınacak.

İndikatör Varsayılan Değerleri;

T3Sinyal;         Periyot; 200   Renk; Açık yeşil

T3Med;            Periyot; 8   Renk; Kırmızı

T3Slow;           Periyot; 21  Renk; Mavi

Önerilen ürünler
BPR and SFP Indicator for ICT Trading on MT4 The BPR + SFP Indicator integrates two highly effective trading concepts: Breakout and Retest (BPR) and Swing Failure Pattern (SFP) . This combination enables traders to assess market strength and pinpoint optimal entry opportunities with greater accuracy. By analyzing price action and market reactions at significant levels, this indicator helps identify swing failures, breakouts, confirmations, and retracements. It offers clear visual alerts through
FREE
This indicator is producing accurate signal based on distances between crossection     point of 571 period moving average with 632 period bollinger band and 17 moving average and 171 moving average.     You can also use this signal with expert advisor with below code      double v1= 0 ;     v1= GlobalVariableGet ( Symbol ()+ string ( Period ())+ "HSKPASHAVO1" );      if (v1== 0 )   return ( 0 ); // No Signals      if (v1== 1 )        {        //Send BUY Order...        GlobalVariableSet ( Symbo
Lampropeltis
Vladimir Blednov
4.5 (4)
Lampropeltis is a trend indicator. The algorithm of calculation is based on data from the standard indicators included in the MT4 package and interpretation of patterns formed by these indicators. The settings include a minimum set of parameters: Slow MA - slow MA period; Slow MA method - slow MA smoothing method; Fast MA - fast MA period; Fast MA method - fast MA smoothing method. Change of the signal color to red indicates the possibility of opening a Sell order. Change of the signal color to
FREE
Precision Swing Point Indicator PSP ICT Quarterly Theory MT4 The Precision Swing Point Indicator PSP ICT Quarterly Theory MT4 integrates three key market indices—Dow Jones Index, Nasdaq 100 Index, and S&P 500—alongside three well-established candlestick formations: Doji, 50% body candles, and Shooting Star. This tool is designed to help traders pinpoint both trend continuations and reversals with greater accuracy.   Precision Swing Point Indicator Specifications Table Category Pivot Point and Fr
FREE
Multi RsIBB MT4
Mansour Babasafary
4 (2)
A combined indicator of two famous indicators: RSI , Bollinger Bands Can be used in all currency pairs Can be used in all time frames with many signals Very simple and fast to use Description: This indicator is made from the combination of RSI and Bollinger Bands indicators As you can see, it shows good signals and is worth using and testing We hope you are satisfied with this indicator Settings: show past show candle: Displays the number of candles that the indicator calculates. For example
FREE
This indicator idea comes from Tushar Chande called Qstick. Technical indicators quantify trend direction and strength in different ways. One way is to use the difference between close and open for each bar and to sum it up over a period of time. The formual is: Qstick (period ) = Average ((close-open ), period ) In this indicator, we can choose how to calculate body by two famous chart types. The first and default indicator settings are based on Heiken Ashi chart, and the second is based
FREE
Ind Gap detector mt4
Mauricio Valbuena
5 (3)
GAP DETECTOR FVG in trading refers to "Fair Value Gap", . It is a concept used in technical analysis to identify areas on a price chart where there is a discrepancy or gap between supply and demand. These gaps can occur due to rapid movements in price, usually as a result of important news or economic events, and are usually filled later as the market stabilizes. The GAP DETECTOR indicator is designed to identify fair value gaps (FVG) on the price chart and filter them using volatility to dete
FREE
XAMD/AMDX Indicator ICT MT4 The XAMD/AMDX ICT indicator is a specialized tool for MetaTrader 4, designed to highlight possible market trend shifts. It segments price movement into three distinct phases—Accumulation (red), Distribution (blue), and Manipulation (green)—using a color-coded box system. Unlike the traditional AMD ICT indicator, this version introduces an additional "X" phase, which serves as a marker for either trend continuation or reversal. XAMD/AMDX Indicator Specifications Bel
FREE
Индикатор сглаженного DeMarker  Oscillator (xDeM) Входные параметры: Period - период усреднения Принцип работы Индикатор перерассчитывает стандартный технический индикатор DeMarker Oscillato r (дважды усредняет получаемые значения). Период усреднения индикатора соответствует двойному периоду стандартного DeMarker  Oscillato r . Например : xDeM с периодом усреднения 7 соответствует DeM c периодом 14. Индикаторный буфер не перерисовывается.
FREE
An improved version of the standard Standard Deviation indicator. It is now a responsive and smoothed line. The setup is not straightforward - but I hope you can do it. It is very easy to understand the readings of this indicator, the meaning is the same as that of the usual Standard Deviation. //////////////////////////////////////////////// /////////////////////////////////// I hope this indicator will be very useful to you in successful trading. Good luck.
FREE
MA Crosses Show
Faran Ataeiraveshti
Hello.  Another free indicator from Sepehr! ;) You can determine the trend with this tool. Using crosses of two Moving averages, you can say that the trend is going to be bullish or bearish; A fast-moving average and a slow one. When the fast-moving crosses up the slow-moving, it's going to be an uptrend and when it crosses down the slow-moving, it means that you are going to have a downtrend. That's easy ;) Hope to enjoy it Sepehr(Faran)
FREE
MACD divergence indicator finds divergences between price chart and MACD indicator and informs you with alerts (popup, mobile notification or email). Its main use is to find trend reversals in the chart. Always use the divergence indicators with other technical assets like support resistance zones, candlestick patterns and price action to have a higher possibility to find trend reversals. Three confirmation type for MACD divergences: MACD line cross zero level Price returns to previous H/L Creat
FREE
RaysFX Stochastic  L'indicatore RaysFX Stochastic è un indicatore personalizzato per la piattaforma MetaTrader 4. Caratteristiche principali: -Indicatori separati: L'indicatore viene visualizzato in una finestra separata sotto il grafico principale. -Livelli dell'indicatore: L'indicatore ha due livelli predefiniti, 20 e 80, che possono essere utilizzati come livelli di ipervenduto e ipercomprato. -Buffer dell'indicatore: L'indicatore utilizza quattro buffer per calcolare e memorizzare i suoi
FREE
Donchian channels are a tool in technical analysis used to determine the relative volatility of a market and the potential for price breakouts. Can help identify potential breakouts and reversals in price, which are the moments when traders are called on to make strategic decisions. These strategies can help you capitalize on price trends while having pre-defined entry and exit points to secure gains or limit losses. Using the Donchian channel can thus be part of a disciplined approach to managi
FREE
StarBody
Gabriele Tedeschi
StarBody è un indicatore istogramma che rappresenta la dimensione delle candele in relazione al loro volume ed evidenzia quelle più grandi delle precedenti. La formula per il calcolo dell'altezza dell'istogramma è semplice quanto efficace: Ampiezza * Volume La grafica indicherà tutte le candele più estese delle precedenti in base alle impostazioni scelte. L'indicatore può essere utile, a volte indispensabile, nelle strategie che prevedono lo sfruttamento della continuazione del trend. Le strate
FREE
MWC Ratio
Joerg Hamann
4 (1)
The Commitments of Traders Ratio Indicator is one of these things you never thought about it before you really see the magic behind it. The indicator shows the Ratio of long/short positions released by the CFTC once a week. If you have a look on the Sreenshot you can see two (three) zones of interest. Zone 1: The Switches (Red -> Green, Green -> Red) Zone 2: MA cross Zone 3: If you combine this with the COX indicator an additional zone will appear. You also can experiment with Ratio crossing MA
FREE
SMT Divergence EU-GU-DXY Indicator MT4 The SMT Divergence EU-GU-DXY Indicator for MetaTrader 4 is a powerful analytical tool designed to detect price divergence among three major Forex pairs. It identifies discrepancies between EUR/USD, GBP/USD, and the U.S. Dollar Index (DXY), highlighting potential trading opportunities through color-coded signals.   Specifications of the SMT Divergence EU-GU-DXY Indicator The following table presents the core features and specifications of this indicator: Cat
FREE
The product   Divergence Cci Force Stddev Ac Atr   is designed to find the differences between indicators and price. It allows you to open orders or set trends using these differences. The indicator has 4 different divergence features. Divergence types Class A Divergence Class B Divergence Class C Divergence Hidden Divergence Product Features and Rec ommendations There are 5 indicators on the indicator Indicators =   CCI, Force, Stdandard Deviation, Acelereator, Atr 4 different divergence type
FREE
MACD Signals Dashboard
Mihails Babuskins
4 (4)
Download directly the indicator file here. (if you can't open on MT4) MACD Indicator is one of the most popular momentum indicators among users. Searching and detecting MACD signals by the eye may not be easy. Scan Full Charts Dashboard Indicator with simple user interface and search customization panel saves time and scans all charts for MACD signals search and notifies the user with high accuracy. After finding the signal, the user was aware of the result by alerts and notifications. This ind
FREE
Ichimoku wave
Bardia Mohammadi
For all those traders interested or currently trading Ichimoku, you will not want to miss this article. Although I am heading out in a few hours with my girlfriend to Harbin Hot Springs, I wanted to write a brief introduction to   Ichimoku Number Theory   as there has been a lot of questions (and confusion) about Ichimoku settings, time frames, etc. The basis of Ichimoku as known to most is the 5 lines; Tenkan Line Kijun Line Senkou Span A (part of the Kumo) Senkou Span B (other part of the Kum
FREE
CISD and Price Gap Openings Indicator MT4 The CISD CSD + Price Gap Openings Indicator is designed to highlight price gaps while marking the CISD level, providing insights into potential market reversals. This MetaTrader 4 tool, based on ICT principles, utilizes arrow markers to assist traders in recognizing fresh price gaps and possible retracement zones.   CISD – CSD + Price Gap Openings Indicator Specifications The following table outlines the features of the CISD – CSD + Price Gap Openings In
FREE
Bitcoin   Trader   Pro   is   an   advanced   tool   designed   for   technical   analysis   and   trading   of   Bitcoin   (   BTC/USD)   using   the   MetaTrader   4   (MT4)   platform   .   This   indicator   integrates   several   technical   indicators   to   provide   accurate   trading   signals   based   on   multiple   timeframes   . Main features   : Simple Moving Average (SMA)   **: Calculates SMA for 5-minute, 15-minute, 30-minute, 1-hour, 4-hour and daily (D1) periods, providing a
Trend Based Fibo MT4
Nguyen Tuan Son
4 (2)
The most Flexible & Reliable   Trend-Based Fibonacci indicator by Safe Trading. This indicator helps you calculate Trend-Based Fibonacci levels base on the main and retracement trends to predict future price . If you just looking for a powerful indicator, please check this   Timeframes Trend Scanner indicator ### FEATURES ### Auto-calculate up to 7 Trend-Based Fibonacci levels on adjustable frame. Adjust Fibonacci levels as your need. Adjust the start and the end of calculated frame in indicator
FREE
This semaphore indicator is based in the standard RSI, which is applied over the Envelopes indicator that shows an envelope or envelope fluctuation borders. This is a version of RSI vs Envelopes drawn in the symbol window . A sell signal emerges when the upper envelope/border is broken by the RSI indicator from top to bottom. A buy signal emerges when the lower envelope/border is broken by the RSI indicator from bottom upwards. The indicator can draw arrows on the indicator, draw vertical lines
FREE
AWTime Indicator
Komang Putra Riswanjaya
Overview The Time Trading Indicator AWT is designed for traders who often miss or overlook their trading opportunities. This tool helps users stay on top of their trading windows by providing timely alerts. Key Features User-friendly interface: Simple and intuitive design for easy navigation. Easy to use:   Set it up quickly and start receiving notifications instantly. Alert and Push Notifications:   Stay informed with real-time alerts and push notifications. Customizable Objects:   Adjust the
FREE
This indicator is designed to find the difference in MOMENTUM price and indicator.  This indicator shows the price and indicator difference on the screen. The user is alerted with the alert sending feature. Our Popular Products Super Oscillator HC Cross Signal Super Cross Trend Strong Trend Super Signal Parameters divergenceDepth -  Depth of 2nd ref. point search Momentum_Period -  Second calculation period indAppliedPrice -  Applied price of indicator indMAMethod -  MA calculation method findEx
FREE
This indicator is using two moving average , signal will be crated according to preset points on two Moving Average. In general, First signal is immadiate entrence and second order is limit order. color IndLevelColor=clrYellow;  // Indicator Level Color extern int   ArrowGap=35; // Close+-Arrow Gap Pips extern int   SecondOrderEntryLevelPips=500;// Second Limit Order Entry Level Pips extern int   HareketliOrtalamaGiris1=5; // 1. Moving Average extern int   HareketliOrtalamaGiris2=35;// 2. Moving
CCI Jurik
Augustine Kamatu
Introducing CCI Jurik—a dynamic indicator designed to elevate your forex trading experience by integrating custom moving averages based on the Commodity Channel Index (CCI) with the MetaTrader 4 indicator, CCI. Jurik moving averages are renowned for their accuracy and reliability in analyzing price movements in the forex market. They offer traders a smoother representation of price action, reducing noise and providing clearer signals for identifying trends and potential reversals. The Commodi
FREE
This indicator allows to hide Ichimoku Kinko Hyo (on all MT4 timeframes) from a date define by the user, with a vertical line (Alone) or a panel (with "Hidden Candles"). Indicator Inputs: Tenkan-sen Kijun-sen  Senkou Span B Information on "Ichimoku Kinko Hyo" indicator is available here:   https://www.metatrader4.com/en/trading-platform/help/analytics/tech_indicators/ichimoku ************************************************************* Hey traders!!  Give me your feeds!  We are a community here
FREE
Индикатор отображает размер бара и его направление. ---------------------------------------- Цвета гистограммы: * Красный - Медвежий бар. * Зелёный - Бычий бар. * Серый - Цена открытия и цена закрытия равны. * Синяя линия - скользящая средняя. ---------------------------------------- Параметры: - Type of Calculation - Тип расчёта ( Low to High, Open to Close ) - Moving Avarage - Период скользящей средней
FREE
Bu ürünün alıcıları ayrıca şunları da satın alıyor
Gann Made Easy
Oleg Rodin
4.8 (116)
Gann Made Easy , bay teorisini kullanarak ticaretin en iyi ilkelerine dayanan, profesyonel ve kullanımı kolay bir Forex ticaret sistemidir. WD Gann. Gösterge, Zararı Durdur ve Kâr Al Seviyeleri dahil olmak üzere doğru SATIN AL ve SAT sinyalleri sağlar. PUSH bildirimlerini kullanarak hareket halindeyken bile işlem yapabilirsiniz. Lütfen satın aldıktan sonra benimle iletişime geçin! Alım satım ipuçlarımı ve harika bonus göstergelerini ücretsiz olarak sizinle paylaşacağım! Muhtemelen Gann ticaret y
Gold Stuff
Vasiliy Strukov
4.86 (253)
Gold Stuff, özellikle altın için tasarlanmış bir trend göstergesidir ve herhangi bir finansal enstrümanda da kullanılabilir. Gösterge yeniden çizilmez ve gecikmez. Önerilen zaman dilimi H1. Bu göstergede tam otomatik Uzman Danışman EA Gold Stuff çalışır. Profilimde bulabilirsiniz. Ayarları ve kişisel bir bonusu almak için satın alma işleminden hemen sonra benimle iletişime geçin!  Güçlü Destek ve Trend Tarayıcı göstergemizin ücretsiz bir kopyasını pm'den alabilirsiniz. Ben! AYARLAR Ok Çiz -
Enigmera
Ivan Stefanov
5 (7)
ENIGMERA: Pazarın Kalbi Önemli: MQL5.com demosu Strategy Tester'da çalışır ve Enigmera'nın tüm işlevlerini tam olarak yansıtmayabilir. Daha fazla bilgi için açıklamayı, ekran görüntülerini ve videoyu kontrol edin. Herhangi bir sorunuz varsa, bana mesaj göndermekten çekinmeyin! Göstergenin kodu tamamen yeniden yazılmıştır. 3.0 sürümü, yeni işlevler ekler ve göstergenin başlangıcından bu yana biriken hataları giderir. Giriş Bu gösterge ve ticaret sistemi, finansal piyasalara dikkat çekici bir ya
M1 Arrow
Oleg Rodin
5 (17)
Piyasanın iki temel ilkesine dayanan bir gün içi stratejisi. Algoritma, ek filtreler kullanarak hacimlerin ve fiyat dalgalarının analizine dayanmaktadır. Göstergenin akıllı algoritması, yalnızca iki piyasa faktörü bir araya geldiğinde bir sinyal verir. Gösterge, daha yüksek zaman çerçevesinin verilerini kullanarak M1 grafiğinde belirli bir aralıktaki dalgaları hesaplar. Ve dalgayı doğrulamak için gösterge, hacme göre analizi kullanır. Bu gösterge hazır bir ticaret sistemidir. Bir tüccarın ihtiya
Scalper Inside PRO
Alexey Minkov
4.76 (63)
!SPECIAL SALE! An exclusive indicator that utilizes an innovative algorithm to swiftly and accurately determine the market trend. The indicator automatically calculates opening, closing, and profit levels, providing detailed trading statistics. With these features, you can choose the most appropriate trading instrument for the current market conditions. Additionally, you can easily integrate your own arrow indicators into Scalper Inside Pro to quickly evaluate their statistics and profitability
Size mükemmel bir teknik gösterge olan Grabber’ı tanıtıyorum. Bu araç, kullanıma hazır bir “her şey dahil” işlem stratejisi olarak çalışır. Tek bir yazılım kodu içinde güçlü piyasa teknik analiz araçları, işlem sinyalleri (oklar), uyarı işlevleri ve push bildirimleri entegre edilmiştir. Bu göstergeyi satın alan herkes aşağıdaki hediyeleri ücretsiz olarak alır: Açık emirleri otomatik yönetmek için Grabber Yardımcı Aracı Kurulum, yapılandırma ve nasıl işlem yapılacağını adım adım anlatan video kıl
Dynamic Forex28 Navigator
Bernhard Schweigert
5 (5)
Dynamic Forex28 Navigator - Yeni Nesil Forex Ticaret Aracı. ŞU ANDA %49 İNDİRİM. Dynamic Forex28 Navigator, uzun zamandır popüler olan göstergelerimizin evrimidir ve üçünün gücünü tek bir göstergede birleştirir: Gelişmiş Döviz Gücü28 Göstergesi (695 inceleme) + Gelişmiş Döviz İMPULS ve UYARI (520 inceleme) + CS28 Kombo Sinyalleri (Bonus). Gösterge hakkında ayrıntılar https://www.mql5.com/en/blogs/post/758844 Yeni Nesil Güç Göstergesi Ne Sunuyor?  Orijinallerde sevdiğiniz her şey, şimdi yeni
Scalper Vault
Oleg Rodin
5 (29)
Scalper Vault , başarılı bir scalping için ihtiyacınız olan her şeyi size sağlayan profesyonel bir scalping sistemidir. Bu gösterge, forex ve ikili opsiyon tüccarları tarafından kullanılabilecek eksiksiz bir ticaret sistemidir. Önerilen zaman çerçevesi M5'tir. Sistem size trend yönünde doğru ok sinyalleri sağlar. Ayrıca size üst ve alt sinyaller ve Gann piyasa seviyeleri sağlar. Göstergeler, PUSH bildirimleri dahil her türlü uyarıyı sağlar. Göstergeyi satın aldıktan sonra lütfen benimle iletişim
FX Volume
Daniel Stein
4.59 (34)
FX Volume: Bir Broker’ın Perspektifinden Gerçek Piyasa Duyarlılığını Deneyimleyin Kısa Özet Trading yaklaşımınızı bir adım öteye taşımak ister misiniz? FX Volume , perakende traderlar ile brokerların nasıl konumlandığını gerçek zamanlı olarak sunar—COT gibi gecikmeli raporlardan çok daha önce. İster istikrarlı kazançları hedefliyor olun, ister piyasada daha güçlü bir avantaj arayın, FX Volume önemli dengesizlikleri belirlemenize, kırılmaları (breakout) doğrulamanıza ve risk yönetiminizi iyileş
Trend Screener
STE S.S.COMPANY
4.78 (93)
Trend Göstergesi, Trend Alım Satım ve Filtreleme için Çığır Açan Benzersiz Çözüm, Tüm Önemli Trend Özellikleriyle Tek Bir Araç İçinde Yerleştirildi! Forex, emtialar, kripto para birimleri, endeksler ve hisse senetleri gibi tüm sembollerde/araçlarda kullanılabilen %100 yeniden boyamayan çoklu zaman çerçevesi ve Çoklu para birimi göstergesidir. SINIRLI SÜRELİ TEKLİF: Destek ve Direnç Tarama Göstergesi sadece 50$ ve ömür boyu mevcuttur. (Orijinal fiyat 250$) (teklif uzatıldı) Trend Screener, grafik
Golden Trend Indicator
Noha Mohamed Fathy Younes Badr
4.9 (10)
Golden Trend indicator  is The best indicator for predicting trend movement this indicator never lags and never repaints and never back paints    and give  arrow buy and sell    before the candle appear  and it will help you and  will make your trading decisions clearer its work on all currencies and  gold and crypto and all time frame This unique  indicator uses very secret algorithms to catch the  trends, so you can trade using this indicator and see the trend clear on charts  manual guide and
FX Power MT4 NG
Daniel Stein
4.94 (18)
FX Power: Daha Akıllı Ticaret Kararları için Para Birimlerinin Gücünü Analiz Edin Genel Bakış FX Power , her piyasa koşulunda başlıca para birimlerinin ve altının gerçek gücünü anlamak için vazgeçilmez bir araçtır. Güçlü para birimlerini alıp zayıf olanları satarak, FX Power ticaret kararlarınızı basitleştirir ve yüksek olasılıklı fırsatları ortaya çıkarır. İster trendlere sadık kalın ister Delta'nın aşırı değerlerini kullanarak tersine dönüşleri öngörün, bu araç ticaret tarzınıza mükemmel bir
Apollo Secret Trend , herhangi bir çift ve zaman dilimindeki trendleri bulmak için kullanılabilecek profesyonel bir trend göstergesidir. Gösterge, işlem yapmayı tercih ettiğiniz çift veya zaman dilimi ne olursa olsun, piyasa trendlerini tespit etmek için kullanabileceğiniz birincil işlem göstergeniz olabilir. Göstergede özel bir parametre kullanarak sinyalleri kişisel ticaret tarzınıza uyarlayabilirsiniz. Gösterge, PUSH bildirimleri dahil her türlü uyarıyı sağlar. Göstergenin sinyalleri YENİDEN
- Lifetime update free Contact me for instruction, add group and any questions! Related Products:  Bitcoin Expert , Gold Expert - Non-repaint - I just sell my products in Elif Kaya profile, any other websites are stolen old versions, So no any new updates or support. Introduction The breakout and retest strategy is traded support and resistance levels. it involves price breaking through a previous level.  The break and retest strategy is designed to help traders do two main things, the first is
Algo Pumping MT4
Ihor Otkydach
5 (2)
PUMPING STATION – Kişisel “her şey dahil” stratejiniz Karşınızda PUMPING STATION — forex dünyasında işlem yapma şeklinizi heyecan verici ve etkili bir sürece dönüştürecek devrim niteliğinde bir gösterge. Bu sadece bir yardımcı değil, güçlü algoritmalarla donatılmış tam teşekküllü bir ticaret sistemidir ve daha istikrarlı işlem yapmanıza yardımcı olur. Bu ürünü satın aldığınızda ŞUNLARI ÜCRETSİZ olarak alırsınız: Özel ayar dosyaları: Otomatik kurulum ve maksimum performans için. Adım adım video e
Easy Breakout
Mohamed Hassan
5 (10)
After your purchase, feel free to contact me for more details on how to receive a bonus indicator called VFI, which pairs perfectly with Easy Breakout for enhanced confluence!   Easy Breakout is a powerful price action trading system built on one of the most popular and widely trusted strategies among traders: the Breakout strategy ! This indicator delivers crystal-clear Buy and Sell signals based on breakouts from key support and resistance zones. Unlike typical breakout indicators, it levera
TPSproTREND PrO
Roman Podpora
4.68 (25)
VERSION MT5        —        ИНСТРУКЦИЯ RUS           —        INSTRUCTIONS  ENG Ana işlevler: VERME OLMADAN doğru giriş sinyalleri! Bir sinyal belirirse, alakalı kalır! Bu, bir sinyal sağlayıp daha sonra onu değiştirebilen ve mevduatta fon kaybına yol açabilen yeniden çekme göstergelerinden önemli bir farktır. Artık pazara daha büyük bir olasılık ve doğrulukla girebilirsiniz. Ayrıca, ok göründükten sonra hedefe ulaşılıncaya kadar (kar al) veya bir geri dönüş sinyali görünene kadar mumları renkl
Gold Venamax MT4
Sergei Linskii
5 (1)
Gold Venamax   - bu en iyi hisse senedi teknik göstergesidir. Gösterge algoritması bir varlığın fiyat hareketini analiz eder ve oynaklığı ve potansiyel giriş bölgelerini yansıtır. Gösterge özellikleri: Bu, rahat ve karlı ticaret için Magic ve iki Blok trend oku içeren süper bir göstergedir. Grafikte blokları değiştirmek için Kırmızı Düğme görüntülenir. Magic, gösterge ayarlarında ayarlanır, böylece göstergeyi farklı Blokları görüntüleyen iki grafiğe yükleyebilirsiniz. Gold Venamax farklı ok tam
Volatility Trend System - girişler için sinyaller veren bir ticaret sistemi. Oynaklık sistemi, trend yönünde doğrusal ve noktasal sinyaller ve ayrıca yeniden çizme ve gecikme olmaksızın trendden çıkmak için sinyaller verir. Trend göstergesi, orta vadeli trendin yönünü izler, yönünü ve değişimini gösterir. Sinyal göstergesi volatilitedeki değişikliklere dayalıdır ve piyasa girişlerini gösterir. Gösterge, çeşitli uyarı türleri ile donatılmıştır. Çeşitli alım satım araçlarına ve zaman dilimlerine
Şu anda %20 İNDİRİMLİ! Herhangi bir Acemi veya Uzman Tüccar için En İyi Çözüm! Bu gösterge paneli yazılımı 28 döviz çifti üzerinde çalışıyor. Ana göstergelerimizden 2'sine (Gelişmiş Para Birimi Gücü 28 ve Gelişmiş Para Birimi Dürtüsü) dayanmaktadır. Tüm Forex piyasasına harika bir genel bakış sağlar. Gelişmiş Para Birimi Gücü değerlerini, para birimi hareket hızını ve tüm (9) zaman dilimlerinde 28 Forex çifti için sinyalleri gösterir. Trendleri ve / veya scalping fırsatlarını belirlemek için
Özel MT4 göstergemizle başarılı forex ticaretinin sırrını keşfedin! Forex piyasasında nasıl başarıya ulaşacağınızı hiç merak ettiniz, riski en aza indirirken sürekli olarak kar kazandınız mı? İşte aradığınız cevap! Ticaret yaklaşımınızda devrim yaratacak tescilli MT4 göstergimizi tanıtmamıza izin verin. Benzersiz çok yönlülük Göstergemiz, Renko ve RangeBar Mum oluşumlarını tercih eden kullanıcılar için özel olarak tasarlanmıştır. Bu grafik türlerinin birçok deneyimli tüccar tarafından tercih e
Lux Trend
Mohamed Hassan
5 (3)
After purchase, please contact me to get your trading tips + more information for a great bonus!   Lux Trend is a professional strategy based on using Higher Highs and Lower Highs to identify and draw Trendline Breakouts! Lux Trend  utilizes two Moving Averages to confirm the overall trend direction before scanning the market for high-quality breakout opportunities, ensuring more accurate and reliable trade signals. This is a proven trading system used by real traders worldwide, demonstrating
Black dragon indicator
Ramil Minniakhmetov
4.86 (119)
Trend algılama göstergesi, herhangi bir stratejiyi tamamlayacak ve bağımsız bir araç olarak da kullanılabilir. ÖNEMLİ! Talimatları ve bonusu almak için satın aldıktan hemen sonra benimle iletişime geçin! Göstergeyle çalışmak için öneriler, yorum #5'ten indirebilirsiniz. Avantajlar Kullanımı kolay, tabloyu gereksiz bilgilerle doldurmaz; Herhangi bir strateji için filtre olarak kullanabilme; Hem kar elde etmek hem de zararları durdurmak için kullanılabilen yerleşik dinamik destek ve direnç se
TPSpro RFI Levels
Roman Podpora
4.85 (27)
TALİMATLAR         RUS   -        ENG       Bir gösterge ile kullanılması   önerilir       -       TPSpro   TREND PRO -   Sürüm MT4         Ticarette önemli bir unsur, bir ticaret aracını satın alma veya satma kararlarının alındığı bölgeler veya seviyelerdir. Büyük oyuncuların piyasadaki varlıklarını gizleme girişimlerine rağmen, kaçınılmaz olarak izler bırakırlar. Bizim görevimiz bu izleri nasıl tanımlayacağımızı ve doğru şekilde nasıl yorumlayacağımızı öğrenmekti. Ana işlevler:: Satıcılar ve
IX Power MT4
Daniel Stein
4.75 (8)
IX Power: Endeksler, Emtialar, Kripto Paralar ve Forex Piyasaları için İçgörüler Genel Bakış IX Power , endeksler, emtialar, kripto paralar ve forex sembollerinin gücünü analiz etmek için tasarlanmış çok yönlü bir araçtır. FX Power , tüm kullanılabilir döviz çiftlerinin verilerini kullanarak döviz çiftleri için maksimum doğruluk sağlarken, IX Power yalnızca temel sembolün piyasa verilerine odaklanır. Bu, IX Power 'ı forex dışındaki piyasalar için ideal ve daha basit forex analizleri için güven
Introduction to X3 Chart Pattern Scanner X3 Cherart Pattern Scanner is the non-repainting and non-lagging indicator detecting X3 chart patterns including Harmonic pattern, Elliott Wave pattern, X3 patterns, and Japanese Candlestick patterns. Historical patterns match with signal patterns. Hence, you can readily develop the solid trading strategy in your chart. More importantly, this superb pattern scanner can detect the optimal pattern of its kind. In addition, you can switch on and off individu
FX Dynamic: Özelleştirilebilir ATR Analiziyle Volatilite ve Trendleri Takip Edin Genel Bakış FX Dynamic , ortalama gerçek aralık (ATR) hesaplamalarını kullanarak günlük ve gün içi volatilite hakkında rakipsiz bilgiler sağlayan güçlü bir araçtır. 80%, 100%, 130% gibi net volatilite eşikleri ayarlayarak, piyasa olağan hareketlerinin ötesine geçtiğinde hızlı şekilde uyarı alabilir ve potansiyel kazanç fırsatlarını süratle tespit edebilirsiniz. FX Dynamic , brokerınızın zaman dilimine uyum sağlaya
Currency Strength Wizard , başarılı ticaret için size hepsi bir arada çözüm sağlayan çok güçlü bir göstergedir. Gösterge, birden çok zaman dilimindeki tüm para birimlerinin verilerini kullanarak şu veya bu forex çiftinin gücünü hesaplar. Bu veriler, şu veya bu para biriminin gücünü görmek için kullanabileceğiniz, kullanımı kolay para birimi endeksi ve para birimi güç hatları biçiminde temsil edilir. İhtiyacınız olan tek şey, işlem yapmak istediğiniz tabloya göstergeyi eklemektir ve gösterge size
Altın Trend   - bu iyi bir hisse senedi teknik göstergesidir. Gösterge algoritması, bir varlığın fiyat hareketini analiz eder ve oynaklığı ve potansiyel giriş bölgelerini yansıtır. En iyi gösterge sinyalleri: - SATIŞ için = kırmızı histogram + kırmızı KISA işaretçi + aynı yönde sarı sinyal oku. - AL için = mavi histogram + mavi UZUN işaretçi + aynı yönde aqua sinyal oku. Göstergenin faydaları: 1. Gösterge yüksek doğrulukta sinyaller üretir. 2. Onaylanmış bir ok sinyali yalnızca trend deği
Supply Demand Analyzer
Suvashish Halder
5 (6)
Supply Demand Analyzer is an advanced trading indicator meticulously designed for the precise identification, analysis, and management of supply and demand zones. By integrating real-time data and advanced algorithms, this tool enables traders to recognize market phases, price movements, and structural patterns with unparalleled accuracy. It simplifies complex market dynamics into actionable insights, empowering traders to anticipate market behavior, identify trading opportunities, and make info
Yazarın diğer ürünleri
Super Trend eu
Emin Ulucanli
4.75 (4)
SUPER TREND; Olivier Seban tarafından oluşturulan Supertrend ATR ‘ye dayanan ve trendi takip eden bir göstergedir. Trend yönündeki değişiklikleri tespit etmek ve durakları konumlandırmak için kullanılabilir. Fiyat gösterge eğrisinin altına düştüğünde kırmızıya döner ve bir düşüş trendine işaret eder. Tersine, fiyat eğrinin üzerine çıktığında, gösterge yeşile döner ve bir yükseliş trendine işaret eder. Diğer göstergeler gibi, Supertrend ’de, MACD, parabolik SAR, Bollinger Band veya RSI gibi diğer
FREE
Pivot Classic, Woodie, Camarilla, Fibonacci and Demark Floor/Classic Pivot noktaları veya basitçe pivotlar, bir varlığın en yüksek, en düşük ve kapanış değerlerini inceleyerek potansiyel destek/direnç seviyelerini, alım satım aralıklarını, trend dönüşlerini ve piyasa duyarlılığını belirlemek için kullanışlıdırlar. Floor/Classic Pivot Noktaları şu şekilde hesaplanabilir. Pivot Point (P) = (High + Low + Close)/3 S1 = P * 2 - High S2 = P - (High - Low) S3 = Low – 2*(High - P) R1 = P * 2 - Low R2 =
FREE
Tillson TMA T3
Emin Ulucanli
5 (3)
TILLSON MOVING AVERAGE TMA veya T3 indikatörü olarak da bilinir. Formülünde EMA ve DEMA kullanan ve 3. derece Binom açılımı ile hesaplanan bir hareketli ortalamadır.       ...    int      handle1;     //Handle of the Tillson TMA T3.EX5 custom indicator    double   euBuff1[];    int TMAperiod= 12 ;    int TMSshift= 0 ;    double VolumeFactor= 0.618 ;    int OnInit ()    {    ...    handle1= iCustom ( NULL , PERIOD_CURRENT , "Market\\ Tillson TMA T3 .EX5" ,0,TMAperiod,0,0,TMSshift,0,0,VolumeFactor
FREE
DONCHIAN CHANNEL DC “Richard Donchian” tarafından geliştirilen, üst kanal, alt kanal ve orta kanal olmak üzere 3 katmandan oluşan bir trend indikatörüdür. Donchian Kanalı’da, belirli sürede geçmiş dönemi içinde ulaşılan en yüksek ve en düşük fiyatlarını fiyat grafiği üzerinde çizmek suretiyle oluşturuluyor. Ayrıca, fiyat oynaklığının artmasına/azalmasına göre genişleyen/daralan bir kanal olmasından ötürü, piyasanın volatilitesini ölçmek için de kullanılır. Method 0; Donchian kanalı gösterge çizi
FREE
Pivot Classic, Woodie, Camarilla, Fibonacci and Demark Floor/Classic Pivot noktaları veya basitçe pivotlar, bir varlığın en yüksek, en düşük ve kapanış değerlerini inceleyerek potansiyel destek/direnç seviyelerini, alım satım aralıklarını, trend dönüşlerini ve piyasa duyarlılığını belirlemek için kullanışlıdırlar. Floor/Classic Pivot Noktaları şu şekilde hesaplanabilir. Pivot Point (P) = (High + Low + Close)/3 S1 = P * 2 - High S2 = P - (High - Low) S3 = Low – 2*(High - P) R1 = P * 2 - Low R2 =
FREE
Filtrele:
İnceleme yok
İncelemeye yanıt
Sürüm 1.20 2023.01.28
Birkaç küçük değişiklik
Sürüm 1.10 2023.01.14
Küçük değişiklikler yapıldı.

Gösterge ayarlarına
Volume Factor
Method 0
seçenekleri eklendi.