LongShort by Cointegration
- Uzman Danışmanlar
- Paulo Henrique Faquineli Garcia
- Sürüm: 23.1
- Etkinleştirmeler: 5
Be aware that standard parameters are not a recommendated inputs! You should analyze and determine your own parameters for Long&Short trades!
Long & Short Based on Cointegration
Statistical and Quantitative Long-Short (Pair Trading) approach for long and short positions. Your CPU will always be safe and stable when using Multiple Linear Regression if you have a reliable Expert Advisor.
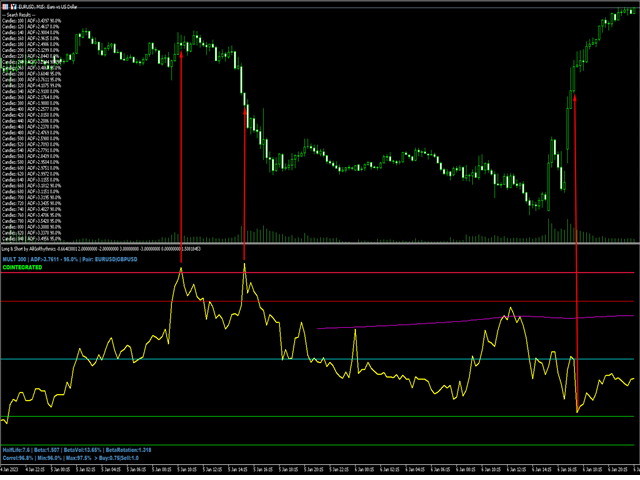
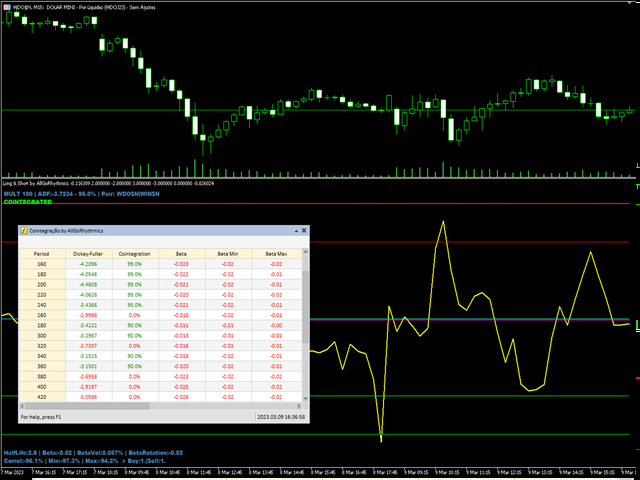
Based on the results of this indicator, you can execute a long and short or a long and long/short and short trade between two separate assets. It can show you a Highly informative dashboard based on Cointegration Search you determine in parameters, with all statistical data for your best Approach!
The Expert Advisor determines whether or not the pair is cointegrated by running a number of statistical tests comparing the assets. Be mindful that whereas BxA may not exhibit cointegration, pair AxB may be. You can determine whether AxB and BxA are cointegrated to get good trading results!
Recommended Usage Techniques
(a) Check if the pairs are cointegrate by the ADF test (Augmented Dickey Fuller test). 0% means the pairs are not cointegrating. 90% and 99% mean cointegration (Greater is better).
(b) Check if beta is positive or negative and pairwise correlation. BetaRotation is shown in the magenta line drawn by this indicator.
If beta is positive, check that all correlations are positive (correlations > 0% | min > 0% | max > 0%).
If beta is negative, check if all correlations are negative (correlation < 0% | min < 0% | max < 0%).
Once the residual line (yellow) reaches the lower band, buy the main asset and sell the secondary asset (expect reversal of normalcy).
Buy the major and secondary Assets when the residual line (yellow) reaches the lower band (anticipate a normal reversal).
Lot Size Ratio
The lot size ratio is determined by Beta or BetaRotation (you need to decide which one is right for you). To find the secondary asset lot size, simply multiply the primary asset lot by the beta.
If beta 0.5 and primary lot = 10, the secondary lot size will be 5. Given the lot size of the main asset, the indicator helps in this calculation.
Parameter list
Opposite Analisys: if "true", the indicator will perform full analisys of B x A
Lot Size: The Lot Size you want to trade with. Indicator will show your the lot size for main and secondary asset
Regression Candles: How many candles to run the Regressions and tests
Regression Type: Regression type, Simple or Multiple(with trend)
Regression Data: Data to run regression and tests. Prices or Percentage (Strong suggestion for Prices usage)
Beta Rotation Candles: How many candles to analize and determine the BetaRotation method
Index Data Type: You can choose between using raw data or Z-Score (Standardized data)
Deviation first line: Standard deviations to plot first line
Deviation second line: Standard deviations to plot second line
Lag-1: The indicator will not include current data in Regression Tests
Save CPU: Choose between running tests based ond Regression Period or All the Candles
Show Panel: Dashboard with a complete analisys based on Cointegration Search Parameters
Beginning: Number of candles for regression to begin search with
Step Size: Number of candles to add in next regression search
Total Steps: Number of steps of adding candles in regression search
If you face any doubts, feel free to message me!
Have good trades!

