MP Pivot Levels for MT5
- Göstergeler
- Pierre Ksachikian
- Sürüm: 1.20
- Güncellendi: 6 Mart 2023
- Etkinleştirmeler: 6
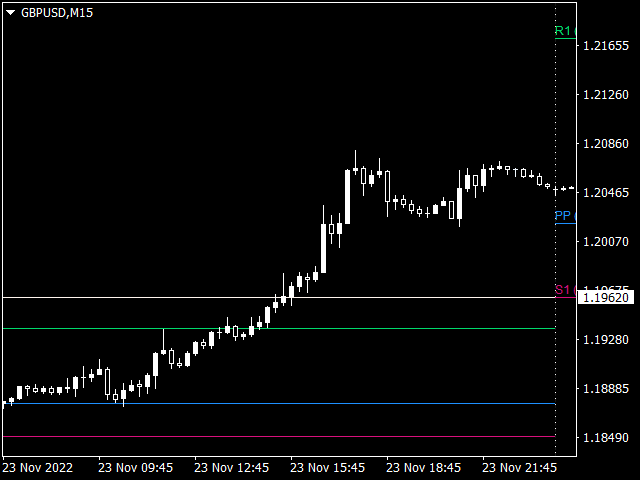
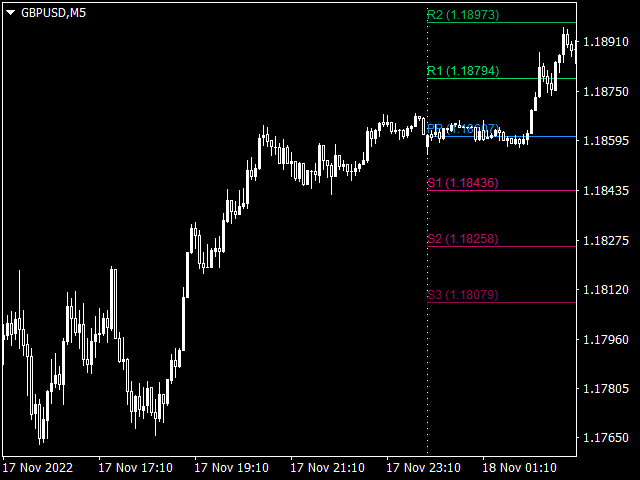
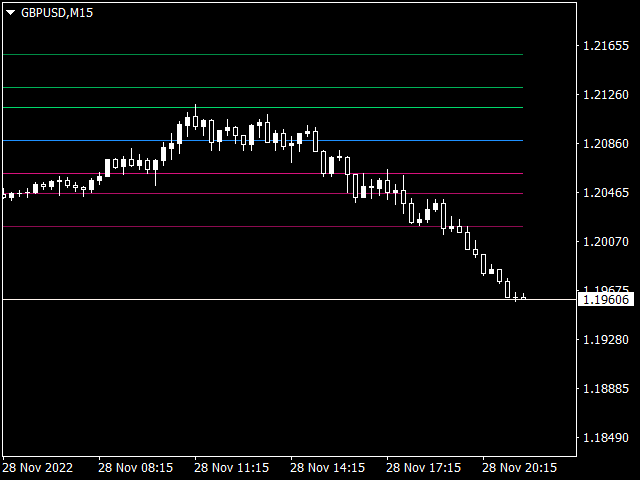
This indicator contains Pivot Levels of:
- Traditional
- Fibonacci
- Woodie
- Classic
- Demark
- Camarilla
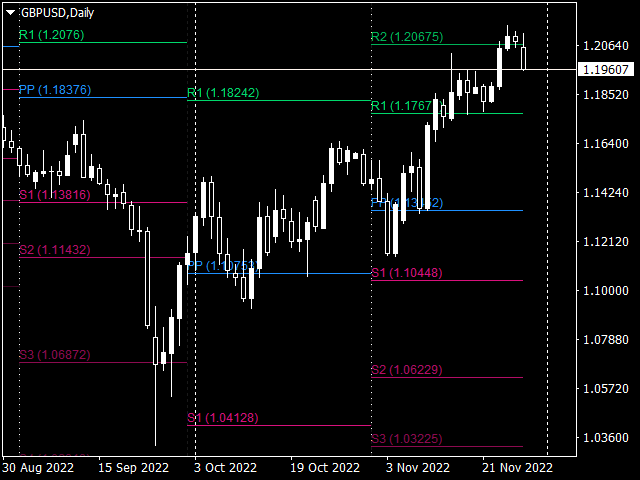
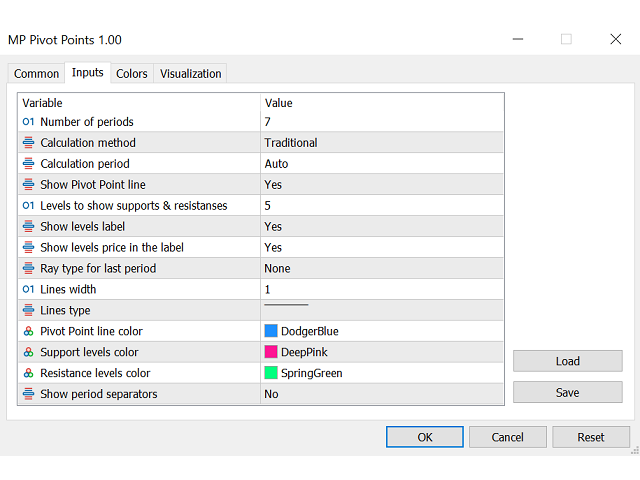
Calculation periods can be set to auto / Daily / Weekly / Monthly / Yearly.
Number of Levels are editable.
Options to hide level labels and price labels.
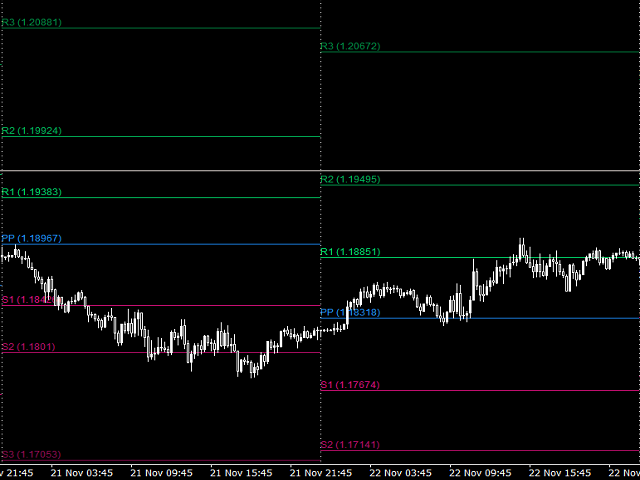
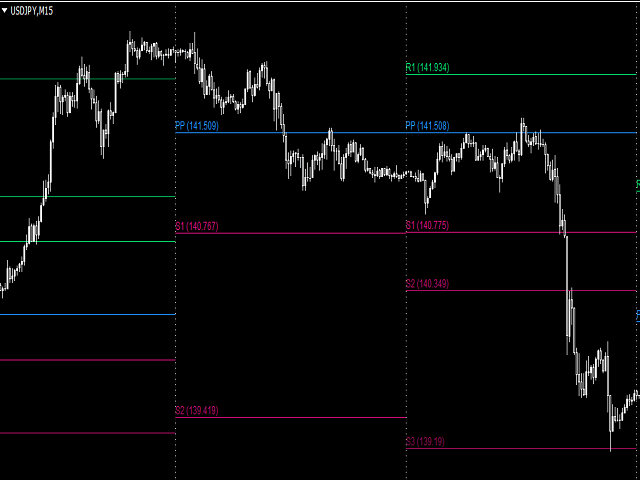
Pivots Points are price levels chartists can use to determine intraday support and resistance levels. Pivot Points use the previous days Open, High, and Low to calculate a Pivot Point for the current day. Using this Pivot Point as the base, three resistance and support levels are calculated and displayed above and below the Pivot Point.
Pivot Point support and resistance levels can be used just like traditional support and resistance levels. As with all indicators, it is important to confirm Pivot Point signals with other aspects of technical analysis.
- What Do Pivot Points Tell You?
Pivot points are an intraday indicator for trading futures, commodities, and stocks. Unlike moving averages or oscillators, they are static and remain at the same prices throughout the day. This means traders can use the levels to help plan out their trading in advance.
For example, traders know that if the price falls below the pivot point they will likely be shorting early in the session. Conversely, if the price is above the pivot point, they will be buying. S1, S2, R1, and R2 can be used as target prices for such trades, as well as stop-loss levels.
Combining pivot points with other trend indicators is common practice with traders. A pivot point that also overlaps or converges with a 50-period or 200-period moving average (MA), or Fibonacci extension level, becomes a stronger support/resistance level.
- Pivot Points vs. Fibonacci Retracements
Pivot points and Fibonacci retracements or extensions both draw horizontal lines to mark potential support and resistance areas. The Fibonacci indicator is useful because it can be drawn between any two significant price points, such as a high and a low. It will then create the levels between those two points.
Fibonacci retracement and extension levels can thus be created by connecting any price points on a chart. Once the levels are chosen, lines are drawn at percentages of the price range selected.
Pivot points, in contrast, do not use percentages and are based on set fixed numbers: the high, low, and close of the prior day.
___________________________________________________________________________________
Disclaimer:
Do NOT trade or invest based upon the analysis presented on this channel. Always do your own research and due diligence before investing or trading. I’ll never tell you what to do with your capital, trades or investments. I’ll also never recommend for you to buy, sell, long or short any asset, commodity, security, derivative or cryptocurrency related instrument as it's extremely HIGH RISK! You should always consult with a professional/licensed financial adviser before trading or investing in any type of assets.

