DepthTrendView
- Göstergeler
- Mhd Amran Bin Lop
- Sürüm: 1.0
- Etkinleştirmeler: 5
DepthTrendView is an indicator that is used to see the direction of the market very clearly compared to the indicators that are commonly used by many people.
What is interesting about this indicator is that you can see the direction of the trend and also know that the market is at the end or that the market wants to start a new trend.
How to Use:
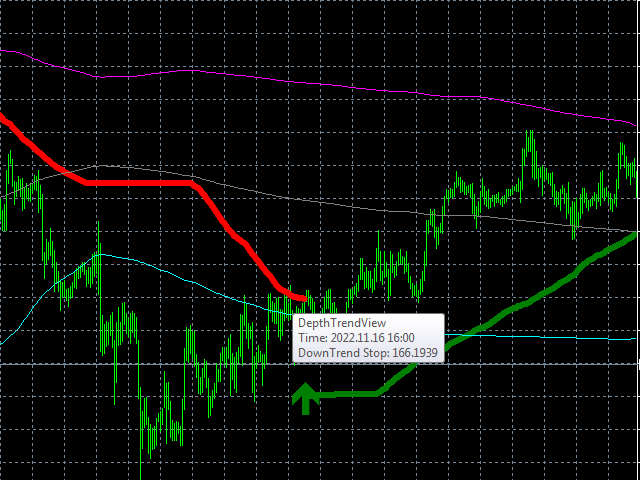
1- To see the earliest BUY direction you need to see previous candle below Aqua Line before green arrow appear.
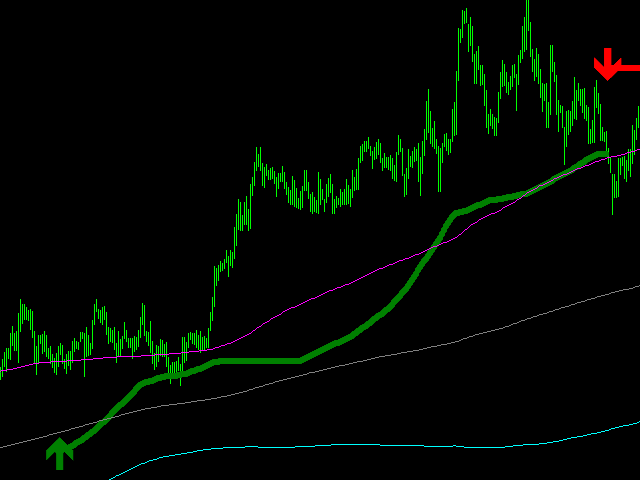
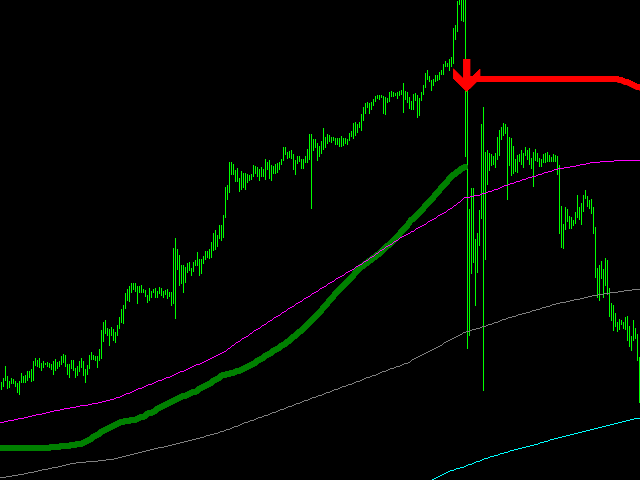
2- To see the earliest SELL direction you need to see previous candle above Magenta Line before red arrow appear.
3- If the candle is under the thick red line and under Aqua, it means the trend is still strong for DOWN.
4- If the candle is above the thick green line and above the Magenta line, it means the trend is still strong for UP.
Benefits of DepthTrendView Indicator
- Unique Algorithm
- Predict Strong Trends
- Filter out Consolidation
- Show signals of buy and sell arrow with colored
- Recommended Time-frames: H1
- Assets: All
- Easy to use, does not overload charts with unnecessary information
- Does not repaint
- Alerts on charts
