Range Support Resistance Breakout Touch Alarm
- Göstergeler
- Andre Matthes
- Sürüm: 1.0
- Etkinleştirmeler: 5
- simple PRICE Action Indicator/ Tool - SELF-Adjusting
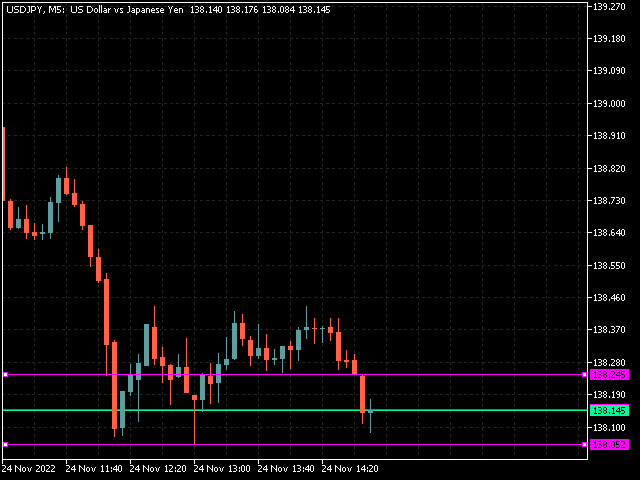
- you choose the UPPER Border of your RANGE ( Resistance)
- you choose the LOWER Border of your RANGE ( Support)
# Alert happens when the PRICE TOUCHes 1 of these Borders # (we release a CLOSED above/below - Version too)
- popup Alert or custom sound
- PUSH notification ( no email - that tool is for quicker action)
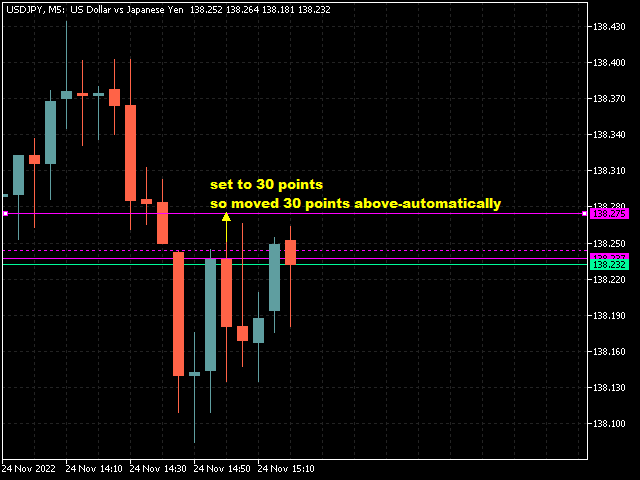
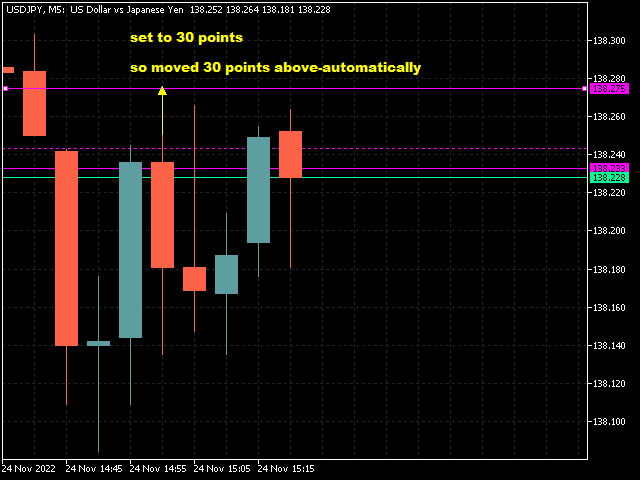
- once a Border got hit --> it doesnt disappear --> it goes a selectable amount of POINTS (RANGE(new)) above/below the HIGH/ LOW of the current(or other TF) CANDLE
--> so if the PRICE moves very quick it could alert 2x or even 3x
--> the SETUP for FOREX(currency/ XAUUSD) should be at: 10 to 30 (10-30 points/ 1pip)
--> the SETUP for INDICES+Crypto(US30/ DAX40..BTCUSD) should be at: 100 to 500 (100-500 points)* dont work in the TESTER ! makes no sense at all