Three Candles Reversal Indicator
- Göstergeler
- Andre Matthes
- Sürüm: 1.3
- Güncellendi: 8 Aralık 2022
- Etkinleştirmeler: 5
- simple Price Action Indicator
- we recommend it for CURRENCY and GOLD Trades
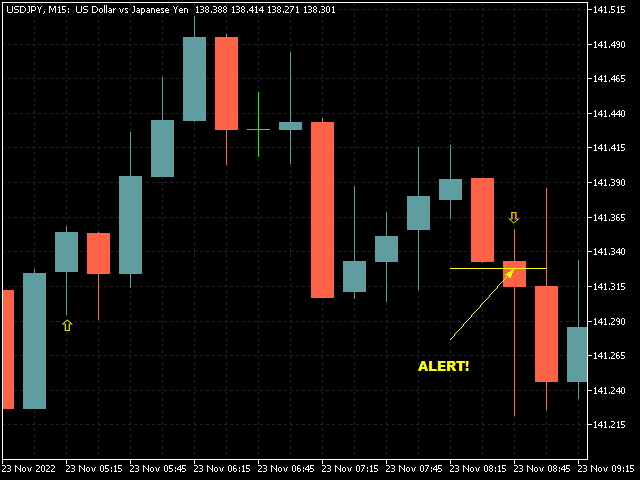
- NON Lagging ! the Alert shows instantly whats happening
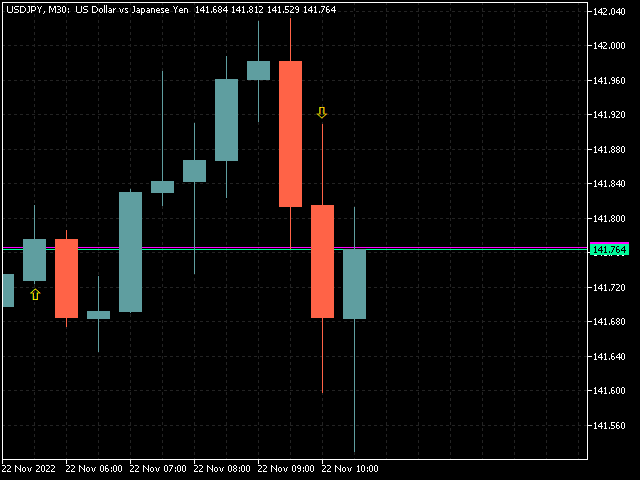
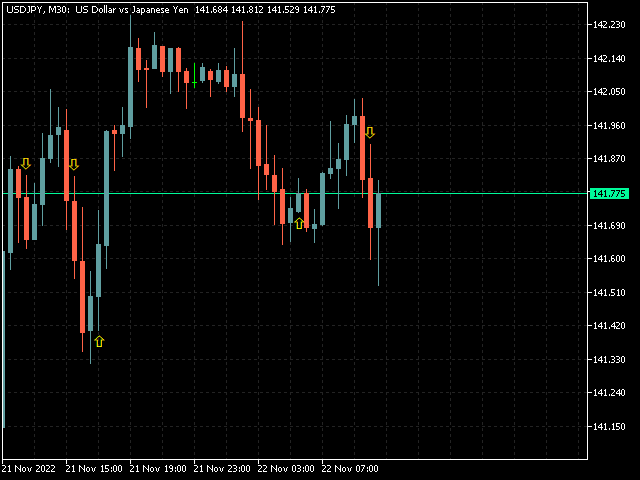
--> thats why the ARROW appears at the MOMENT the REVERSAL-Candle gets EXCEEDED
SETUP:
- recommended SETUP is:
3 Candles bullish or bearish --> can easily be adjusted - user defined
more than 4 is NOT recommended --> 50/50 its a heavy move going on
- recommended Timeframe: M30 (we strictly recommend M30 ONLY!)
- VOLUME Check? (last 2 trending candles have decreasing size?) is set to: false - with true you get less signals!
--> judge each signal yourself to become a MASTER of the REVERSAL-Pattern
HOW to trade:
1. wait for the ALERT --> occurs when the REVERSAL candle gets exceeded
2. wait for the M5 candle to close(should close in your Direction and above/below the M30 REVERSAL-Candle!) -- This is MOST important !
3. execute when PRICE exceeds that M5 candle