• Genel bakış
  • İncelemeler
  • Yorumlar (2)
  • Yenilikler

Market Dynamics

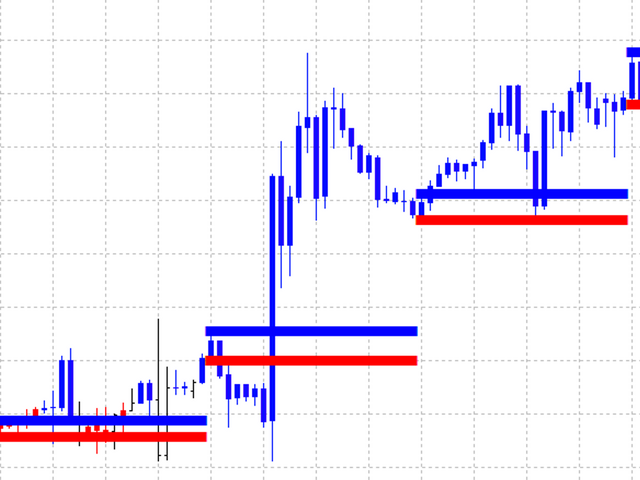
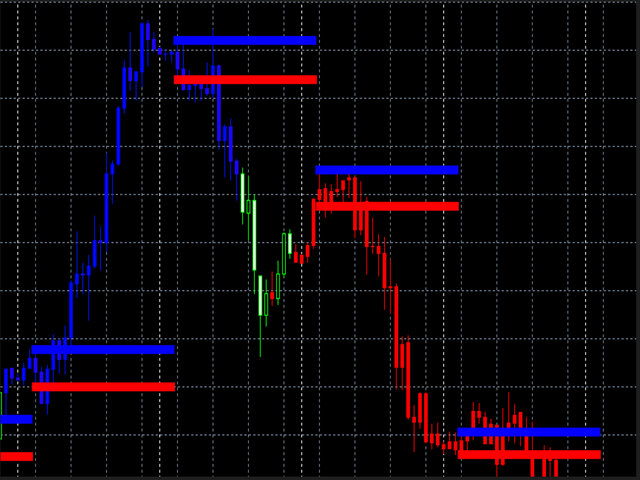
Piyasa Dinamikleri, trend ölçeklendirme içindir. Mavi al ve kırmızı sat. Çizgiler, fiyat konsolidasyonu alanlarıdır ve normal çubuk mumlara karar verilmez. Fiyat, destek ve direnç çizgileri arasında konsolide olacak ve ardından alanlardan fiyat hareketi kopacak. Üstte veya altta kafa derisi için resim alanları ve ana trendleri veya kafa derisi için günlük ticareti takip edin.
Önerilen ürünler
BoxChart MT4
Evgeny Shevtsov
4.57 (7)
The market is unfair if only because 10% of participants manage 90% of funds. An ordinary trader has slim changes to stand against these "vultures". This problem can be solved. You just need to be among these 10%, learn to predict their intentions and move with them. Volume is the only preemptive factor that faultlessly works on any timeframe and symbol. First, the volume appears and is accumulated, and only then the price moves. The price moves from one volume to another. Areas of volume accumu
Blahtech Market Profile
Blahtech Limited
4.61 (18)
Was: $249  Now: $99   Market Profile defines a number of day types that can help the trader to determine market behaviour. A key feature is the Value Area, representing the range of price action where 70% of trading took place. Understanding the Value Area can give traders valuable insight into market direction and establish the higher odds trade. It is an excellent addition to any system you may be using. Blahtech Limited presents their Market Profile indicator for the MetaTrader community. Ins
Bu, bir mumun kapanış fiyatını tahmin eden bir göstergedir. Gösterge öncelikle D1 çizelgelerinde kullanılmak üzere tasarlanmıştır. Bu gösterge hem geleneksel forex ticareti hem de ikili opsiyon ticareti için uygundur. Gösterge, bağımsız bir ticaret sistemi olarak kullanılabilir veya mevcut ticaret sisteminize ek olarak hareket edebilir. Bu gösterge, mevcut mumu analiz ederek mumun gövdesi içindeki belirli güç faktörlerini ve önceki mumun parametrelerini hesaplar. Böylece gösterge, piyasa hareket
Gösterge, tarihsel olanlarla karşılaştırılabilecek güncel teklifler oluşturur ve bu temelde bir fiyat hareketi tahmini yapar. Gösterge, istenen tarihe hızlı navigasyon için bir metin alanına sahiptir. Seçenekler: Sembol - göstergenin göstereceği sembolün seçimi; SymbolPeriod - göstergenin veri alacağı dönemin seçimi; GöstergeRenk - gösterge rengi; Ters - doğru tırnakları tersine çevirir, yanlış - orijinal görünüm; Sonraki, tarihi girebileceğiniz ve 'enter' tuşuna basa
VR Grid
Vladimir Pastushak
4.57 (7)
VR Izgara göstergesi, kullanıcı tanımlı ayarlarla grafiksel bir ızgara oluşturmak için tasarlanmıştır . Standart ızgaradan farklı olarak, VR Izgarası dairesel seviyeler oluşturmak için kullanılır. Kullanıcının seçimine bağlı olarak tur seviyeleri arasındaki adım isteğe bağlı olabilir. Ek olarak, diğer göstergeler ve yardımcı programlardan farklı olarak VR Grid, zaman dilimi değiştiğinde veya terminal yeniden başlatıldığında bile ızgaranın konumunu korur . Ayarlar, set dosyaları, demo versiyonlar
FREE
Volume Profile Indicator for MT4 Gain a trading edge with the "Volume Profile" indicator for MetaTrader 4 (MT4). This advanced technical analysis tool allows you to precisely identify key support and resistance levels based on transaction volume. Easily visualize market areas of high interest, where trading volumes are highest, and use this information to make more informed trading decisions. Key Features: Clear and detailed visualization : The indicator displays volume histograms directly on th
Order Book
Thomas Bradley Butler
Pazar hacmi profilinin tam bir resmi için Delta Ayak İzi Tablosu ile birleştirin:   https://www.mql5.com/en/market/product/9415 3 "Sipariş Defteri" göstergesi, fiyat tablosunda alış ve satış hacmi kümelerini temsil eden bir histogram görüntüler.   Gösterge, geçmiş fiyat verilerini analiz eder ve belirli bir çubuk sayısı dahilinde her bir fiyat seviyesi için alış ve satış hacmi kümelerini hesaplar. Teklif hacmi kümeleri mavi, talep hacmi kümeleri ise kırmızı ile gösterilir. Gösterge, alış
Zig Zag 123
Stephen Reynolds
Zig Zag 123 tells us when a reversal or continuation is more likely by looking at the shift in supply and demand. When this happens a signature pattern appears known as 123 (also known ABC) will often break out in direction of higher low or lower high. Stop loss and take profit levels have been added. There is a panel that shows the overall performance of your trades for if you was to use these stop loss and take profit levels.  We get alerted if a pattern 123 appears and also if the price
UPD1 Profile Levels
Vitaliy Kuznetsov
5 (6)
Gösterge, belirtilen sayıda çubuk için çalışma histogramında maksimum ve minimum fiyat hacminin (piyasa profili) seviyelerini bulur.   Kompozit profil. Histogramın yüksekliği tamamen otomatiktir ve herhangi bir enstrümana ve zaman dilimine uyarlanabilir. Yazarın algoritması kullanılır ve bilinen analogları tekrarlamaz. İki histogramın yüksekliği yaklaşık olarak mumun ortalama yüksekliğine eşittir. Akıllı uyarı (akıllı uyarı), hacim seviyesine ilişkin fiyatı bildirmenize yardımcı olur. Konsept
Master Scalping M1 , trendi hızlı ve doğru bir şekilde belirlemek için bir algoritma kullanan yenilikçi bir göstergedir. Gösterge, pozisyonların açılış ve kapanış zamanını hesaplar, gösterge algoritmaları, bir ticarete girmek (bir varlık satın almak veya satmak) için ideal anları bulmanızı sağlar, bu da çoğu tüccar için işlemlerin başarısını artırır. Göstergenin faydaları: Kullanımı kolaydır, çizelgeyi gereksiz bilgilerle aşırı yüklemez. Herhangi bir strateji için bir filtre olarak kullanılabili
Simply The Best Pro
Szymon Palczynski
5 (1)
This indicator displays the histogram and arrows on chart. When Simple The Best Pro are placed on a chart, they identify the trend.  The color of may be blue or red. The blue color stands for upside moves and the red color stands for downside trends. The indicator offers to set Stop Loss (SL) and  Take Profit (TP)  setting. The default value is ATR. Indicator has automatic optimization. The STB is a unique indicator that shows the tendency (button Bars) of a particular signals. The STB tells us
VPO Profile MT4
Kyra Nickaline Watson-gordon
5 (2)
Definition : VPO is a Volume Price Opportunity. Instead of using bars or candles with an Open, High, Low, and Close price, each "bar" in a Market Profile is represented by horizontal bars against the price It is called Market Profile terminology. In other words volume-price-opportunity (VPO) profiles are histograms of how many volumes were traded at each price within the span of the profile. By using a VPO chart, you are able to analyze the amount of trading activity, based on volume, for eac
Supply Demand Zones indicator for possible BUY / Sell Zones based on smart volumes indicator two levels of buy/Sell Zones : Main BUY/SELL area  SUPPLY area in Red DEMAND area in Green your strategy is to follow generated Arrows : 1- you can Buy when price is Closed above a green BUY area and above high of previous candle  2- you can Sell when price is Closed below  a red  SELL area   and below low of previous candle  Also, a separate indicator window for SMART CANDLES used to detect the Big Supp
This indicator is a conventional analytical tool for tick volumes changes. It calculates tick volumes for buys and sells separately, and their delta on every bar, and displays volumes by price clusters (cells) within a specified bar (usually the latest one). The algorithm used internally is the same as in the indicator VolumeDelta , but results are shown as cumulative volume delta bars (candlesticks). Analogous indicator for MetaTrader 5 exists - VolumeDeltaBars . This is a limited substitution
MarketProfile EForex
Veridiana Adorno Kendrick
Market Profile Shows where the price has spent more time, highlighting important levels that can be used in trading. It is a powerful tool which is designed to take the fundamental components which comprise every market; price/volume/time, and visually display their relationship in real-time as the market develops for a pre-determined time period. Very powerful tool!
TWO PAIRS SQUARE HEDGE METER INDICATOR Try this brilliant 2 pairs square indicator It draws a square wave of the relation between your two inputs symbols when square wave indicates -1 then it is very great opportunity to SELL pair1 and BUY Pair2 when square wave indicates +1 then it is very great opportunity to BUY pair1 and SELL Pair2 the inputs are : 2 pairs of symbols         then index value : i use 20 for M30 charts ( you can try other values : 40/50 for M15 , : 30 for M30 , : 10 for H1 ,
The Chaikin Oscillator is a technical indicator developed by Marc Chaikin that combines price and volume data to measure the accumulation and distribution of a financial instrument. It aims to identify potential buying and selling opportunities in the market. The Chaikin Oscillator is calculated by subtracting a 10-day exponential moving average of the Accumulation Distribution Line (ADL) from a 3-day exponential moving average of the ADL. Here's how to use the Chaikin Oscillator indicator in tr
An indicator of patterns #24, #25, #26 and #27 ("Head and Shoulders", "Complex Head and Shoulders") from Encyclopedia of Chart Patterns by Thomas N. Bulkowski. Parameters: Alerts - show alert when an arrow appears   Push - send a push notification when an arrow appears (requires configuration in the terminal) PeriodBars - indicator period K - an additional parameter that influences the accuracy of pattern shape recognition. The smaller the value is, the smoother the row of peaks/valleys shou
The indicator analyzes the change in the minimum and maximum prices of the previous bars fixing the entrance of the big players. If the change (delta) increases, a signal is displayed on the graph in the form of an arrow. At the same time, virtual trade on history is carried out. In case of a repeat of the signal, the positions are increased (refilling). Thus the lot of positions can differ. The results of virtual trading in the form of losses / losses, profitability, drawdown and transaction li
İşlem hacimlerine ilişkin okumaları hesaplayan teknik bir gösterge. Histogram biçiminde, ticaret enstrümanının hareket gücünün birikimini gösterir. Yükseliş ve düşüş yönleri için bağımsız hesaplama sistemlerine sahiptir. Herhangi bir ticaret enstrümanı ve zaman dilimi üzerinde çalışır. Herhangi bir ticaret sistemini tamamlayabilir. Gösterge değerlerini yeniden çizmez, sinyaller mevcut mum üzerinde görünür. Kullanımı kolaydır ve grafiği yüklemez, ek parametre hesaplamaları gerektirmez. Değiştir
Trend Deviation
VLADISLAV AKINDINOV
Trend indicator with calculation of dynamic levels and signaling their intersection. Description of input parameters: StepTF = true; - Calculation of the indicator by closing the bar (true) or by each tick (false) BarsCount = 300; - Number of settlement bars Price = PRICE_CLOSE; - Type of price used TimeFrame = PERIOD_CURRENT; - Estimated timeframe TrendPeriod = 9; - Trend calculation period TrendDeviations = 4.9; - coefficient of deviation PeriodTrendSmooth = 1; - Trend smoothi
PipFinite Exit EDGE
Karlo Wilson Vendiola
4.88 (161)
Did You Have A Profitable Trade But Suddenly Reversed? In a solid strategy, exiting a trade is equally important as entering. Exit EDGE helps maximize your current trade profit and avoid turning winning trades to losers. Never Miss An Exit Signal Again Monitor all pairs and timeframes in just 1 chart www.mql5.com/en/blogs/post/726558 How To Trade You can close your open trades as soon as you receive a signal Close your Buy orders if you receive an Exit Buy Signal. Close your Sell orde
VolumeProfile
Robert Hess
3.8 (5)
Descption: The Volume Profile displays detailed informations of historical trading activities at certain price levels (Market Profile). So you can locate the areas with the best prices in the market and get an advantage about other market participants. Features: Customizable Volume Profile / Market Profile Shows the "fair" Value Area with 70% of all Volume Shows critical low volume zones Shows VPOC, VAL and VAH Points Works on all timeframes Also available for MT5 ( https://www.mql5.com/en/m
Blahtech Supply Demand
Blahtech Limited
4.63 (35)
Was: $299  Now: $99   Supply Demand uses previous price action to identify potential imbalances between buyers and sellers. The key is to identify the better odds zones, not just the untouched ones. Blahtech Supply Demand indicator delivers functionality previously unavailable on any trading platform. This 4-in-1 indicator not only highlights the higher probability zones using a multi-criteria strength engine, but also combines it with multi-timeframe trend analysis, previously confirmed swings
Infinity Trend Pro
Yaroslav Varankin
1 (1)
This is a trend indicator without redrawing Developed instead of the binary options strategy (by the color of the Martingale candlestick) Also works well in forex trading When to open trades (binary options) A signal will appear in the place with a candle signaling the current candle It is recommended to open a deal for one candle of the current timeframe M1 and M5 When a blue dot appears, open a deal up When a red dot appears, open a trade down. How to open trades on Forex. When a signal is rec
AQ XFifteen Pro
HIT HYPERTECH INNOVATIONS LTD
Χ15 indicator is a MetaTrader 4 tool that allows you to  BUILD & BACKTEST ON REAL TIME  your own strategies quickly, easily and efficiently. It contains  15 of the most popular technical analysis indicators  that you can use, each one in a different way. Choose the indicators that you want to use, select how you will use them and you will see on the chart BUY (green) and SELL (red) arrows implementing your strategy. Choose Take Profit and Stop Loss and you will see the results of your strategy w
SQ Swing Fibo Marker
Bartlomiej Gorski
4.5 (2)
Swing Fibo Marker is adaptive advanced indicator that automatically detects price swings. After swing detection, it draws five profit targets, entry level and stop loss level. Levels are calculated base on price swing size, according to Fibonacci levels specified as entry points. When price touch the level indicator create alerts. List of supported alert types: Popup alerts Email alerts Push notification On screen output Suggested timeframe to trade: H1 or higher. The higher timeframe is used to
Displays the local time with the time difference you set. (It does not correspond to the time difference in 30-minute increments.) It also displays a price line with a good price, such as 100.000 .100 or .200. The standard gridlines are displayed with the time and price by MT4, but they are very confusing as they become the broker's time and are displayed at the halfway point along with the price. It hides them and displays gridlines at user-defined time differences and prices in easy-to-und
We present you the indicator "Candle closing counter", which will become your indispensable assistant in the world of trading. That’s why knowing when the candle will close can help: If you like to trade using candle patterns, you will know when the candle will be closed. This indicator will allow you to check if a known pattern has formed and if there is a possibility of trading. The indicator will help you to prepare for market opening and market closure. You can set a timer to create a p
Fibonacci retracement and extension line drawing tool Fibonacci retracement and extended line drawing tool for MT4 platform is suitable for traders who use  golden section trading Advantages: There is no extra line, no too long line, and it is easy to observe and find trading opportunities Trial version: https://www.mql5.com/zh/market/product/35884 Main functions: 1. Multiple groups of Fibonacci turns can be drawn directly, and the relationship between important turning points
Bu ürünün alıcıları ayrıca şunları da satın alıyor
Gann Made Easy
Oleg Rodin
4.87 (95)
Gann Made Easy , bay teorisini kullanarak ticaretin en iyi ilkelerine dayanan, profesyonel ve kullanımı kolay bir Forex ticaret sistemidir. WD Gann. Gösterge, Zararı Durdur ve Kâr Al Seviyeleri dahil olmak üzere doğru SATIN AL ve SAT sinyalleri sağlar. PUSH bildirimlerini kullanarak hareket halindeyken bile işlem yapabilirsiniz. Lütfen satın aldıktan sonra benimle iletişime geçin! Alım satım ipuçlarımı ve harika bonus göstergelerini ücretsiz olarak sizinle paylaşacağım! Muhtemelen Gann ticaret y
Gold Stuff
Vasiliy Strukov
4.9 (269)
Gold Stuff, özellikle altın için tasarlanmış bir trend göstergesidir ve herhangi bir finansal enstrümanda da kullanılabilir. Gösterge yeniden çizilmez ve gecikmez. Önerilen zaman dilimi H1. Bu göstergede tam otomatik Uzman Danışman EA Gold Stuff çalışır. Profilimde bulabilirsiniz. Ayarları ve kişisel bir bonusu almak için satın alma işleminden hemen sonra benimle iletişime geçin!  Güçlü Destek ve Trend Tarayıcı göstergemizin ücretsiz bir kopyasını pm'den alabilirsiniz. Ben! AYARLAR Ok Ç
Scalper Inside PRO
Alexey Minkov
4.75 (60)
An exclusive indicator that utilizes an innovative algorithm to swiftly and accurately determine the market trend. The indicator automatically calculates opening, closing, and profit levels, providing detailed trading statistics. With these features, you can choose the most appropriate trading instrument for the current market conditions. Additionally, you can easily integrate your own arrow indicators into Scalper Inside Pro to quickly evaluate their statistics and profitability. Scalper Inside
Trend Pulse
Mohamed Hassan
5 (3)
Please contact me after purchase to immediately get your PDF strategy + documentation for Trend Pulse !  Official release price of $99  ( 15 / 50 copies left). Next price is $199 . Introducing Trend Pulse , a unique and robust indicator capable of detecting bullish, bearish, and even ranging trends! Trend Pulse uses a special algorithm to filter out market noise with real precision. If the current symbol is moving sideways, Trend Pulse will send you a ranging signal, letting you know that
Trend Punch
Mohamed Hassan
4.95 (21)
This indicator is unstoppable when combined with our other indicator called  Support & Resistance . After purchase, send us a message and you will get it   for  FREE as a BONUS! Introducing Trend Punch , the revolutionary forex trend indicator that will transform the way you trade! Trend Punch is uniquely designed to provide precise buy and sell arrows during strong market trends, making your trading decisions clearer and more confident. Whether you're trading major currency pairs or exotic sym
FX Power MT4 NG
Daniel Stein
5 (12)
Sabah Brifingimiz burada mql5 ve on Telegram! FX Power MT4 NG , uzun zamandır çok popüler olan döviz gücü ölçerimiz FX Power'ın yeni neslidir. Peki bu yeni nesil güç ölçer ne sunuyor? Orijinal FX Power hakkında sevdiğiniz her şey PLUS GOLD/XAU güç analizi Daha da hassas hesaplama sonuçları Ayrı ayrı yapılandırılabilir analiz dönemleri Daha da iyi performans için özelleştirilebilir hesaplama limiti Özel çokluDaha fazlasını görmek isteyenler için örnek ayarlar Her grafikte en sevdiğiniz renkler i
Currency Strength Wizard , başarılı ticaret için size hepsi bir arada çözüm sağlayan çok güçlü bir göstergedir. Gösterge, birden çok zaman dilimindeki tüm para birimlerinin verilerini kullanarak şu veya bu forex çiftinin gücünü hesaplar. Bu veriler, şu veya bu para biriminin gücünü görmek için kullanabileceğiniz, kullanımı kolay para birimi endeksi ve para birimi güç hatları biçiminde temsil edilir. İhtiyacınız olan tek şey, işlem yapmak istediğiniz tabloya göstergeyi eklemektir ve gösterge size
ÜRÜNÜ SATIN ALMADAN ÖNCE LÜTFEN AŞAĞIDAKİ BİLGİLERİ OKUYUNUZ! Apollo Pips PLUS SP benzersiz bir üründür! YENİ "APOLLO PIPS" GÖSTERGEMİ ARTI TÜM İŞLEM GÖSTERGELERİME ERİŞİM İLE "SÜPER PAKET" BONUSUNU ALMAK İSTEYENLER İÇİN! Apollo Pips PLUS SP ürününü satın alarak aslında Apollo Pips göstergemin tamamen yeni bir versiyonunu satın almış oluyorsunuz. Göstergenin bu sürümü, geliştirilmiş bir algoritmaya ve kullanımı kolay bir parametreye sahiptir; bu, size göstergeyi herhangi bir piyasada ve herhangi
Atomic Analyst
Issam Kassas
5 (3)
Öncelikle belirtmek gerekir ki bu Ticaret Göstergesi Yeniden Çizim Yapmaz, Gecikmez ve Gecikme Göstermez, bu da hem manuel hem de robot ticareti için ideal hale getirir. Kullanıcı kılavuzu: ayarlar, girişler ve strateji. Atom Analisti, Piyasada Daha İyi Bir Avantaj Bulmak İçin Fiyatın Gücünü ve Momentumunu Kullanan PA Fiyat Hareketi Göstergesidir. Gürültüleri ve Yanlış Sinyalleri Kaldırmaya ve Ticaret Potansiyelini Artırmaya Yardımcı Olan Gelişmiş Filtrelerle Donatılmıştır. Birden fazla katma
Öncelikle, bu Ticaret Aracının Non-Repainting, Non-Redrawing ve Non-Lagging Gösterge olduğunu vurgulamakta fayda var, bu da onu profesyonel ticaret için ideal hale getiriyor. Çevrimiçi kurs, kullanıcı kılavuzu ve demo. Akıllı Fiyat Hareketi Kavramları Göstergesi, hem yeni hem de deneyimli tüccarlar için çok güçlü bir araçtır. İleri ticaret fikirlerini, Inner Circle Trader Analizi ve Smart Money Concepts Ticaret Stratejileri gibi 20'den fazla kullanışlı göstergeyi bir araya getirerek bir araya g
ŞU ANDA %26 INDIRIMLI Yeni Başlayanlar veya Uzman Tüccarlar için En İyi Çözüm! Bu Gösterge benzersiz, yüksek kaliteli ve uygun fiyatlı bir ticaret aracıdır çünkü bir dizi tescilli özellik ve yeni bir formül ekledik. Sadece BİR grafik ile 28 Forex çifti için Döviz Gücünü okuyabilirsiniz! Yeni bir trendin veya scalping fırsatının tam tetik noktasını belirleyebildiğiniz için ticaretinizin nasıl gelişeceğini hayal edin? Kullanım kılavuzu: buraya tıklayın Bu ilk olan, orijinal! Değersiz bir
Tanıtım       Kuantum Trend Keskin Nişancı Göstergesi   , trend tersine dönmeleri belirleme ve ticaret yapma şeklinizi değiştiren çığır açan MQL5 Göstergesi! 13 yılı aşkın ticaret tecrübesine sahip deneyimli tüccarlardan oluşan bir ekip tarafından geliştirilmiştir.       Kuantum Trend Keskin Nişancı Göstergesi       trend dönüşlerini son derece yüksek doğrulukla belirlemenin yenilikçi yolu ile ticaret yolculuğunuzu yeni zirvelere taşımak için tasarlanmıştır. ***Kuantum Trend Keskin Nişancı Gö
M1 Arrow
Oleg Rodin
4.73 (15)
Piyasanın iki temel ilkesine dayanan bir gün içi stratejisi. Algoritma, ek filtreler kullanarak hacimlerin ve fiyat dalgalarının analizine dayanmaktadır. Göstergenin akıllı algoritması, yalnızca iki piyasa faktörü bir araya geldiğinde bir sinyal verir. Gösterge, daha yüksek zaman çerçevesinin verilerini kullanarak M1 grafiğinde belirli bir aralıktaki dalgaları hesaplar. Ve dalgayı doğrulamak için gösterge, hacme göre analizi kullanır. Bu gösterge hazır bir ticaret sistemidir. Bir tüccarın ihtiya
TPSpro RFI Levels
Roman Podpora
4.83 (23)
Reversal First Impulse levels (RFI)    INSTRUCTIONS        RUS       -       ENG              R ecommended to use with an indicator   -   TPSpro  TREND PRO -  Version MT5 A key element in trading is zones or levels from which decisions to buy or sell a trading instrument are made. Despite attempts by major players to conceal their presence in the market, they inevitably leave traces. Our task was to learn how to identify these traces and interpret them correctly. Main functions: Displaying activ
TPSproTREND PrO
Roman Podpora
4.78 (18)
TPSpro TRENDPRO  - is a trend indicator that automatically analyzes the market and provides information about the trend and each of its changes, as well as giving signals for entering trades without redrawing! The indicator uses each candle, analyzing them separately. referring to different impulses - up or down impulse. Exact entry points into transactions for currencies, crypto, metals, stocks, indices!  Version MT5             DETAILED DESCRIPTION              R ecommended to use with an indi
- Real price is 80$ - 50% Discount ( It is 39$ now ) Contact me for instruction, any questions! Introduction The breakout and retest strategy is traded support and resistance levels. it involves price breaking through a previous level.  The break and retest strategy is designed to help traders do two main things, the first is to avoid false breakouts. Many false breakouts start with a candlestick that breaks out of a level but ends with an immediate candlestick that brings the price back into t
Break and Retest
Mohamed Hassan
4.4 (15)
This Indicator only places quality trades when the market is really in your favor with a clear break and retest. Patience is key with this price action strategy! If you want more alert signals per day, you increase the number next to the parameter called: Support & Resistance Sensitivity.  After many months of hard work and dedication, we are extremely proud to present you our  Break and Retest price action indicator created from scratch. One of the most complex indicators that we made with ove
Trend Screener
STE S.S.COMPANY
4.82 (92)
Trend Göstergesi, Trend Alım Satım ve Filtreleme için Çığır Açan Benzersiz Çözüm, Tüm Önemli Trend Özellikleriyle Tek Bir Araç İçinde Yerleştirildi! Forex, emtialar, kripto para birimleri, endeksler ve hisse senetleri gibi tüm sembollerde/araçlarda kullanılabilen %100 yeniden boyamayan çoklu zaman çerçevesi ve Çoklu para birimi göstergesidir. Trend Screener, grafikte noktalarla ok trend sinyalleri sağlayan etkili bir trend trend göstergesidir. Trend analizörü göstergesinde bulunan özellikler: 1.
TakePropips Donchian Trend Pro
Eric John Pajarillaga Aldana
4.61 (18)
TakePropips Donchian Trend Pro   (MT4), Donchian Kanalı'nı kullanarak trendin yönünü otomatik olarak tespit eden ve size ticarete giriş ve çıkış sinyalleri sağlayan güçlü ve etkili bir araçtır! Bu çok işlevli gösterge, bir trend tarayıcı, ticaret sinyalleri, istatistiksel panel, tarayıcı, ticaret oturumları ve uyarı geçmişi panosu içerir. Size ticaret sinyalleri sağlamak ve çizelgeleri analiz ederek saatlerce tasarruf etmenizi sağlamak için tasarlanmıştır! Kullanım kılavuzunu ve kurulum kılavuzu
ŞU ANDA %31 INDIRIMLI !!! Yeni Başlayanlar veya Uzman Tüccarlar için En İyi Çözüm! Bu gösterge benzersiz, yüksek kaliteli ve uygun fiyatlı bir ticaret aracıdır çünkü bir dizi tescilli özellik ve gizli bir formül ekledik. Yalnızca BİR grafikle 28 döviz çiftinin tümü için Uyarılar verir. Yeni bir trendin veya scalping fırsatının tam tetik noktasını belirleyebildiğiniz için ticaretinizin nasıl gelişeceğini hayal edin! Yeni temel algoritmalar üzerine inşa edilen bu sistem, potansiyel işlemler
Şu anda %20 İNDİRİMLİ! Herhangi bir Acemi veya Uzman Tüccar için En İyi Çözüm! Bu gösterge paneli yazılımı 28 döviz çifti üzerinde çalışıyor. Ana göstergelerimizden 2'sine (Gelişmiş Para Birimi Gücü 28 ve Gelişmiş Para Birimi Dürtüsü) dayanmaktadır. Tüm Forex piyasasına harika bir genel bakış sağlar. Gelişmiş Para Birimi Gücü değerlerini, para birimi hareket hızını ve tüm (9) zaman dilimlerinde 28 Forex çifti için sinyalleri gösterir. Trendleri ve / veya scalping fırsatlarını belirlemek içi
Ultimate Sniper Dashboard
Hispraise Chinedum Abraham
4.85 (27)
İndirimli fiyatı 299$! Fiyatlar gelecekte artabilir! Aşağıdaki açıklamayı okuyun! Ultimate Sniper Dashboard için En İyi Giriş Sistemi: NIHAI DINAMIK SEVIYELER. (Lütfen Ürünlerimi Kontrol Edin) Ultimate Sniper Dashboard, MT4 çoklu para birimi test limitleri nedeniyle SADECE canlı piyasalarda çalışır. Ultimate-Sniper Dashboard ile tanışın! Hem HA-Sniper hem de MA-Sniper içeren en iyimiz. ve birçok özel mod. Ultimate Sniper Dashboard mutlak bir canavar! Herhangi bir Acemi veya Uzman Tüccar
RelicusRoad Pro
Relicus LLC
4.73 (141)
Şimdi 147 $ (birkaç güncellemeden sonra 499 $ 'a yükseliyor) - Sınırsız Hesaplar (PC'ler veya Mac'ler) RelicusRoad Kullanım Kılavuzu + Eğitim Videoları + Özel Discord Grubuna Erişim + VIP Durumu PİYASAYA BAKMAK İÇİN YENİ BİR YOL RelicusRoad, forex, vadeli işlemler, kripto para birimleri, hisse senetleri ve endeksler için dünyanın en güçlü ticaret göstergesidir ve yatırımcılara kârlı kalmaları için ihtiyaç duydukları tüm bilgileri ve araçları sağlar. Başlangıç ​​seviyesinden ileri seviyey
How to use Pair Trading Station Pair Trading Station is recommended for H1 time frame and you can use it for any currency pairs. To generate buy and sell signal, follow few steps below to apply Pair Trading Station to your MetaTrader terminal. When you load Pair Trading Station on your chart, Pair Trading station will assess available historical data in your MetaTrader platforms for each currency pair. On your chart, the amount of historical data available will be displayed for each currency pai
Advanced Supply Demand
Bernhard Schweigert
4.9 (314)
CURRENTLY 26% OFF !! Best Solution for any Newbie or Expert Trader! This indicator is a unique, high quality and affordable trading tool because we have incorporated a number of proprietary features and a new formula. With this update, you will be able to show double timeframe zones. You will not only be able to show a higher TF but to show both, the chart TF, PLUS the higher TF: SHOWING NESTED ZONES. All Supply Demand traders will love it. :) Important Information Revealed Maximize the potenti
XQ Indicator MetaTrader 4
Marzena Maria Szmit
3.67 (3)
Step into the realm of Forex trading with confidence and precision using XQ, a cutting-edge Forex indicator designed to elevate your trading game to unprecedented heights. Whether you're a seasoned trader or just stepping into the world of currency exchange,   XQ Forex Indicator   empowers you with the insights and signals needed to make informed trading decisions. The signal conditions are a combination of three indicators, and XQ Forex Indicator only display  medium and long-term trends . The
IX Power MT4
Daniel Stein
5 (6)
IX Power nihayet FX Power'ın rakipsiz hassasiyetini Forex dışı sembollere getiriyor. En sevdiğiniz endeksler, hisse senetleri, emtialar, ETF'ler ve hatta kripto para birimlerindeki kısa, orta ve uzun vadeli eğilimlerin yoğunluğunu doğru bir şekilde belirler. Terminalinizin sunduğu her şeyi analiz edebilirsiniz. Deneyin ve işlem yaparken zamanlamanızın nasıl önemli ölçüde iyileştiğini deneyimleyin. IX Power Temel Özellikler 100 hassas, yeniden boyanmayan hesaplama sonuçları - terminalini
Apollo Fiyat Hareket Sistemi, tamamen Fiyat Hareketi ilkesine dayalı bir göstergedir. Gösterge, göstergenin stratejisine göre piyasaya giriş koşulları oluştuğu anda alım veya satım sinyali verir. Gösterge, temel bir ticaret sistemi olarak veya kendi ticaret sisteminize ek olarak kullanılabilir. Bu göstergenin kullanımı çok kolaydır. Sadece sinyalleri takip etmeniz gerekiyor. Gösterge, grafikteki trend çizgilerinin yanı sıra pazara giriş noktalarını ve Zarar Durdurma seviyesini gösterir. Kârı sab
Introduction to X3 Chart Pattern Scanner X3 Cherart Pattern Scanner is the non-repainting and non-lagging indicator detecting X3 chart patterns including Harmonic pattern, Elliott Wave pattern, X3 patterns, and Japanese Candlestick patterns. Historical patterns match with signal patterns. Hence, you can readily develop the solid trading strategy in your chart. More importantly, this superb pattern scanner can detect the optimal pattern of its kind. In addition, you can switch on and off individu
Fiyat tersine döndükçe ve geri çekildikçe piyasa yapısından elde edilen kâr değişir. Piyasa yapısını tersine çevirme uyarısı göstergesi, bir trendin veya fiyat hareketinin ne zaman tükenmeye yaklaştığını ve tersine dönmeye hazır olduğunu tanımlar. Genellikle bir geri dönüş veya büyük bir geri çekilme meydana gelmek üzereyken meydana gelen piyasa yapısındaki değişiklikler konusunda sizi uyarır. Gösterge, olası bir tükenme noktasının yakınında her yeni yüksek veya düşük oluştuğunda, başlangıçta
Yazarın diğer ürünleri
HFTHacker
Thomas Bradley Butler
Sinyal: Profilimdeki HFT Hacker bağlantısı *TEST VE KULLANMADAN ÖNCE EA'YI OPTİMİZE EDİN. SADECE OPTİMİZE ETTİYSENİZ SATIN ALIN. Bu, nasıl optimize edileceğini bilen ve kendi yararına kâr etmek isteyen yatırımcılar içindir. RİSK PARAMETRELERİNİZİ SİZ AYARLAYIN. Seçtiğiniz takdirde işe yaramayan işlemler için stoplarla yüksek kazanma oranı. Uzun ömür riskini azaltın. Bu, tüm hesaplarda çalışır ve bir risk yönetimi aracıdır; tüm yorumları, açıklamaları ve blogu OKUYUN. En iyi sonuçları elde etme
Bitcoin M5
Thomas Bradley Butler
TEST VE KULLANMADAN ÖNCE EA'YI OPTİMİZE EDİN. Bitcoin M5, 5 dakikalık grafiklerde BTC/USD ticareti yapmak içindir. SL ve TP 50000 ile Başlamalıdır. KULLANMADAN ÖNCE OPTİMİZE EDİN Ticaret stratejisi, ticaret yapmak için Bollinger Bantları ve Zarf göstergelerini kullanır. Fiyatın bantları ihlal ettiği bazı kırılma noktalarını yakalamak için işlem yapmak ve ardından fiyat zarfları geçtiğinde çıkış yapmak. Her işlemde sabit bir lot miktarı kullanılır ve bir SL ve TP bulunur. EA, mantıkta mart
NeuroScalper
Thomas Bradley Butler
5 (2)
Güncelleme! 100 ve 200 seviyelerine oklar eklendi. Bu gösterge, uç noktalara erişim için doğrudur ve öncelikle 1 dakikalık zaman dilimleri için satın alma pozisyonları için destekler. Diğer zaman dilimleri kullanılabilir ancak seviyeler farklıdır. Daha iyi bir osilatördür ve farkı görmek için diğerleriyle karşılaştırır. Nöro ağ kavramlarını kullanarak günlük ticaret. Bu gösterge, satın almak ve satmak için sinyaller üretmek için temel nöro ağ biçimlerini kullanır. Göstergeyi 1 dakikalık gr
HFTHackerMT5
Thomas Bradley Butler
5 (1)
Sinyal: Profilimdeki HFT Hacker bağlantısı *TEST VE KULLANMADAN ÖNCE EA'YI OPTİMİZE EDİN. SADECE OPTİMİZE ETTİYSENİZ SATIN ALIN. Bu, nasıl optimize edileceğini bilen ve kendi yararına kâr etmek isteyen yatırımcılar içindir. RİSK PARAMETRELERİNİZİ SİZ AYARLAYIN. Seçtiğiniz takdirde işe yaramayan işlemler için stoplarla yüksek kazanma oranı. Uzun ömür riskini azaltın. Bu, tüm hesaplarda çalışır ve bir risk yönetimi aracıdır; tüm yorumları, açıklamaları ve blogu OKUYUN. En iyi sonuçları elde etme
VolumeDayTrader
Thomas Bradley Butler
Yalnızca HİSSE SENETLERİ(CFD'ler) İÇİN GÜNLÜK TİCARETİ. Ticaret emek ister. Tüm girişleri ve çıkışları size bildirecek hiçbir kısayol veya gösterge yoktur. Kâr, akıl durumundan gelir. Göstergeler, para yönetimi ve başarı psikolojisi ile birlikte kullanılacak araçlardır. Hacim profilindeki dengesizlikleri bulun. Ticaret fiyat hacmi dengesizlikleri. Kapanışta ve açılışta ve haberlerde birçok dengesizlik olur. Hisse senetlerinde alıcılara karşı satıcılara bakın. Fiyat üzerinde kimin kontrol sa
Arz ve talep ticaretini otomatikleştirin. Pazar yap. Bu EA, herkesin sattığı ve taklit ettiği popüler arz ve talep göstergesinden esinlenerek yapılmıştır. EA, bir piyasa oluşturarak ticarete ve riskten korunmaya devam ediyor. Riskten korunma amaçlı olmayan hesaplarda da işlem görebilir. Riskleri değerlendirmeli ve zaman dilimlerini, parti büyüklüklerini ve riskten korunma yeteneklerini kullanmalıdır. Toplamda yaklaşık bir ay boyunca aynı anda birden fazla çift üzerinde işlem yaptım. Sistem
NeuroScalperMT5
Thomas Bradley Butler
MT4 indicator version https://www.mql5.com/en/market/product/72342 I personally use this indicator to scalp.  Accurate for accessing extremes and supports for buy positions primarily for 1 minute time frames.  Other time frames can be used but the levels are different. Its a better oscillator and compare with others to see the difference.          Day trade using neuro network concepts.  This indicator uses elementary forms of neuro networks to generate signals to buy and sell. Use the indicat
OPTMIZE EA BEFORE BACKTEST AND USE. Pin Bar Scalper scalps pin bars and momentum on 5 minute charts on the EUR/USD.  Optimize the parameters to get the best  out of the EA.  Pin bars are popular candlesticks that show that the price has been taken over by the bulls or bears. The inputs are based around the size of the pin bars in %, which are 3 different ones.  Wicks and body are the calculations within the parameter.  Test file in comments for example only.  Trade the dates _
ForexReversal
Thomas Bradley Butler
4 (1)
Sabır, stressiz saç derisinin anahtarıdır. 200 hareketli ortalamayı geçtiğini gördüğünüzde okları değiştirin ve hareketli ortalama filtresi olmadan son salınım noktasından genişleyerek bir trend oluşturun. 1 dakikalık zaman dilimleri için güzel, gün içi hareketlere ivme kazandırıyor. Kolaylıkla 20 pip alın veya sondaki durakları kullanarak daha büyük trendler için daha uzun kalın. Bu göstergeden gerçekten büyük işlemlerin fotoğraflarındaki örneklere bakın. 1 dakikalık zaman dilimleri en iyi son
Level 2 Trading
Thomas Bradley Butler
AKILLI HACİM TAKİPÇİSİYLE BİRLEŞTİRİN: https://www.mql5.com/en/market/product/116650 AYAK İZİ TABLOSU İLE BİRLEŞTİRİN: https://www.mql5.com/en/market/product/94153 BÖLGEDEKİ TİCARET İLE BİRLEŞTİRİN: https://www.mql5.com/en/market/product/110194 VOLUM DAY TRADER İLE BİRLEŞİN: h https://www.mql5.com/en/market/product/72498 SİPARİŞ DEFTERİ İLE BİRLEŞTİRİN: https://www.mql5.com/en/market/product/102247 Seviye 2 Ticaret, MetaTrader grafiğinizde mevcut teklif ve satış hacimlerini görselleşt
GoldBuyBackScalper
Thomas Bradley Butler
4 (1)
Bu gösterge yalnızca XAU/USD, 1 dakikalık grafikler içindir. Her çiftin benzersiz özellikleri ve fiyat hareketleri vardır. Bu gösterge ile V şeklinde geri dönüşler yapın. Saç derisi, takip eden durakları kullanarak satın alır ve daha aşırı oldukları ve ani satışlara neden olabileceği için haberlerden kaçınır. Geriye dönük testte 1 dakikalık zaman dilimine ekleyin ve ters alımları görün. Gösterge asla yeniden boyamaz veya yeniden hesaplamaz. YALNIZCA AKTİF SAATLERDE TİCARET YAPIN
TrueSupplyandDemand
Thomas Bradley Butler
This is based on short term strength or weakness and not on moving averages.  Moving averages are used for filter only. Trade supply and demand with arrows. Supply and demand breakouts and strength of the buyers or sellers .  Don't trade buy arrow to sell arrow.  Trade the strength with trendlines or moving averages and use stops.  The arrow can have some strong moves.  Trade on all time frames.  Try it out in the back tester. The pips can be made with this indicator, follow the arrows and mak
ScalpingMaster
Thomas Bradley Butler
Master scalping with this indicator.  Trade on any time frame for scalps on buy or sells.  Follow trends using a 200 moving average and stops and targets.  Use with your own system.  This indicator can give pips if following it correctly.  Stick to rules and pick up pips daily.  Use as entries in a trend, scalp for a few pips or exit on opposite signal.  Best to follow higher time frame trends. Indicator doesn't repaint or recalculate. Rules: Don't trade overnight, only trade during active sessi
DayTradeKing
Thomas Bradley Butler
This indicator is good for small time frames like 1 and 5 minutes and made for day trading. The indicator never repaints or recalculates. The indicator works is for trading swing points in day trading, following bulls or bears.  Its a simple to use, non cluttered indicator with a high success rate.  This indicator works well to capture ranges.  All indicators come with limitations and no indicator or system is always accurate. Use money management for long term trading success.   Place in backte
DTKGold
Thomas Bradley Butler
This is the DayTradeKing for gold on a 1 minute time frame.  It is a different calculation for the range. Use a 200 period moving average as a filter.  Always use stops and avoid news, wait for more conformation.  This looks to capture intraday ranges. Put it in the back tester on 1 minute to see the price action and how it works. Trade with trend Use filter Use stops Alerts are added for pop ups and sound. 
SuperArrowScalper
Thomas Bradley Butler
Trade trends with the Super Scalper Use on all time frames and assets it is  designed for scalping trends. Works good on small time frames for day trading.  The arrows are easy to follow.  This is a simple no repaint/no recalculate arrow indicator to follow trends with.  Use in conjunction with your own system or use moving averages.  Always use stops just below or above the last swing point or your own money management system The indicator comes with push notifications, sound alerts and email
Levels Trading
Thomas Bradley Butler
This indicator is a simple stripped down version of any advanced support and resistance indicator.  All the support and resistance indicators work from a number of bars that have developed over time. Get rid of clutter and confusing levels.  Find levels according to a number of bars. Look at days, session, numbers of hours, periods of consolidation.  Watch levels develop and use as breakout points, or areas of buyers and sellers.  Features and things to consider This indicator is for a frame of
https://www.mql5.com/en/market/product/57345 Bu EA, Forex Ters Göstergesine dayanmaktadır. Sistemi manuel olarak takas etmeyi tercih ediyorsanız, göstergeyi indirin ve deneyin. EA, trendi takip edecek ve buna göre pozisyonlar açacaktır. Sonuçlar, daha düşük düşüş ile istikrarlı kazançlar gösteriyor, ancak neyin işe yaradığını görmek için arka test cihazı, optimize edici ve zaman dilimlerinde denemeler yapın. Gösterilen tüm sonuçlar varsayımsaldır. Not: Bu bir martingale veya ızgara değildir
MarketMaker
Thomas Bradley Butler
Arz ve talep ticaretini otomatikleştirin. Pazar yap. Bu EA, herkesin sattığı ve taklit ettiği popüler arz ve talep göstergesinden esinlenerek yapılmıştır. EA, bir piyasa oluşturarak ticarete ve riskten korunmaya devam ediyor. Riskten korunma amaçlı olmayan hesaplarda da işlem görebilir. Riskleri değerlendirmeli ve zaman dilimlerini, parti büyüklüklerini ve riskten korunma yeteneklerini kullanmalıdır. Toplamda yaklaşık bir ay boyunca aynı anda birden fazla çift üzerinde işlem yaptım. Si
Top Trader
Thomas Bradley Butler
Top Trader Indicator This is an arrow reversal indicator. This is with deviations and arrows.  Trade a blue arrow for buy and trade a red arrow for sell.  Change the time period and the deviations of the bands.  This is similar to others but these arrows don't repaint.  Load in back tester and study which periods and deviations work the best.  It works on all time frames.  15 min to 1 hr would give good results for take profits.  Try according to your own risk management.
Quant Bot
Thomas Bradley Butler
Quant Bot, EUR/USD için bir saatlik zaman diliminde trend ticareti içindir. Set dosyası yok, ancak diğer çiftler kullanılıyorsa, optimizasyona ihtiyacı olabilir. Bot hakkında: Genetik üretimi kullanır ve ticaret yapmak için ATR'yi kullanır. Eğrinin oturmasını önlemek için ileri yürüme periyodu kullanıldı EA, her ticarette durak kullanır. Para yönetimi, bakiye yüzdesi ile bir ölçeklendirmedir Geri çekilme dönemi 2003-2020 arasındadır ve ileriye yürüme 2020-2022 arasındadır. (Resimlere bakın)
Crypto Net
Thomas Bradley Butler
Aracı süreleri, stratejinin oluşturulduğundan farklı olacaktır. Crypto Net, 1 saatlik zaman dilimlerinde BTCUSD  Stratejiyi geliştirmek için genetik evrimi kullanır. Bu EA, ATR ve Ichimoku göstergelerini takip eden trendi ticaret yapıyor. Bu, Monte Carlo ve Walk Forward dahil olmak üzere bir dizi sağlam testten geçirildi ve geçti. Girişler: Minimum risk olan hesabın yüzdesi. Maksimum lot sayısı Ticareti durdurma zamanları Başka hiçbir şey değişmez.
XAU/USD İÇİN Bu, ticareti takiben rastgele nesiller ve trendler kullanan istikrarlı bir ticaret sistemidir. Uzman, kaliteli verilerle tekrar test edildi, XAU/USD 1 saatlik zaman dilimlerinde fazla takılmayı önlemek için Monte Carlo simülasyonu ile birlikte bir optimizasyon dönemini tamamladı. Zarar Durdur ve Kar Al kullanılır. EA'nın birden fazla konfigürasyonu vardır ve kaç lot işlem yapacağınızı bulmaktan başka yapacak bir şey yoktur. Özellik: Bakiye bileşik kârlarının yüzdesini kul
PropTrader
Thomas Bradley Butler
*KULLANMADAN ÖNCE EA'YI OPTİMİZE EDİN* EUR/USD için Optimize Edilmiş Forex Ticaret Stratejisi Bir Uzman Danışman (EA) ile bir veya iki yıl içinde önemli bir servete ulaşmak gerçekçi olmayan bir iddiadır. Geriye dönük testler ve gerçek ticaret, EUR/USD döviz çiftine odaklanır. Bu Strateji Hakkında: Bu, daha fazla ilerleme potansiyeliyle birlikte stratejimizin ilk yinelemesini temsil ediyor. %100 kaliteli verilerle titizlikle test edilmiştir, MT4 hataları içermez. Strateji, mantıksal bir t
Down Under
Thomas Bradley Butler
Down Under, AUD/USD çiftini 1 saatlik bir zaman diliminde işlem görür. Bu EA, ATR ve OHLC'yi takas eder. Bu zaman çerçevesinde bu çift için biçimlendirilmiştir. Bileşik bir min ile kullanılır. parti büyüklüğü ve maks. lot büyüklüğü. Bakiyelerin yüzdesi, kazanan işlemlerde birleştirilir. Bakiye dalgalandıkça, parti büyüklüğü de değişir. Ayarlar: mm risk % mm sürü maksimum lot Değişecek başka bir şey yok. Bunun martingale veya riskten korunma yetenekleri yoktur. Değiştirilecek tek diğer
Cable Trader
Thomas Bradley Butler
GBP/USD 1hr. Bu EA, momentum ve oturumları takas eder. Bunun sabit bir parti bileşeni vardır ve geliştikçe TP'yi değiştirmeye devam edecektir. Ayarlar: Lot büyüklüğü Değişecek başka bir şey yok. Bunun martingale veya riskten korunma yetenekleri yoktur. Değiştirilecek tek diğer özellik, işlem yapıyorsanız, GBP/USD CFD'leridir. Bunu, komisyoncu platformunda ondalık basamakla değiştirin. Risk Reddi Vadeli İşlemler, Opsiyonlar ve Döviz ticaretinin hepsinin büyük potansiyel ödülleri
Euclidean
Thomas Bradley Butler
Öklid, 8 yıl önce bulduğum benzersiz bir ticaret algoritmasıdır. Bu EA, bu sistemin bir parçasıdır. Kapalı sistem olarak çalışmaktadır. EA, bir trend yakalamak için açı derecesi doğru olduğunda bir satın alma başlatacaktır. Durdurma kaybı, açıdan %10'dur. Bu kadar basit. Girişler: % del saldo in lotti 1 micro lotto per $ 1.000 lotlarda bakiye yüzdesi Hacim üst lotlar = maksimum lot miktarı Kâr seviyesini al = varsayılan 50 pip Nasıl yapılır ve dikkate alınması gerekenler: Stoploss yerleşi
Pip Scalper
Thomas Bradley Butler
HERKES İÇİN BİR GÖSTERGE Pip Scalper è per le tendenze dello scalping. Rimani nelle tendenze più a lungo con questo indicatore. Funziona su tutti i tempi e le risorse. Raccogli pip giornalieri con questo strumento. Usa la media mobile 200 per filtrare le operazioni. Si consigliano tempi più brevi. Utilizzare per il day trading. Informazioni e modalità di utilizzo: Pips Scalper si basa sul trend trading a lungo termine. Acquista in blu Vendi su Rosso Usa 200 medie mobili come filtro e fa
Order Flow Trader
Thomas Bradley Butler
Just a simplified way of observing the volume.  It shows the buy flow against the sell flow.  See the volume coming in and trade with the money.  Visualize the trend rising or falling and trade according to the imbalance in volume.  Use for scalping and trend trading.  Trade by volume coming in. FOOTPRINT CHART:  https://www.mql5.com/en/market/product/94153 Order Book:  https://www.mql5.com/en/market/product/102247 EA Based:  https://www.mql5.com/en/market/product/82585 Note: Works in real
TEST ÖNCESİ OPTİMİZASYON YAPIN VE EN İYİ GİRDİLERİ BULMAK İÇİN KULLANIN Hey tüccarlar! MT4 platformunuz için son teknoloji ürünü bir Uzman Danışman mı istiyorsunuz? Evrimleşmiş Trendlerden başka bir yere bakmayın! Makine öğrenimi teknolojisiyle oluşturulan bu güçlü ticaret algoritması, 1 Saatlik zaman dilimlerinde GBP/USD ticareti yapmaya odaklanır. Ancak optimizasyon için diğer varlıkları ve zaman çerçevelerini denemekten çekinmeyin! Girişleri kendi risk toleransınıza uyacak şekilde özelleşt
Filtrele:
İnceleme yok
İncelemeye yanıt
Sürüm 3.0 2022.10.17
removed arrows due to not working on some pairs on sometime frames
Sürüm 2.0 2022.10.17
Arrows added