Volatility analyzer with alerts for MT4
- Göstergeler
- STE S.S.COMPANY
- Sürüm: 1.1
- Etkinleştirmeler: 10
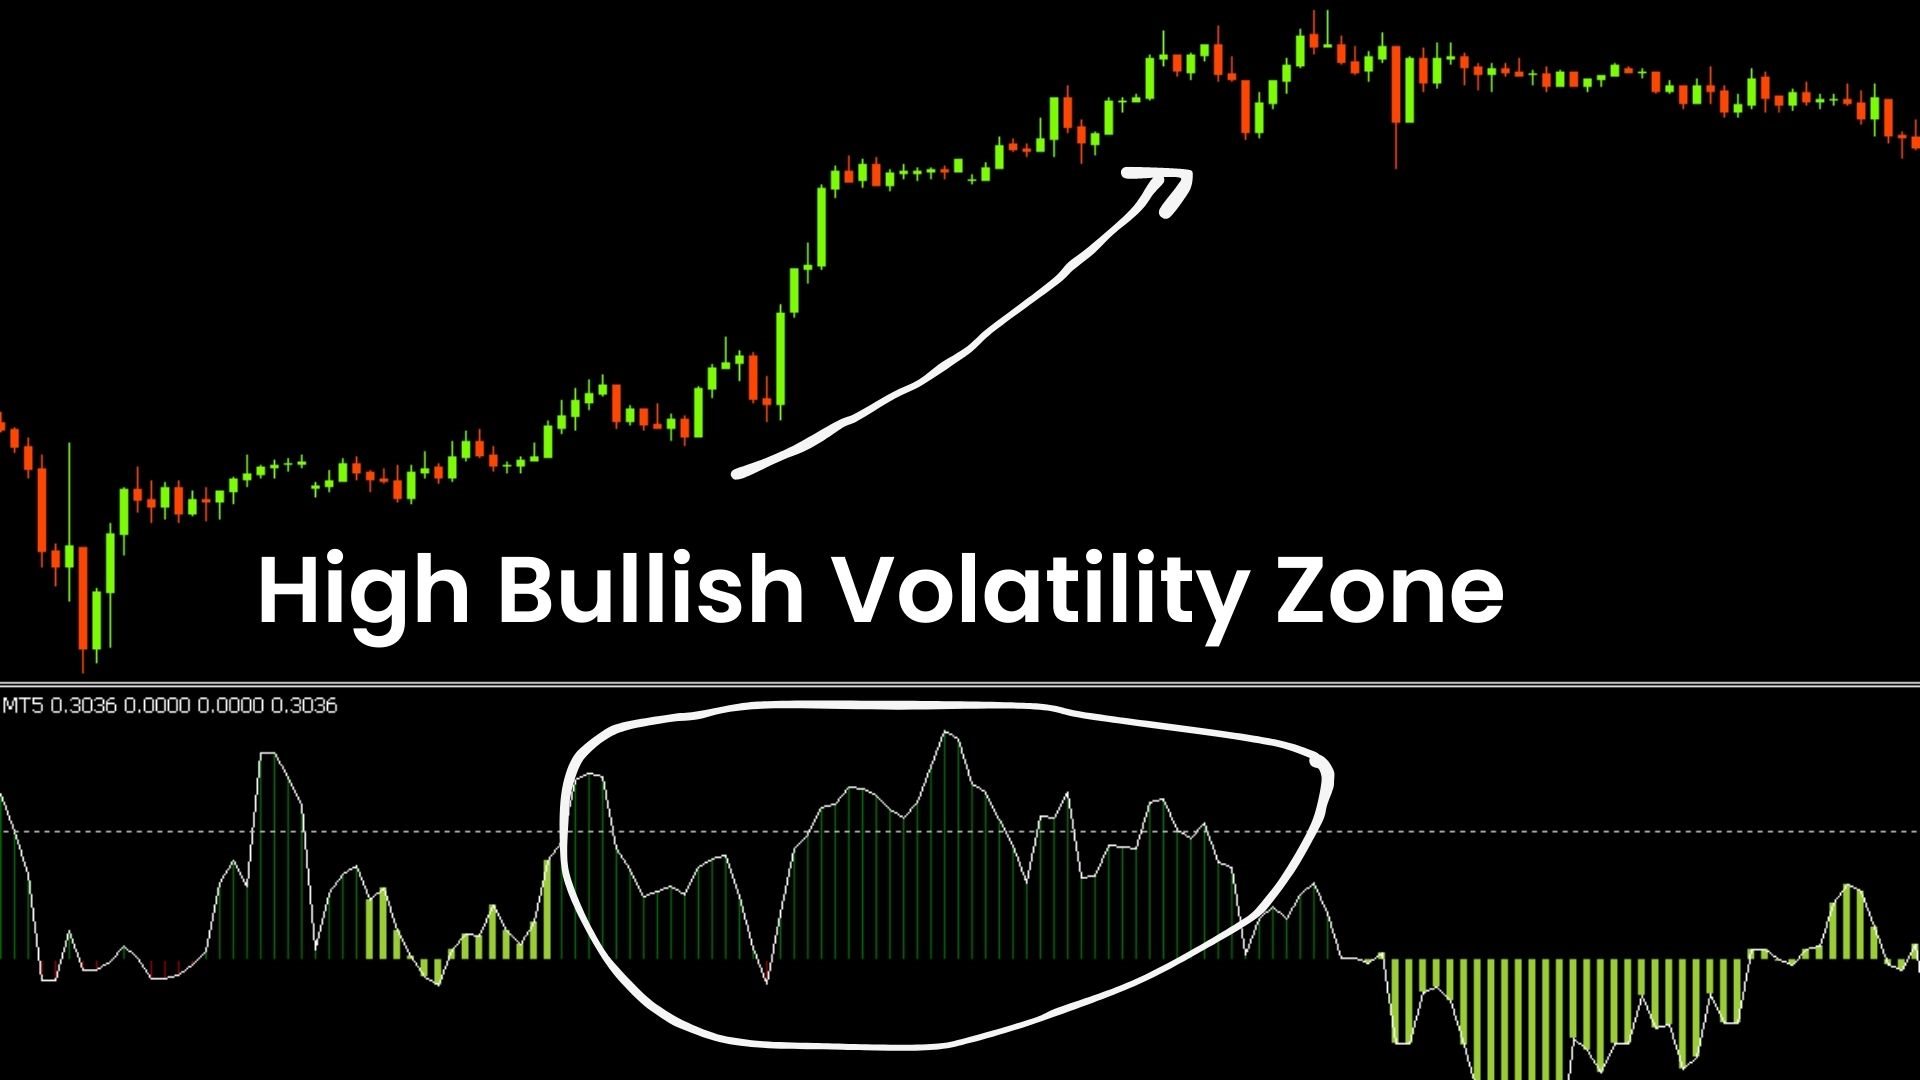
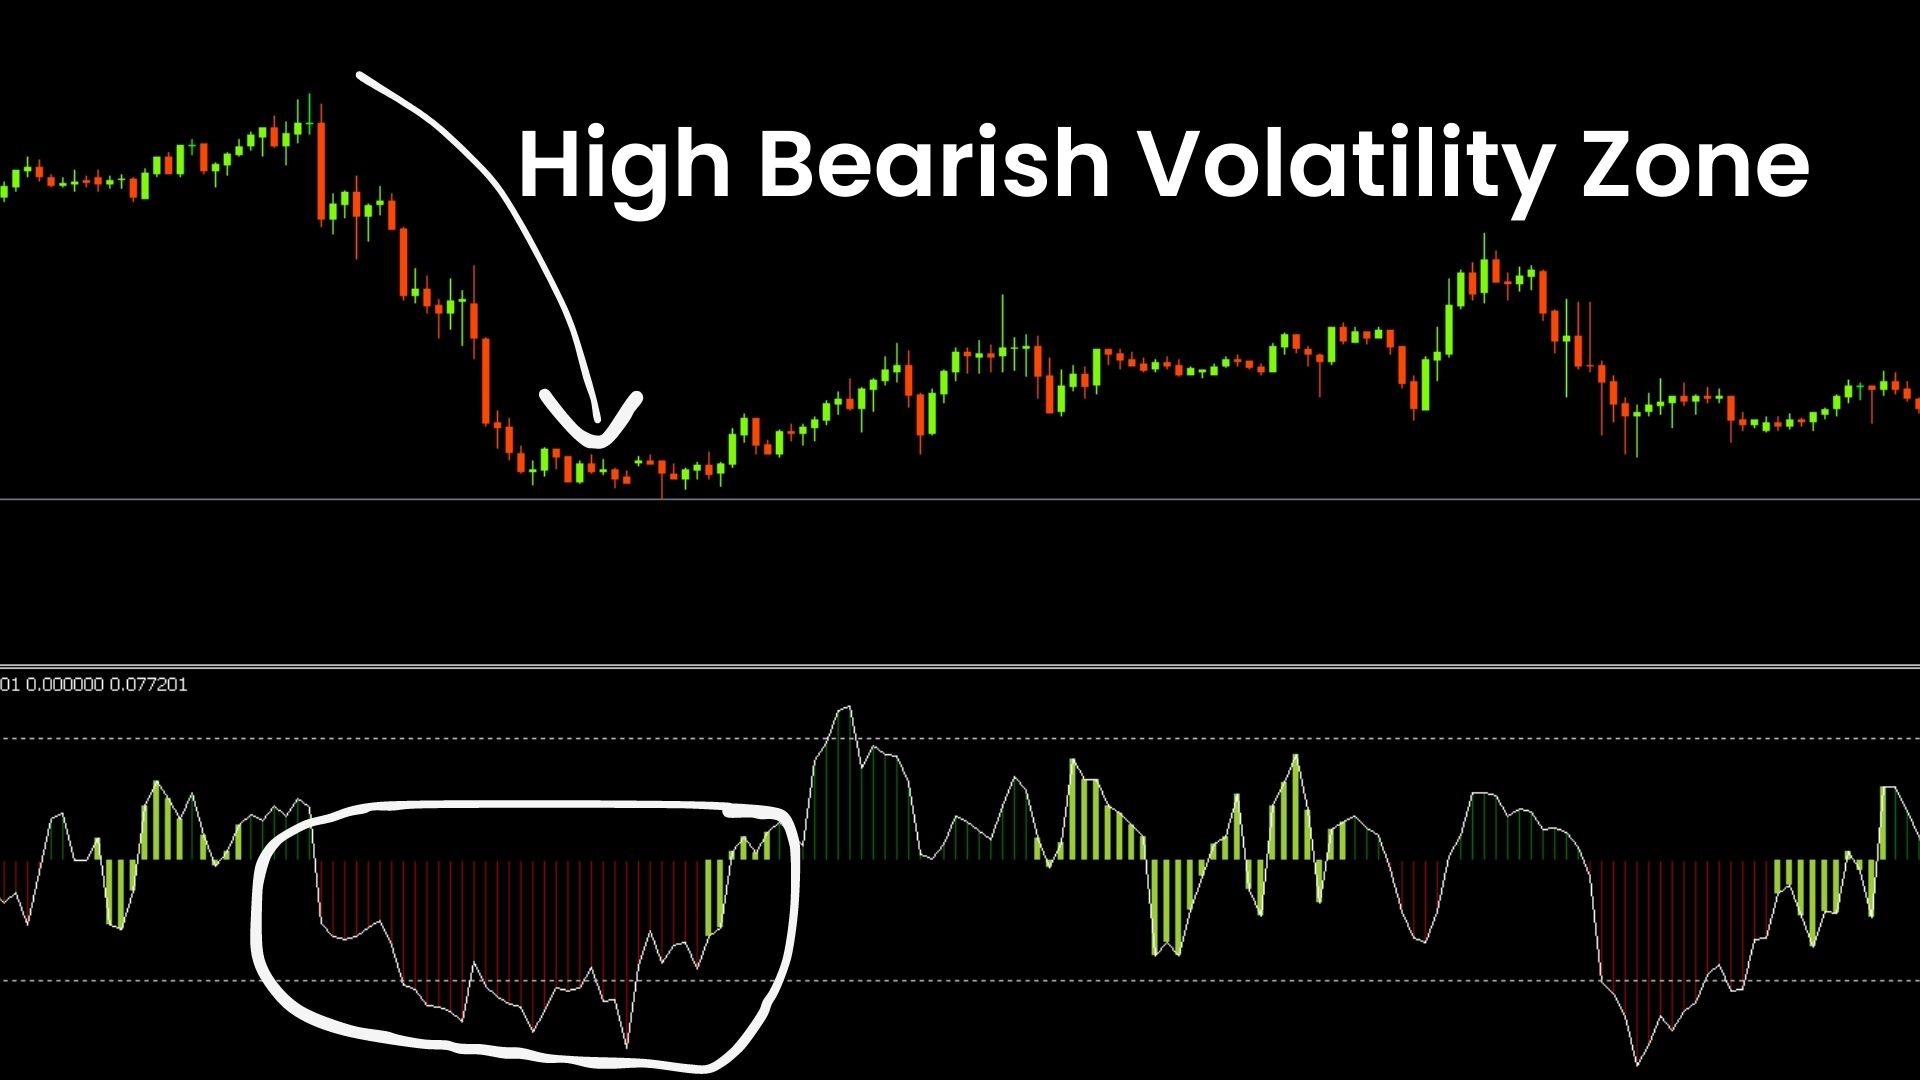
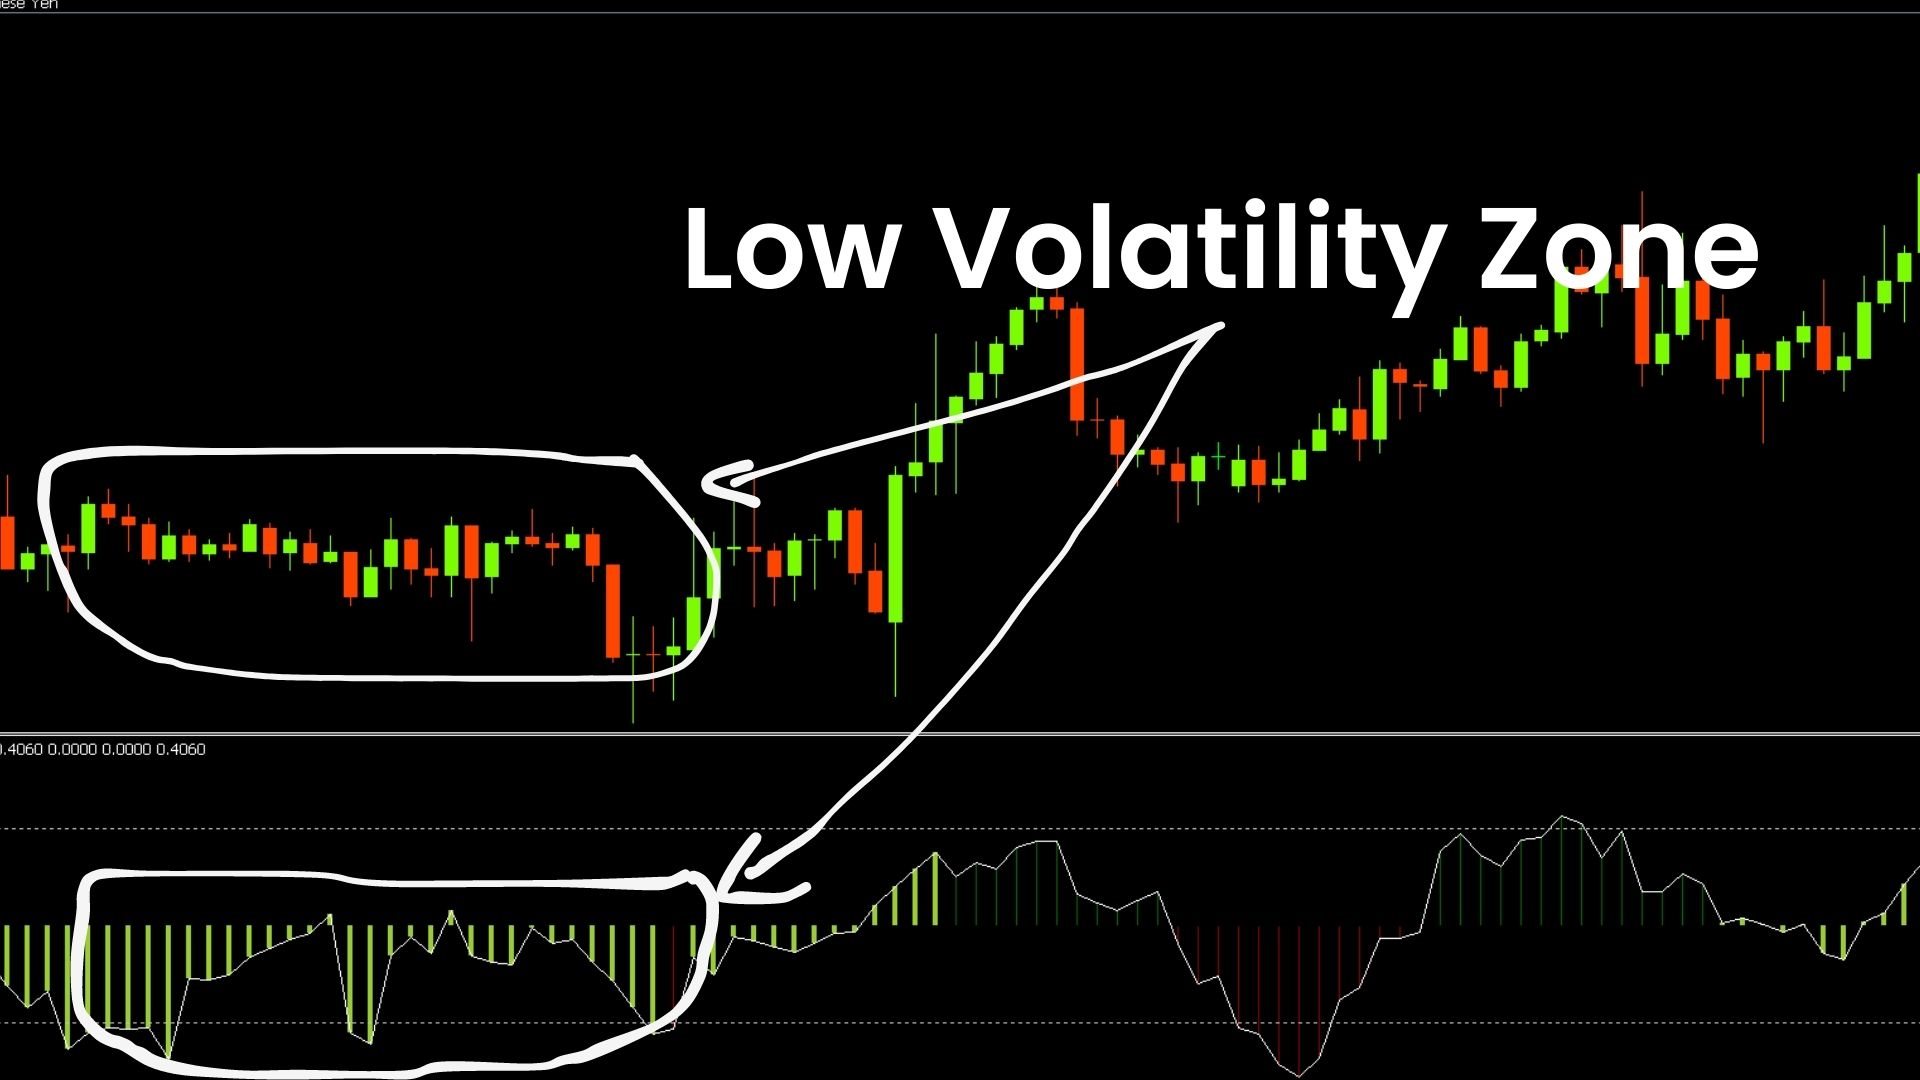
Oynaklık analizörü, sıkı bir ticaret aralığında konsolide edildikten sonra fiyatın güçlü bir şekilde kırılma eğiliminden yararlanan bir momentum göstergesidir. Gösterge ayrıca, sıkıştırma tetiklendiğinde hareketin beklenen yönünü göstermek için bir momentum osilatörü kullanır. Bu histogram sıfır çizgisi etrafında salınır, sıfır çizgisinin üzerinde artan momentum uzun satın alma fırsatını gösterirken, sıfır çizgisinin altına düşen momentum bir kısa devre fırsatını gösterebilir.
SINIRLI SÜRELİ TEKLİF : Gösterge sadece 50 $ ve ömür boyu kullanılabilir. (Orijinal fiyat 125$ )
Ana Özellikler
- Yanal eğilim dedektörü.
- Düşük Uçuculuk dedektörü.
- Yüksek Boğa ve Ayı Yüksek Volatilite dedektörleri.
- Tüm zaman dilimleri ve tüm çiftlerle çalışmak.
- Açılır uyarılar ve Push bildirim uyarıları sağlayın.
İletişim
Herhangi bir sorunuz varsa veya yardıma ihtiyacınız varsa lütfen Özel Mesaj yoluyla bana ulaşın.
Uyarı
Tüm göstergelerimiz ve araçlarımız ve yalnızca resmi Metatrader Mağazası (MQL5 Market) aracılığıyla edinilebilir.
Premium Göstergeler
MQL5 profilimize erişerek tüm ücretsiz ve premium göstergelerimizi bulabilirsiniz. Profilimize erişmek için buraya tıklayın.
Yazar
SAYADI ACHREF , fintech yazılım mühendisi ve Finansya Lab'ın kurucusu.