• Genel bakış
  • İncelemeler
  • Yorumlar
  • Yenilikler

Simple ATR modern

Simple ATR Modern

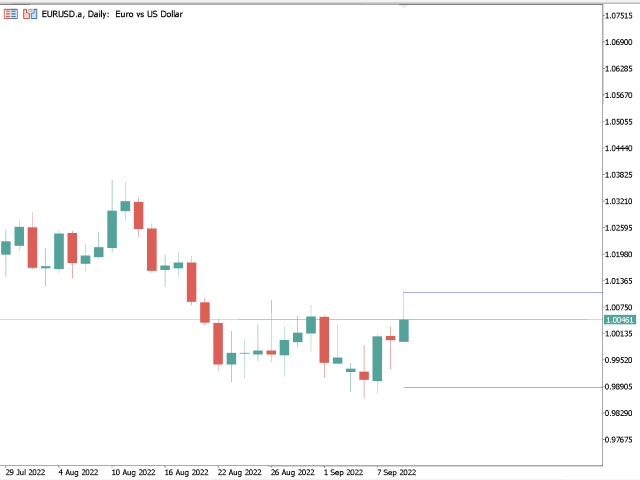
Piyasa oynaklığını daha net bir şekilde izlemek için basitleştirilmiş bir araç, hem günlük işlem hem de dalgalı işlem için idealdir.

Ticarete başlamak veya yeni başlayanlar için en iyi göstergedir.


Görsel Gösterge Rengi: ATR Daily - Mavi

Volatility Vision göstergesi ile birleştirerek analizinizi geliştirin.

Piyasa koşullarındaki dalgalanmaları kesin olarak ölçer, hem günlük işlem hem de dalgalı işlem kararları için gereklidir.

Doğruluğu sağlamak için 14 günlük basit hareketli ortalamayı (ayarlanabilir) kullanır.

Ticaret sistemlerinde açık veya kapalı stratejileri uygulamak için idealdir ve karlılığı maksimize eder.

ATR göstergelerinin diğerlerinden daha iyi olmasının nedenleri:

Kullanım kolaylığı: ATR göstergeleri, yeni başlayan tüccarlar için bile kurulumu ve anlaşılması kolaydır.

Çok yönlülük: Günlük işlem ve dalgalı işlem için uygundur ve çeşitli ticaret stratejilerinde esneklik sağlar.

Güvenilirlik: ATR, tüccarların daha bilinçli kararlar almasına yardımcı olan doğru piyasa oynaklık verileri sağlar.

Özelleştirilebilirlik: Hareketli ortalama periyodunu ayarlama yeteneği, tüccarların göstergeleri kendi özel ihtiyaç ve tercihlerine göre uyarlamalarını sağlar.

Birleştirilebilirlik: ATR, piyasa koşullarının daha derinlemesine analizi için Volatility Vision gibi diğer göstergelerle kolayca entegre olur.

Önerilen ürünler
Was: $249  Now: $99   Market Profile defines a number of day types that can help the trader to determine market behaviour. A key feature is the Value Area, representing the range of price action where 70% of trading took place. Understanding the Value Area can give traders valuable insight into market direction and establish the higher odds trade. It is an excellent addition to any system you may be using. Inspired by Jim Dalton’s book “Mind Over Markets”, this indicator is designed to suit the
The balance of supply and demand is a simple and effective market analysis method. The supply and demand diagram can show you in advance, even before the trend reversal, where the supply ends and the demand is already emerging, where the demand ends and the supply is emerging, while substantially increasing the probability of making a deal in the right direction and with a high profit factor. Indicator signals The indicator uses the price/volume values to generate signals: ED – excess demand.
This indicator allows you to enjoy the two most popular products for analyzing request volumes and market deals at a favorable price: Actual Depth of Market Chart Actual Tick Footprint Volume Chart This product combines the power of both indicators and is provided as a single file. The functionality of Actual COMBO Depth of Market AND Tick Volume Chart is fully identical to the original indicators. You will enjoy the power of these two products combined into the single super-indicator! Below is
VolumeProfile MT5
Robert Hess
3.75 (8)
Description: The Volume Profile displays detailed informations of historical trading activities at certain price levels (Market Profile). Locate the areas with the best prices in the market and get an advantage over other market participants. Features: Customizable Market Profile Shows the "fair" Value Area with 70% of all Volume Shows critical low volume zones Shows VPOC, VAL and VAH Points integrated resource management to reduce the load while working with multiple charts Works on all tim
BoxChart MT5
Evgeny Shevtsov
5 (7)
The market is unfair if only because 10% of participants manage 90% of funds. An ordinary trader has slim changes to stand against these "vultures". This problem can be solved. You just need to be among these 10%, learn to predict their intentions and move with them. Volume is the only preemptive factor that faultlessly works on any timeframe and symbol. First, the volume appears and is accumulated, and only then the price moves. The price moves from one volume to another. Areas of volume accumu
Waves PRO
Flavio Javier Jarabeck
For those who appreciate Richard Wyckoff approach for reading the markets, we at Minions Labs designed a tool derived - yes, derived, we put our own vision and sauce into this indicator - which we called Waves PRO . This indicator provides a ZigZag controlled by the market volatility (ATR) to build its legs, AND on each ZigZag leg, we present the vital data statistics about it. Simple and objective. This indicator is also derived from the great book called " The Secret Science of Price and Volum
Alpha Trend Pro
Eslam Mohamed Abdelrady Shehata
Alpha Trend Pro: Your Ultimate Trading Companion Embark on a new era of trading with Alpha Trend Pro Indicator. Crafted with precision and innovation, Alpha Trend is designed to elevate your trading experience by seamlessly blending powerful elements to navigate various market conditions. **Key Features:** **1. Dynamic Adaptability:**    - In sideways market conditions, Alpha Trend acts as a dead indicator. Say goodbye to many false signals and welcome a tool that adapts seamlessly to mar
Features 3 types of waves: bullish, bearish and unknown. The unknown tower comes when prices move in opposite the direction of the current tower. Label that shows the percentage remaining for the next tower. Allows you set the type of volume that will be accumulated in the towers, either real or tick volumes. Thus, the indicator works in any market, for example: stocks, futures, forex, commodities, etc. Allows you to set the required score for the tower exchange. Allows you to set the font size
WAPV Weis Wave Chart Forex
Eduardo Da Costa Custodio Santos
MT5 için Weis Wave Chart Forex bir Fiyat ve Hacim göstergesidir. Fiyat ve Hacim okuması, Richard Demille Wyckoff tarafından oluşturulan üç yasaya dayalı olarak geniş çapta dağıtıldı: Arz ve Talep, Neden ve Etki ve Çabaya Karşı Sonuç. 1900'de R.Wyckoff, analizlerinde dalga grafiğini zaten kullanmıştı. Yıllar sonra, 1990 civarında, David Weis Otomatikleştirilmiş R. Wyckoff'un dalga grafiği ve bugün size David Weis'in dalga grafiğinin evrimini sunuyoruz. Varlıkta üretilen dalga ile ilgili Hacim mik
Market profile was developed by Peter Steidlmayer in the second half of last century. This is a very effective tool if you understand the nature and usage. It's not like common tools like EMA, RSI, MACD or Bollinger Bands. It operates independently of price, not based on price but its core is volume. The volume is normal, as the instrument is sung everywhere. But the special thing here is that the Market Profile represents the volume at each price level. 1. Price Histogram The Price Histogram
Before installing the HeatMap indicator make sure you are using a broker that gives you access to the Depth of market (DOM) !! This indicator creates a heatmap on your chart allowing you to see the buy or sell limit orders easily and in real time. You have the possibility to change the setting and the colors of the HeatMap in order to adapt to all markets and all charts. Here is an example of a setting you can use with the NASDAQ100 on the AMPGlobal broker :  https://www.youtube.com/watch?v=x0
Z Score Plus MT5
Eduardo Da Costa Custodio Santos
Finansta Z Puanları, bir gözlemin değişkenliğinin ölçüleridir ve tüccarlar tarafından piyasa oynaklığının belirlenmesine yardımcı olmak için kullanılabilir. Z puanları, Traders'a bir puanın belirli bir veri kümesi için tipik mi yoksa atipik mi olduğunu söyler. Z puanları aynı zamanda analistlerin birden fazla veri kümesinden alınan puanları uyarlayarak birbirleriyle daha doğru bir şekilde karşılaştırılabilecek puanlar oluşturmasını sağlar. # Pratikte, sıfır noktalı ZScore'umuz ve ultra yüksek no
The Volumebyprice.com technical indicator for MetaTrader 5 features Volume Profile and Market Profile TPO (Time Price Opportunity). Volume and TPO histogram bar and line charts. Volume Footprint charts. TPO letter and block marker collapsed and split structure charts. Session filtering and grouping. Static, dynamic and flexible range segmentation and compositing methods with relative and absolute visualizations. Graphical layering, positioning and styling options to suit the user's analytic and
Wapv Price and volume
Eduardo Da Costa Custodio Santos
MT5 için WAPV Fiyat ve Hacim Göstergesi, (Wyckoff Academy Wave Market) ve (Wyckoff Academy Fiyat ve Hacim) araç setinin bir parçasıdır. MT5 için WAPV Fiyat ve Hacim Göstergesi, grafikteki hacim hareketini sezgisel bir şekilde görselleştirmeyi kolaylaştırmak için oluşturuldu. Bununla, piyasanın profesyonel bir ilgisinin olmadığı en yüksek hacim anlarını ve anları gözlemleyebilirsiniz. Piyasanın "akıllı para" hareketiyle değil, ataletle hareket ettiği anları belirleyin. Kullanıcı tarafından değişt
The "VSA on the FLY" indicator is designed to quickly display various Volume Profile / Market Profile parameters.. The indicator takes the initial data for operation from the M1 timeframe. The indicator is installed on any timeframe and starts displaying data starting from the selected left border. This can be the beginning of a day, a week, a trading session, any hour, etc. The version of this indicator for MetaTrader 4 can be found here . The following input parameters are available: Show
UPD1 Profile Levels MT5
Vitaliy Kuznetsov
5 (3)
Gösterge, belirtilen sayıda çubuk için çalışma histogramında maksimum ve minimum fiyat hacminin (piyasa profili) seviyelerini bulur.   Kompozit profil. Histogramın yüksekliği tamamen otomatiktir ve herhangi bir enstrümana ve zaman dilimine uyarlanabilir. Yazarın algoritması kullanılır ve bilinen analogları tekrarlamaz. İki histogramın yüksekliği yaklaşık olarak mumun ortalama yüksekliğine eşittir. Akıllı uyarı (akıllı uyarı), hacim seviyesine ilişkin fiyatı bildirmenize yardımcı olur. Konsept
Description The indicator uses market profile theory to show the most relevant trading zones, on a daily basis. The zones to be shown are LVN (low volume nodes) and POC (point of control). An LVN zone is one which represents price areas with the least time or volume throughout the day. Typically, these areas indicate a supply or demand initiative, and in the future, they can turn into important breakout or retracement zones. A POC zone is one which represents price areas with the most time or vo
This indicator is a conventional analytical tool for tick volumes changes. It calculates tick volumes for buys and sells separately, and their delta on every bar, and displays volumes by price clusters (cells) within a specified bar (usually the latest one). The algorithm used internally is the same as in the indicator VolumeDeltaMT5 , but results are shown as cumulative volume delta bars (candlesticks). Analogous indicator for MetaTrader 4 exists - CumulativeDeltaBars . This is a limited substi
Forex Volume MT5
KEENBASE SOFTWARE SOLUTIONS
KT Forex Volume shows the buying and selling volume of a currency pair in the form of a colored histogram. The volume is made of buying and selling transactions in an asset. In FX market: If the buying volume gets bigger than the selling volume, the price of a currency pair would go up. If the selling volume gets bigger than the buying volume, the price of a currency pair would go down. Features Avoid the bad trades by confirming them using the tick volume data. It helps you to stay on the si
The   Supply and Demand Zones indicator   is one of the best tools we have ever made. This great tool automatically draws supply and demand zones, the best places for opening and closing positions. It has many advanced features such as multi timeframe zones support, displaying the width of zones, alert notifications for retouched zones, and much more. Because of market fractality, this indicator can be used for any kind of trading. Whether you are a positional, swing, or intraday trader does no
The professional tool of stock traders in now available on MetaTrader 5 . The Actual depth of market chart indicator visualizes the depth of market in the form of a histogram displayed on a chart, which refreshes in the real-time mode. Meet new updates according to user requests! Now Actual Depth of Market indicator displays the current ratio of volume of buy and sell requests (B/S ratio). It shows the share of volume of each type of requests in the entire flow of requests as well as the absol
Blahtech Supply Demand MT5
Blahtech Limited
4.54 (13)
Was: $299  Now: $99   Supply Demand uses previous price action to identify potential imbalances between buyers and sellers. The key is to identify the better odds zones, not just the untouched ones. Blahtech Supply Demand indicator delivers functionality previously unavailable on any trading platform. This 4-in-1 indicator not only highlights the higher probability zones using a multi-criteria strength engine, but also combines it with multi-timeframe trend analysis, previously confirmed swings
VWAP Daily
Anton Polkovnikov
Weighted average price indicator or VWAP. The well-known standard VWAP with the beginning of the day is added with the function of selecting the periodization. It can be calculated both every day and on other periods. Also the indicator allows to exclude the volume from the calculation, which will allow using it on the cryptocurrencies and forex. There is an alert for a VWAP price crossing. There are 1 and 2 standard deviation. Settings: Volume: turning volume on and off in the calculation mecha
VPO Profile MT5
Kyra Nickaline Watson-gordon
5 (2)
Definition : VPO is a Volume Price Opportunity. Instead of using bars or candles with an Open, High, Low, and Close price, each "bar" in a Market Profile is represented by horizontal bars against the price It is called Market Profile terminology. In other words volume-price-opportunity (VPO) profiles are histograms of how many volumes were traded at each price within the span of the profile. By using a VPO chart, you are able to analyze the amount of trading activity, based on volume, for eac
Snipeer2
Ignacio Agustin Mene Franco
Sniper2 , It has points of lines, with colors that are showing you an entrance, that work as support and resistance! green dotted lines green shows entry for sale, the red dotted lines show a buy entry, pay attention to the supports that work as a break to catch long candles in a longer period of time. works for forex all pairs works for synthetic indices all pairs ! indicator on sale!
Bu göstergenin benzersizliği, hacim hesaplama algoritmasında yatmaktadır: birikim, günün başlangıcına bakılmaksızın doğrudan seçilen dönem için gerçekleşir. Son çubuklar hesaplamanın dışında tutulabilir, bu durumda mevcut veriler daha önce oluşturulan önemli seviyeler (hacimler) üzerinde daha az etkiye sahip olacaktır. Daha doğru bir hesaplama için varsayılan olarak M1 grafiğindeki veriler kullanılır. Fiyat hacimlerinin dağıtım adımı düzenlenir. Varsayılan olarak, ekranın sağ sınırı, analiz için
Gösterge, tarihsel olanlarla karşılaştırılabilecek güncel teklifler oluşturur ve bu temelde bir fiyat hareketi tahmini yapar. Gösterge, istenen tarihe hızlı navigasyon için bir metin alanına sahiptir. Seçenekler: Sembol - göstergenin göstereceği sembolün seçimi; SymbolPeriod - göstergenin veri alacağı dönemin seçimi; GöstergeRenk - gösterge rengi; Ters - doğru tırnakları tersine çevirir, yanlış - orijinal görünüm; Sonraki, tarihi girebileceğiniz ve 'enter' tuşuna basa
Welcome to the Ultimate Harmonic Patterns recognition indicator that is focused to detect advanced patterns. The Gartley pattern, Bat pattern, and Cypher pattern  are popular technical analysis tools used by traders to identify potential reversal points in the market. Our Ultimate Harmonic Patterns recognition Indicator is a powerful tool that uses advanced algorithms to scan the markets and identify these patterns in real-time. With our Ultimate Harmonic Patterns recognition Indicator, you
Grafikteki işlem seanslarını vurgular Trading_Sessions_Indicator_Free ürününün ücretli bir sürümü, oturumların başlangıcını /sonunu özel olarak özelleştirebilme özelliğine sahiptir. İşlem Seansları Göstergesi, her işlem seansının başlangıç ve bitişlerini vurgular. [SEÇENEK:] Asian session Open Asian session Close Asian session OpenSummertime Asian session CloseSummertime European session Open European session Close European session Open European session Close Timeshift En iyi sonuçlar i
The best time to trade Using this Indicator is when the time reach exactly hour,half,45 minutes,15 minutes and sometimes 5 minutes.. This indicators is helpful to those who trade boom and crash indecies.How to read this indicator first you'll see Blue allow and Red allow all these allows used to indicate or to detect the spike which will happen so the allow happens soon before the spike happen.This indicator works properly only in boom and crash trading thing which you have to consider when
Bu ürünün alıcıları ayrıca şunları da satın alıyor
Öncelikle belirtmek gerekir ki bu Ticaret Göstergesi Yeniden Çizim Yapmaz, Gecikmez ve Gecikme Göstermez, bu da hem manuel hem de robot ticareti için ideal hale getirir. Kullanıcı kılavuzu: ayarlar, girişler ve strateji. Atom Analisti, Piyasada Daha İyi Bir Avantaj Bulmak İçin Fiyatın Gücünü ve Momentumunu Kullanan PA Fiyat Hareketi Göstergesidir. Gürültüleri ve Yanlış Sinyalleri Kaldırmaya ve Ticaret Potansiyelini Artırmaya Yardımcı Olan Gelişmiş Filtrelerle Donatılmıştır. Birden fazla katmanl
Öncelikle, bu Ticaret Sistemi'nin Non-Repainting, Non-Redrawing ve Non-Lagging Göstergesi olduğunu vurgulamak önemlidir, bu da hem manuel hem de robot ticareti için ideal hale getirir. Online kurs, kılavuz ve ön ayarları indir. "Smart Trend Trading System MT5", yeni ve deneyimli tüccarlar için özelleştirilmiş kapsamlı bir ticaret çözümüdür. 10'dan fazla premium göstergeyi birleştiriyor ve 7'den fazla sağlam ticaret stratejisi sunuyor, bu da çeşitli piyasa koşulları için esnek bir seçim yapar. Tr
Quantum Trend Sniper
Bogdan Ion Puscasu
5 (46)
Tanıtım       Kuantum Trend Keskin Nişancı Göstergesi   , trend tersine dönmeleri belirleme ve ticaret yapma şeklinizi değiştiren çığır açan MQL5 Göstergesi! 13 yılı aşkın ticaret tecrübesine sahip deneyimli tüccarlardan oluşan bir ekip tarafından geliştirilmiştir.       Kuantum Trend Keskin Nişancı Göstergesi       trend dönüşlerini son derece yüksek doğrulukla belirlemenin yenilikçi yolu ile ticaret yolculuğunuzu yeni zirvelere taşımak için tasarlanmıştır. ***Kuantum Trend Keskin Nişancı Gö
Gold Stuff mt5
Vasiliy Strukov
4.9 (181)
Gold Stuff mt5, özellikle altın için tasarlanmış bir trend göstergesidir ve herhangi bir finansal enstrümanda da kullanılabilir. Gösterge yeniden çizilmez ve gecikmez. Önerilen zaman dilimi H1. Ayarları ve kişisel bir bonusu almak için satın alma işleminden hemen sonra benimle iletişime geçin!  Güçlü Destek ve Trend Tarayıcı göstergemizin ücretsiz bir kopyasını pm'den alabilirsiniz. Ben!   AYARLAR Ok Çiz - açık kapalı. grafik üzerinde oklar çizmek. Uyarılar - sesli uyarılar kapalı. E-post
AT Forex Indicator MT5
Marzena Maria Szmit
5 (3)
The AT Forex Indicator MT5 is a sophisticated trading tool designed to provide traders with a comprehensive analysis of multiple currency pairs. This powerful indicator simplifies the complex nature of the forex market, making it accessible for both novice and experienced traders. AT Forex Indicator uses advanced algorithms to detect trends, patterns and is an essential tool for traders aiming to enhance their forex trading performance. With its robust features, ease of use, and reliable signal
Top indicator for MT5   providing accurate signals to enter a trade without repainting! It can be applied to any financial assets:   forex, cryptocurrencies, metals, stocks, indices .  Watch  the video  (6:22) with an example of processing only one signal that paid off the indicator! MT4 version is here It will provide pretty accurate trading signals and tell you when it's best to open a trade and close it. Most traders improve their trading results during the first trading week with the help of
Reversal First Impulse levels (RFI)      INSTRUCTIONS        RUS       -       ENG              R ecommended to use with an indicator   -   TPSpro  TREND PRO -  Version MT4                 A key element in trading is zones or levels from which decisions to buy or sell a trading instrument are made. Despite attempts by major players to conceal their presence in the market, they inevitably leave traces. Our task was to learn how to identify these traces and interpret them correctly. Main functi
Öncelikle, bu Ticaret Aracının Non-Repainting, Non-Redrawing ve Non-Lagging Gösterge olduğunu vurgulamakta fayda var, bu da onu profesyonel ticaret için ideal hale getiriyor. Çevrimiçi kurs, kullanıcı kılavuzu ve demo. Akıllı Fiyat Hareketi Kavramları Göstergesi, hem yeni hem de deneyimli tüccarlar için çok güçlü bir araçtır. İleri ticaret fikirlerini, Inner Circle Trader Analizi ve Smart Money Concepts Ticaret Stratejileri gibi 20'den fazla kullanışlı göstergeyi bir araya getirerek bir aray
Trend Screener Pro MT5
STE S.S.COMPANY
4.88 (66)
Trend Göstergesi, Trend Alım Satım ve Filtreleme için Çığır Açan Benzersiz Çözüm, Tüm Önemli Trend Özellikleriyle Tek Bir Araç İçinde Yerleştirildi! Forex, emtialar, kripto para birimleri, endeksler ve hisse senetleri gibi tüm sembollerde/araçlarda kullanılabilen %100 yeniden boyamayan çoklu zaman çerçevesi ve Çoklu para birimi göstergesidir. Trend Screener, grafikte noktalarla ok trend sinyalleri sağlayan etkili bir trend trend göstergesidir. Trend analizörü göstergesinde bulunan özellikler: 1.
TPA True Price Action indicator reveals the true price action of the market makers through 100% non-repainting signals strictly at the close of a candle! TPA shows entries and re-entries, every time the bulls are definitely stronger than the bears and vice versa. Not to confuse with red/green candles. The shift of power gets confirmed at the earliest stage and is ONE exit strategy of several. There are available now two free parts of the TPA User Guide for our customers. The first "The Basics"
FX Power MT5 NG
Daniel Stein
5 (5)
Sabah Brifingimiz burada mql5 ve on Telegram! FX Power MT5 NG , uzun zamandır çok popüler olan döviz gücü ölçerimiz FX Power'ın yeni neslidir. Peki bu yeni nesil güç ölçer ne sunuyor? Orijinal FX Power hakkında sevdiğiniz her şey PLUS GOLD/XAU güç analizi Daha da hassas hesaplama sonuçları Ayrı ayrı yapılandırılabilir analiz dönemleri Daha da iyi performans için özelleştirilebilir hesaplama limiti Özel çokluDaha fazlasını görmek isteyenler için örnek ayarlar Her grafikte en sevdiğiniz renkler i
TPSproTREND PrO MT5
Roman Podpora
4.88 (8)
TPSpro TRENDPRO  - is a trend indicator that automatically analyzes the market and provides information about the trend and each of its changes, as well as giving signals for entering trades without redrawing! The indicator uses each candle, analyzing them separately. referring to different impulses - up or down impulse. Exact entry points into transactions for currencies, crypto, metals, stocks, indices!  -  Version MT4               DETAILED DESCRIPTION               R ecommended to use with
ICT, SMC, SMART MONEY CONCEPTS, SMART MONEY, Smart Money Concept, Support and Resistance, Trend Analysis, Price Action, Market Structure, Order Blocks, BOS/CHoCH,   Breaker Blocks ,  Momentum Shift,   Supply&Demand Zone/Order Blocks , Strong Imbalance,   HH/LL/HL/LH,    Fair Value Gap, FVG,  Premium  &   Discount   Zones, Fibonacci Retracement, OTE, Buy Side Liquidity, Sell Side Liquidity, BSL/SSL Taken, Equal Highs & Lows, MTF Dashboard, Multiple Time Frame, BigBar, HTF OB, HTF Market Structure
FX Volume MT5
Daniel Stein
4.94 (17)
Sabah Brifingimiz aracılığıyla ayrıntılar ve ekran görüntüleri ile günlük piyasa güncellemenizi alın burada mql5 ve on Telegram ! FX Volume, bir brokerin bakış açısından piyasa duyarlılığı hakkında GERÇEK bir fikir veren İLK ve TEK hacim göstergesidir. COT raporlarından çok daha hızlı bir şekilde, brokerlar gibi kurumsal piyasa katılımcılarının Forex piyasasında nasıl konumlandıklarına dair harika bilgiler sağlar. Bu bilgileri doğrudan grafiğinizde görmek, ticaretiniz için gerçek oyun değiştir
Fiyat tersine döndükçe ve geri çekildikçe piyasa yapısından elde edilen kâr değişir. Piyasa yapısını tersine çevirme uyarısı göstergesi, bir trendin veya fiyat hareketinin ne zaman tükenmeye yaklaştığını ve tersine dönmeye hazır olduğunu tanımlar. Genellikle bir geri dönüş veya büyük bir geri çekilme meydana gelmek üzereyken meydana gelen piyasa yapısındaki değişiklikler konusunda sizi uyarır. Gösterge, olası bir tükenme noktasının yakınında her yeni yüksek veya düşük oluştuğunda, başlangıçta
Matrix Arrow Indicator MT5
Juvenille Emperor Limited
5 (14)
Matrix Arrow Indicator MT5 ,   forex ,   emtialar ,   kripto   para birimleri ,   endeksler ,   hisse senetleri   gibi tüm sembollerde/araçlarda kullanılabilen   %100 yeniden boyamayan   çoklu zaman çerçevesi göstergesini izleyen benzersiz bir 10'u 1 arada trenddir.  Matrix Arrow Indicator MT5 , mevcut eğilimi erken aşamalarında belirleyecek ve aşağıdakiler gibi 10'a kadar standart göstergeden bilgi ve veri toplayacaktır: Ortalama Yönlü Hareket Endeksi (ADX) Emtia Kanal Endeksi (CCI) Klasik Hei
XQ Indicator MetaTrader 5
Marzena Maria Szmit
5 (1)
Step into the realm of Forex trading with confidence and precision using XQ, a cutting-edge Forex indicator designed to elevate your trading game to unprecedented heights. Whether you're a seasoned trader or just stepping into the world of currency exchange, XQ Forex Indicator empowers you with the insights and signals needed to make informed trading decisions. The signal conditions are a combination of three indicators, and XQ Forex Indicator only display  medium and long-term trends . The ind
RelicusRoad Pro MT5
Relicus LLC
4.83 (23)
Şimdi 147 $ (birkaç güncellemeden sonra 499 $ 'a yükseliyor) - Sınırsız Hesaplar (PC'ler veya Mac'ler) RelicusRoad Kullanım Kılavuzu + Eğitim Videoları + Özel Discord Grubuna Erişim + VIP Durumu PİYASAYA BAKMAK İÇİN YENİ BİR YOL RelicusRoad, forex, vadeli işlemler, kripto para birimleri, hisse senetleri ve endeksler için dünyanın en güçlü ticaret göstergesidir ve yatırımcılara kârlı kalmaları için ihtiyaç duydukları tüm bilgileri ve araçları sağlar. Başlangıç ​​seviyesinden ileri seviyey
Auto Order Block with break of structure based on ICT and Smart Money Concepts (SMC) Futures Break of Structure ( BoS )             Order block ( OB )            Higher time frame Order block / Point of Interest ( POI )    shown on current chart           Fair value Gap ( FVG ) / Imbalance   -  MTF      ( Multi Time Frame )    HH/LL/HL/LH  -  MTF      ( Multi Time Frame )  Choch  MTF      ( Multi Time Frame )  Volume Imbalance     ,  MTF          vIMB Gap’s Power of 3 Equal High
Advanced Supply Demand MT5
Bernhard Schweigert
4.53 (15)
Herhangi bir Acemi veya Uzman Tüccar için En İyi Çözüm! Bu gösterge benzersiz, yüksek kaliteli ve uygun fiyatlı bir ticaret aracıdır çünkü bir dizi tescilli özelliği ve yeni bir formülü bir araya getirdik. Bu güncelleme ile çift zaman dilimi dilimlerini gösterebileceksiniz. Yalnızca daha yüksek bir TF gösteremeyeceksiniz, aynı zamanda TF grafiğini ve ARTIK daha yüksek TF'yi de gösterebileceksiniz: YUVARLAK BÖLGELERİ GÖSTERMEK. Tüm Arz Talebi tüccarları buna bayılacak. :) Önemli Bilgiler Açıkland
Bill Williams Advanced
Siarhei Vashchylka
5 (7)
Bill Williams Advanced is designed for automatic chart analysis using Bill Williams' "Profitunity" system. The indicator analyzes four timeframes at once. Manual (Be sure to read before purchasing) Advantages 1. Automatically analyzes the chart using the "Profitunity" system of Bill Williams. The found signals are placed in a table in the corner of the screen. 2. Equipped with a trend filter based on the Alligator indicator. Most of the system signals are recommended to be used only accordi
Dark Absolute Trend   is an Indicator for intraday trading. This Indicator is based on   Trend Following  strategy but use also candlestick patterns and Volatility. We can enter in good price with this Indicator, in order to follow the main trend on the current instrument. It is advised to use low spread ECN brokers. This Indicator does   Not repaint   and   N ot lag . Recommended timeframes are M5, M15 and H1. Recommended working pairs: All. I nstallation and  Update Guide   -  Troubleshooting
Bu gösterge paneli, seçilen semboller için mevcut en son   harmonik kalıpları   gösterir, böylece zamandan tasarruf edersiniz ve daha verimli olursunuz /   MT4 sürümü . Ücretsiz Gösterge:   Basic Harmonic Pattern Gösterge sütunları Symbol :   seçilen semboller görünecektir Trend:   yükseliş veya düşüş Pattern :   desen türü (gartley, kelebek, yarasa, yengeç, köpekbalığı, cypher veya ABCD) Entry :   giriş fiyatı SL:   zararı durdur fiyatı TP1:   1. kar alma fiyatı TP2:   2. kar alma fiyatı
Easy By Sell is a market indicator for opening and closing positions. It becomes easy to track market entries with alerts. It indicates trend reversal points when a price reaches extreme values ​​and the most favorable time to enter the market. it is as effective as a Fibonacci to find a level but it uses different tools such as an algorithm based on ATR indicators and Stochastic Oscillator. You can modify these two parameters as you wish to adapt the settings to the desired period. My othe
IX Power MT5
Daniel Stein
5 (3)
IX Power   nihayet FX Power'ın rakipsiz hassasiyetini Forex dışı sembollere getiriyor. En sevdiğiniz endeksler, hisse senetleri, emtialar, ETF'ler ve hatta kripto para birimlerindeki kısa, orta ve uzun vadeli eğilimlerin yoğunluğunu doğru bir şekilde belirler. Terminalinizin sunduğu   her şeyi analiz   edebilirsiniz. Deneyin ve işlem yaparken   zamanlamanızın   nasıl   önemli ölçüde iyileştiğini   deneyimleyin. IX Power Temel Özellikler 100 hassas, yeniden boyanmayan hesaplama sonuçları -
Tanıtım       Quantum Breakout PRO   , Breakout Bölgeleri ile ticaret yapma şeklinizi değiştiren çığır açan MQL5 Göstergesi! 13 yılı aşkın ticaret tecrübesine sahip deneyimli tüccarlardan oluşan bir ekip tarafından geliştirilmiştir.       Kuantum Breakout PRO       yenilikçi ve dinamik koparma bölgesi stratejisiyle ticaret yolculuğunuzu yeni zirvelere taşımak için tasarlanmıştır. Kuantum Breakout Göstergesi, size 5 kar hedefi bölgesi ile kırılma bölgelerinde sinyal okları ve kırılma kutusuna
AW Trend Predictor MT5
AW Trading Software Limited
4.78 (58)
Tek bir sistemde trend ve kırılma seviyelerinin kombinasyonu. Gelişmiş bir gösterge algoritması piyasa gürültüsünü filtreler, trendi, giriş noktalarını ve olası çıkış seviyelerini belirler. Gösterge sinyalleri, sinyal geçmişinin etkinliğini gösteren en uygun enstrümanların seçilmesine izin veren bir istatistiksel modüle kaydedilir. Gösterge Kâr Al ve Zararı Durdur işaretlerini hesaplar. Kılavuz ve talimatlar ->   BURAYA   / MT4 versiyonu ->   BURAYA Gösterge ile nasıl ticaret yapılır: Trend Pre
Gartley Hunter Multi
Siarhei Vashchylka
5 (7)
Gartley Hunter Multi - An indicator for searching for harmonic patterns simultaneously on dozens of trading instruments and on all possible timeframes. Manual (Be sure to read before purchasing) | Version for MT4 Advantages 1. Patterns: Gartley, Butterfly, Shark, Crab. Bat, Alternate Bat, Deep Crab, Cypher 2. Simultaneous search for patterns on dozens of trading instruments and on all possible timeframes 3. Search for patterns of all possible sizes. From the smallest to the largest 4. A
Legacy of Gann for MT5
Pavel Zamoshnikov
5 (6)
The indicator very accurately determines the levels of the possible end of the trend and profit fixing. The method of determining levels is based on the ideas of W.D.Gann, using an algorithm developed by his follower Kirill Borovsky. Extremely high reliability of reaching levels (according to K. Borovsky  - 80-90%) Indispensable for any trading strategy – every trader needs to determine the exit point from the market! Precisely determines targets on any timeframes and any instruments (forex, met
Owl Smart Levels MT5
Sergey Ermolov
4.39 (38)
MT4 versiyonu  |  FAQ Owl Smart Levels Indicator , Bill Williams'ın gelişmiş fraktalları , piyasanın doğru dalga yapısını oluşturan Valable ZigZag ve kesin giriş seviyelerini gösteren Fibonacci seviyeleri gibi popüler piyasa analiz araçlarını içeren tek gösterge içinde eksiksiz bir ticaret sistemidir. pazara ve kar elde edilecek yerlere. Stratejinin ayrıntılı açıklaması Gösterge ile çalışma talimatı Baykuş Yardımcısı ticaretinde Danışman Yardımcısı Kullanıcıların özel sohbeti -> Satın aldıktan
Yazarın diğer ürünleri
Volatility Vision
Pavel Bereznichenko
Volatility Vision: Essential for Forex and Stock Markets Volatility Vision'ı Keşfedin: Ticaret Devriminiz Hem Yeni Başlayanlar Hem de Uzman Traderlar İçin Mükemmel Kolay Başlangıç Rehberi: Etkin bir şekilde nasıl kullanacağınızı öğrenin Kullanıcı Kılavuzu ile. Volatility Vision indikatörü, grafiklerinizde kesin volatilite seviyelerini haritalayan güçlü bir araçtır. Bu çok yönlü araç, ticaret stratejinize entegre etmek için gereklidir ve tüm döviz çiftleri ve hisse senedi piyasaları ile uyumlu
Simple ATR
Pavel Bereznichenko
Gösterge  Simple ATR   Piyasa volatilitesini daha net bir şekilde izlemek için basitleştirilmiş bir araç, hem günlük ticaret hem de salınım ticareti için idealdir. İşlem yapmaya başlamak veya yeni başlayanlar için en iyi göstergedir. Görsel Gösterge Rengi: ATR Daily - Mavi Görsel Gösterge Rengi: ATR Weekly - Kırmızı Görsel Gösterge Rengi: ATR Monthly - Sarı Analizi geliştirmek için Volatility Vision göstergesi ile birleştirin. Piyasa koşullarındaki dalgalanmaları kesin olarak ölçer, günlük t
Volatility Vision: Essential for Forex and Stock Markets Volatility Vision'ı Keşfedin: Ticaret Devriminiz Hem Yeni Başlayanlar Hem de Uzman Traderlar İçin Mükemmel Kolay Başlangıç Rehberi: Etkin bir şekilde nasıl kullanacağınızı öğrenin Kullanıcı Kılavuzu ile. Volatility Vision indikatörü, grafiklerinizde kesin volatilite seviyelerini haritalayan güçlü bir araçtır. Bu çok yönlü araç, ticaret stratejinize entegre etmek için gereklidir ve tüm döviz çiftleri ve hisse senedi piyasaları ile uyumlu
Filtrele:
İnceleme yok
İncelemeye yanıt
Sürüm 1.2 2023.08.26
In the 1.2 version of the MQL5 indicator, the following changes were made to enhance its functionality and usability:

Removal of "shift" Argument: The "shift" argument was removed from the indicator, simplifying its usage and reducing potential confusion for users.

Addition of Two Expert-Related Arguments: Two new arguments were introduced to facilitate the use of the indicator in conjunction with an expert advisor (EA). These additional arguments likely help the EA to interact more effectively with the indicator's signals.