UR Momenter
- Göstergeler
- Krzysztof Jan Debski
- Sürüm: 1.10
- Güncellendi: 16 Mayıs 2024
- Etkinleştirmeler: 7
UR Momenteri
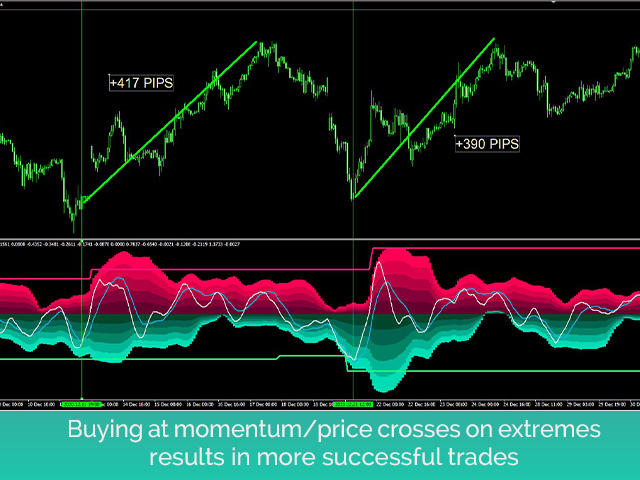
UR Momenter, bir osilatör olarak temsil edilen fiyat hareketinin tükenmesiyle ilişkili olarak fiyatın momentumunu mükemmel bir şekilde hesaplar. Bu nedenle, bu bize potansiyel geri dönüşlerin veya geri çekilmelerin gerçekten erken sinyallerini verir. Bu formül, 2018'de pazar balonu patladıktan sonra keşfedildi.
UR Momenter kullanmanın avantajları:
parametre yok
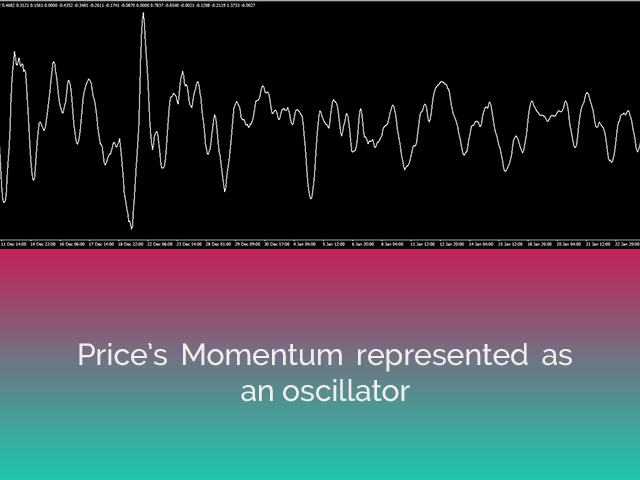
Fiyat hareketini tanımlayan 2 çizginiz var - Fiyatın hareketli ortalama sapmasına bağlı olarak fiyatın Momentumu olan Beyaz Çizgi, bir osilatör olarak temsil edilir (mavi çizgi)
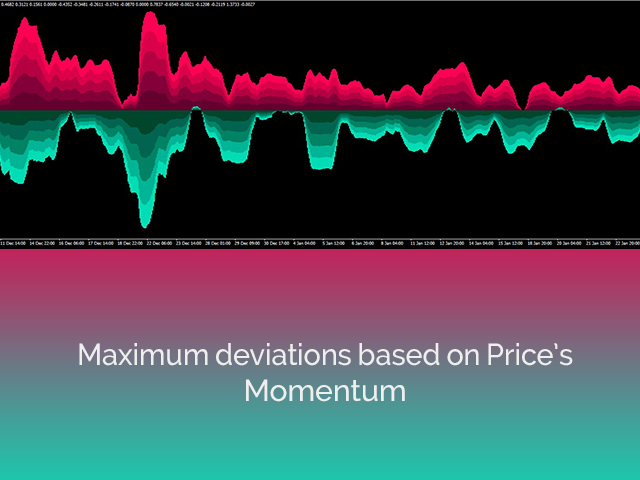
Histogram, fiyatın momentumu bağlamında maksimum sapmaların görselleştirilmesidir
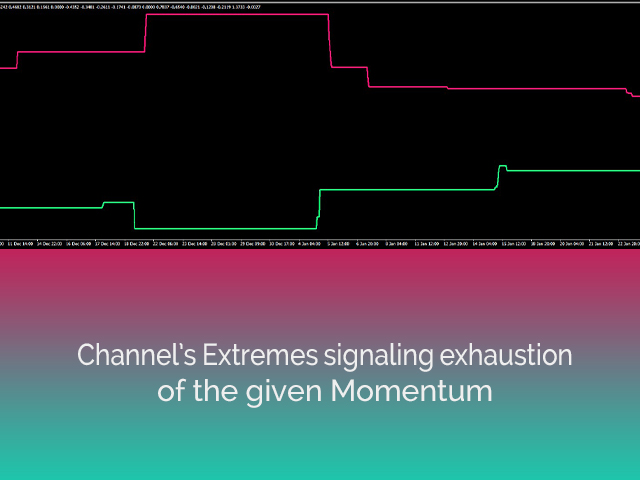
Arayüz, her iki uçta da (üst kırmızı ve alt yeşil alanlar) herhangi bir satırın tükenmesini gösterir.
En iyi avantaj: Kolay ve tüm varlıklara uyarlanmış.
Araç güncellemelerinden haberdar olabileceğiniz ve eksik bir şey olduğunu düşünüyorsanız istek gönderebileceğiniz özel bir telgraf sohbeti var!
Neden UR Momenter?
Bu gösterge bağımsız, giriş veya çıkış göstergesi olarak kullanılabilir. Fiyata bağlı olması nedeniyle - her grafiğe uygulanabilir ve sapma hesaplama algoritması birkaç yıllık deneyime ve gözleme dayanır.
UR Momenter nasıl kullanılır?
Daha aşina olmak için aşağıdaki açıklamaya bakın:
AYARLAR
Hiçbiri
GÖRÜNTÜLEMEK
Fiyat Ortalama Ana Çizgi (beyaz): Fiyatın momentumu
Fiyat Osilatörü (mavi): Fiyatın hareketli ortalamaya göre sapması.
Histogram: Momentumun sapmasını gösterir.
Ekstrem Alanlar: Fiyatın tükeneceği ve potansiyel olarak tersine döneceği alanlar.
EK
Tüm aletlerim monte edildiğinde en iyi şekilde çalışıyor. Yani, UR DivergenceSpotter, UR VolumeTrend, UR Highs&Lows veya/veya UR TrendExhaustion ile kullanıldığında giriş noktalarının doğruluğu çok daha iyidir.