Best trend indicator
- Göstergeler
- Xiao Dong Feng
- Sürüm: 1.10
- Güncellendi: 4 Ağustos 2022
- Etkinleştirmeler: 10
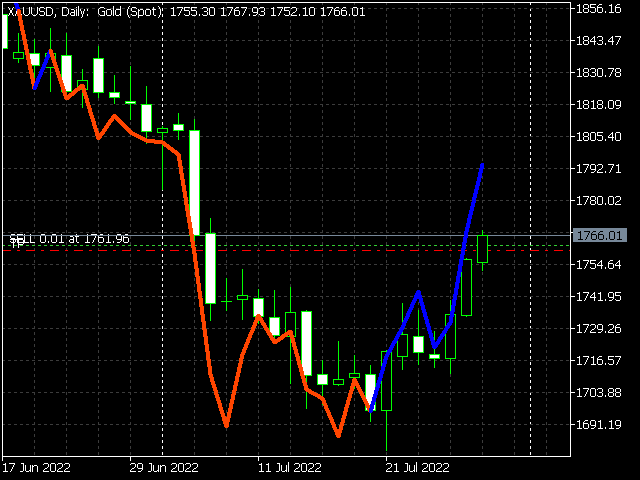
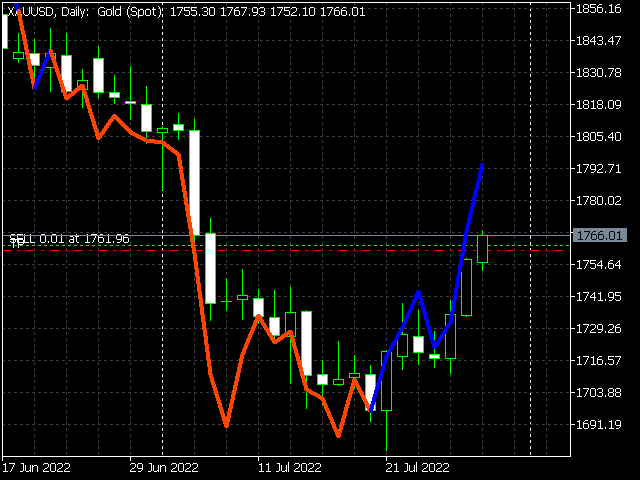
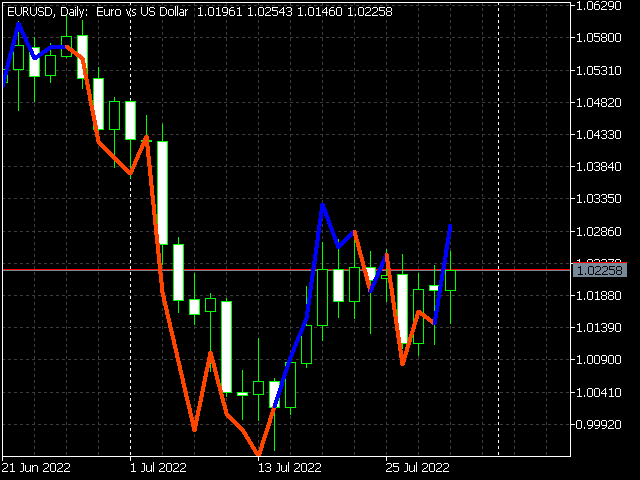
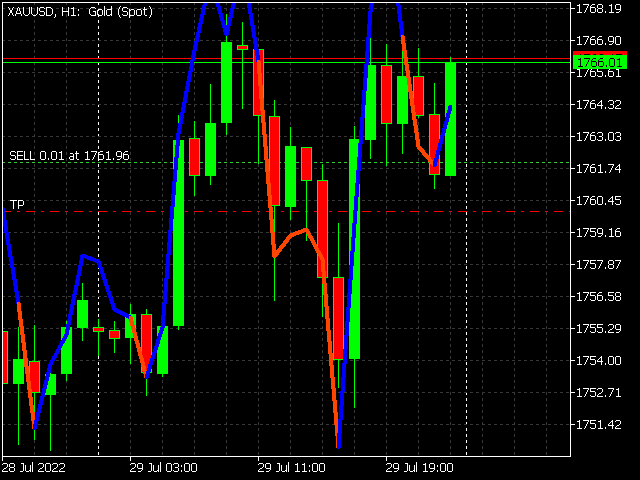
https://c.mql5.com/31/761/best-trend-indicator-logo-200x200-8493.pngThe indicator uses a solid line of red and green to reflect the myriad changes in market prices.
The green line indicates a period of rising market prices and the red line indicates a period of falling market prices.
Solid line color change indicates that the market has changed and the market is likely to reverse!
It is recommended that you use this indicator on your daily K-chart. This indicator is not suitable for you to do super - short - term trading!
A trend line, as it is known, is A line used by technical analysts to plot the past price movements of a security or commodity futures. The purpose is to predict future price changes. This trend line is formed by linking the highest or lowest price points for a security or commodity futures to rise or fall in a particular period. It can predict whether the security or commodity futures are in an upward or downward trend. However, you must realize that every indicator has its flaws. There is no indicator in the world that can accurately predict the future development direction of the market. Therefore, I recommend that you use this metric in combination with other technical sub-indicators for better results.

