UR HighsAndLows MT5
- Göstergeler
- Krzysztof Jan Debski
- Sürüm: 1.10
- Güncellendi: 16 Mayıs 2024
- Etkinleştirmeler: 5
UR Yüksekler ve Düşükler
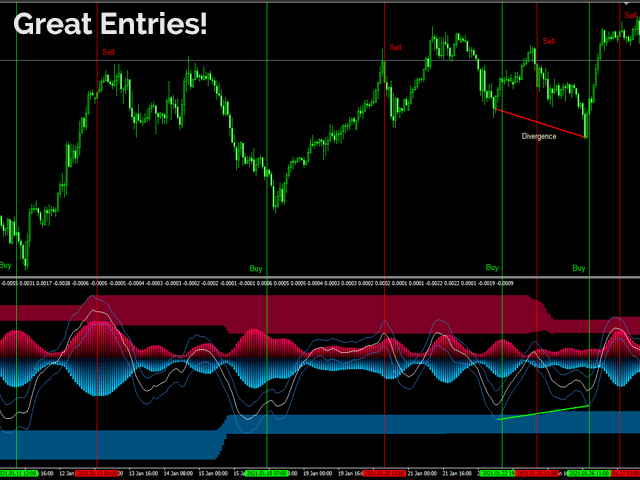
UR Highs&Lows, fiyat hareketinin ve oynaklığının derinlemesine bir analizini yapar ve fiyatın içinde hareket ettiği bir kanal oluşturur. Bu kanal artık bir osilatör olarak hareket ediyor ve potansiyel tükenmeleri ve olası tersine dönüşleri işaret etmek için fiyat sapması ile kaplanıyor.
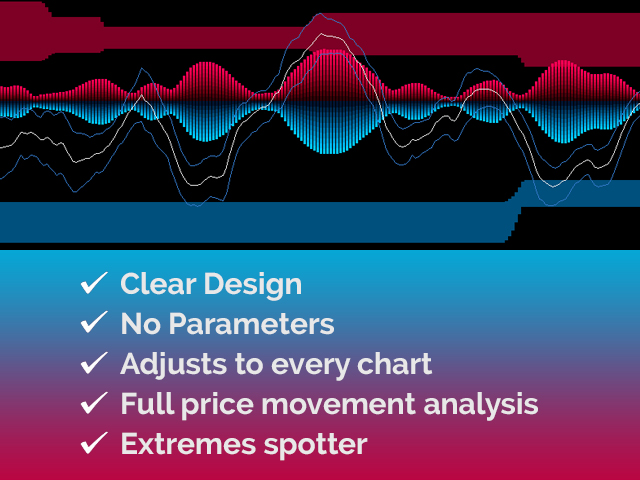
UR Yüksekler ve Düşükler kullanmanın avantajları:
parametre yok
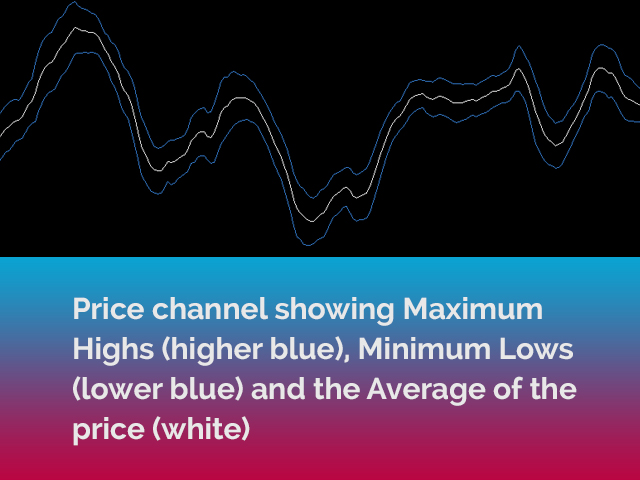
Fiyat hareketini tanımlayan 3 çizginiz var - fiyatın ortalaması olan Beyaz Çizgi ve uç noktaları olan Mavi Çizgiler
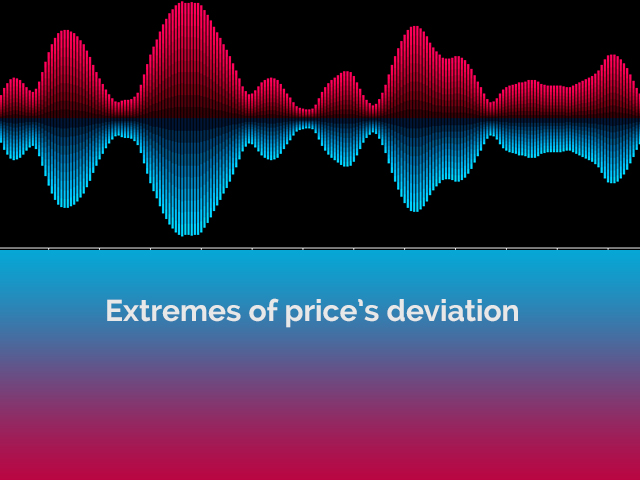
Histogram, fiyat bağlamında maksimum sapmaların görselleştirilmesidir
Arayüz, her iki uçta da (üst kırmızı ve alt mavi alanlar) herhangi bir satırın tükenmesini gösterir.
En iyi avantaj: Kolay ve tüm varlıklara uyarlanmış.
Araç güncellemelerinden haberdar olabileceğiniz ve eksik bir şey olduğunu düşünüyorsanız istek gönderebileceğiniz özel bir telgraf sohbeti var!
Neden UR Yüksekler ve Düşükler?
Bu gösterge bağımsız, giriş veya çıkış göstergesi olarak kullanılabilir. Fiyata bağlı olması nedeniyle - her grafiğe uygulanabilir ve sapma hesaplama algoritması birkaç yıllık deneyime ve gözleme dayanır.
UR Yüksekler ve Düşükler nasıl kullanılır?
Daha aşina olmak için aşağıdaki açıklamaya bakın:
AYARLAR
Hiçbiri
GÖRÜNTÜLEMEK
Fiyat Ortalaması Ana Satır (beyaz): Fiyatın ortalamasıdır.
Fiyat Uç Noktaları (mavi): Fiyat uç noktalarının hesaplanmış bir kanalı.
Histogram: Oynaklığın sapmasını gösterir.
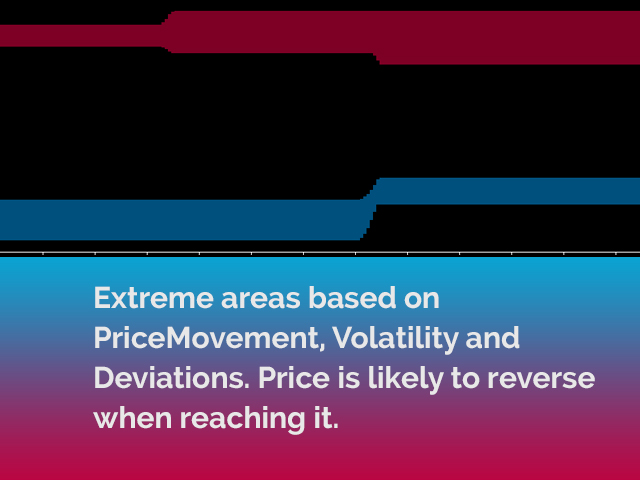
Ekstrem Alanlar: Fiyatın tükeneceği ve potansiyel olarak tersine döneceği alanlar.
EK
Tüm aletlerim monte edildiğinde en iyi şekilde çalışıyor. Yani giriş noktalarının doğruluğu, UR DivergenceSpotter, UR VolumeTrend veya/veya UR TrendExhaustion ile kullanıldığında çok daha iyidir.