UR VolumeTrend MT5
- Göstergeler
- Krzysztof Jan Debski
- Sürüm: 3.10
- Güncellendi: 16 Mayıs 2024
- Etkinleştirmeler: 5
UR Hacim Eğilimi
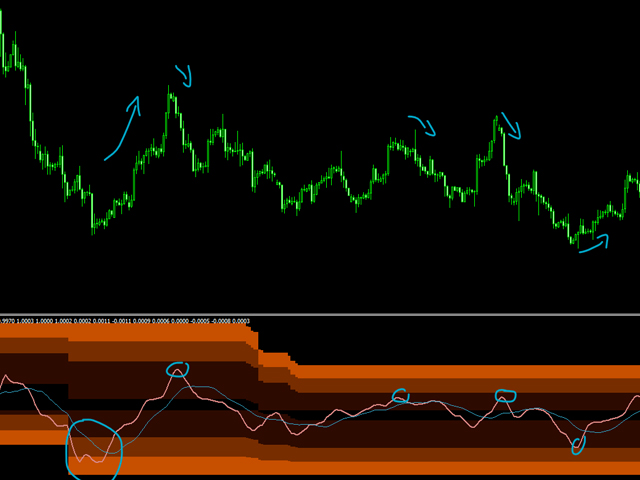
UR VolumeTrend, hacim olarak devam eden trendi gösteren en net hacim göstergesidir. Yerel zirveleri ve dipleri işaret etmek için UR TrendExhaustion gibi diğer göstergelerle mükemmel şekilde çalışır.
Yalnızca 2 parametreyle sınırlıdır - değerler ne kadar yüksek olursa, o kadar uzun trendler gösterir.
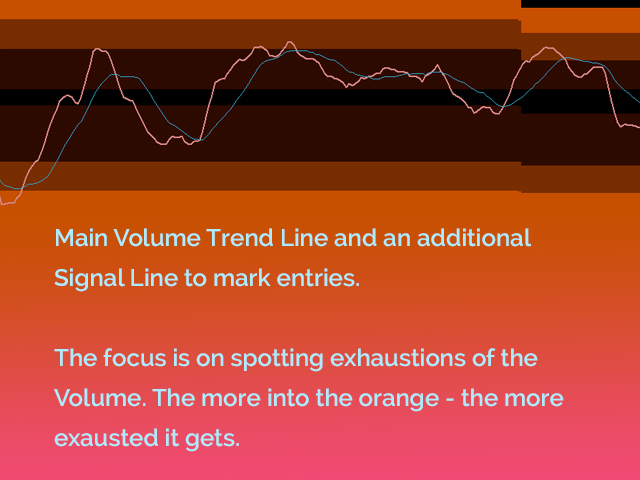
Aşırı gradyanlar, potansiyel bir tersine dönüşü yakalamak için hacmin olası tükenmelerini gösterir.
İki satır - Hacim eğilimi ve Ortalama.
En iyi avantaj: Kolay ve tüm varlıklara uyarlanmış.
Araç güncellemelerinden haberdar olabileceğiniz ve eksik bir şey olduğunu düşünüyorsanız istek gönderebileceğiniz özel bir telgraf sohbeti var!
Neden UR VolumeTrend?
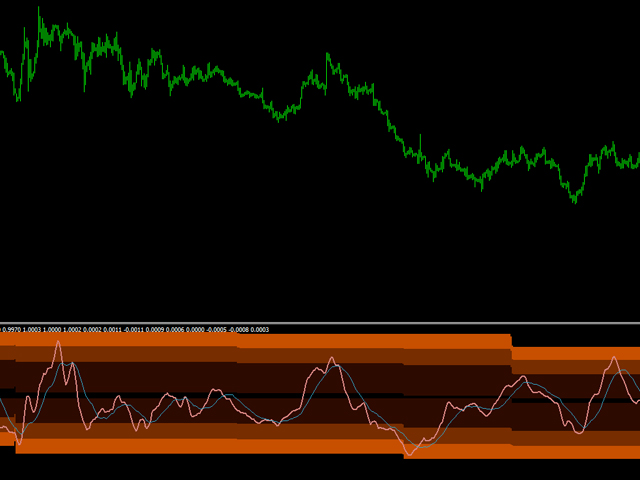
Herkes aynı fikirde olacaktır. Trendleri yakalamanın anahtarı Hacimdir. Bu Osilatör, kullanımı kolay tek bir göstergeye sıkıştırılmış tüm hacim araçlarımın toplamıdır. Pozitif/Negatif hacmi görülmesi kolay bir şekilde gösterir. Arkasındaki Arayüz, hacmin geçmişe kıyasla tükenip tükenmediğini veya yeni seviyelere çıkıp çıkmayacağını gösterir.
UR VolumeTrend nasıl kullanılır?
Daha aşina olmak için aşağıdaki açıklamaya bakın:
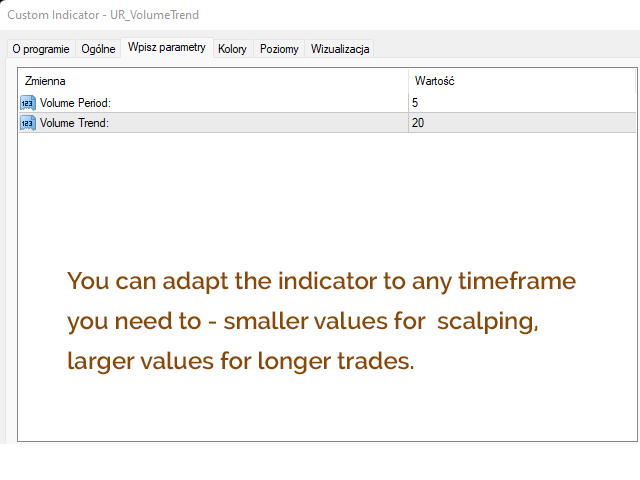
AYARLAR
Hacim Dönemi: Değer ne kadar yüksek olursa, yakalamaya çalışacağı daha büyük trendler
Hacim Eğilimi: Bu ek satır, yalnızca hacme dayalı potansiyel geri dönüş girişlerini gösterir.
GÖRÜNTÜLEMEK
Gradyan arabirimi: Geçmişe dayalı olarak seviye uçlarını gösterir.
Hacim Ana Hattı: Hacmin *0'ın üzerinde* yükseldiğini veya *0'ın altında* düştüğünü ve hacmin ne kadar güçlendiğini gösterir. 0 civarında gezinmek, pazarın hacminin olmadığı anlamına gelir.
Hacim Eğilim Çizgisi: Potansiyel girişlerin ve tersine dönüşlerin daha net bir resmini elde etmek için Hacmin Ortalamasını gösterir.
EK
Tüm aletlerim monte edildiğinde en iyi şekilde çalışıyor. Yani, UR TrendExhaustion, UR DivergenceSpotter veya/veya UR HighsAndLows ile kullanıldığında giriş noktalarının doğruluğu çok daha iyidir.
o