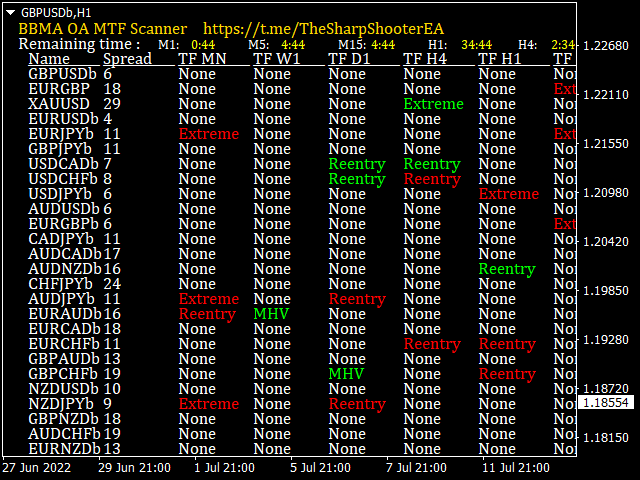
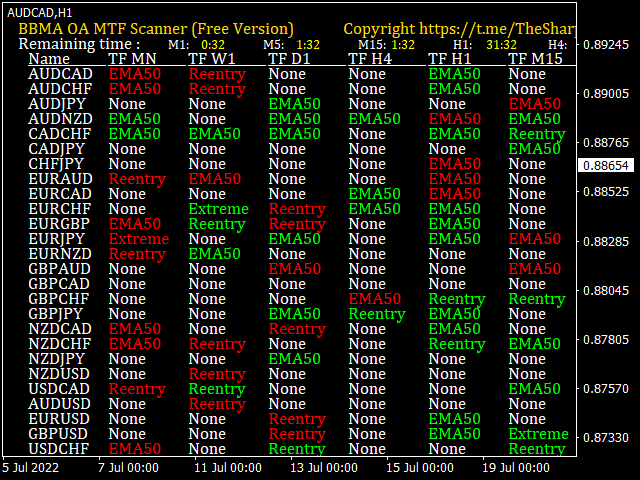
Bbma mtf Scanner Dashboard
- Göstergeler
- Moch Ramdhan
- Sürüm: 2.80
- Güncellendi: 15 Mart 2023
This is a Multi pair and Multi time frame dashboard. The founder of the system is Mr. Oma Ally, which is a system based from Bollinger Band and Moving Average(BBMA).
BBMA consists of the use of 2 indicators:
- Moving Averages
- Bollinger Bands
BBMA consists of 3 types of entries:
- Extreme
- MHV
- Re-Entry
- Rejection EMA50
This Dashboard Help you to scan current Extreme, Reentry setup, Rejection EMA50 and also MHV
How to read signals:
find the same color in 3 different timeframes in succession
For example:
1. The first timeframe must be reentry
2. The second timeframe must be reentry, extreme or rejected EMA50
3. The third timeframe must be extreme or MHV
The features of BBMA Dashboard :
- Scan latest CSAK(CSD) and CSM - When CSAK (CSD) or CSM is detected, it will scan reentry
- This indi will scan automatically the suffix or prefix pairs based on market watch list
- Update interval (scanning interval - in seconds)
- Show timeframe as you wish
- Extreme and Reentry Signal
- RE-ENTRY: is formed after the Rise/Fall of a price or market and the price
- market is now forming a sideways market for a Re-entry.
- Downtrend – MA5/10 High acts as resistance. Re-enter sell position when the market finds MA5/10 High. CS are under the MA5/10 High
- Uptrend– MA5/10 LOW acts as support. Re-enter buy position when the market finds MA5/10 Low. CS are above the MA5/10 Low
- Extreme - WMA5 out side of upper/lower the Bollinger Band
- MHV - Market failed to continue and couldn't break latest CSE


sangat sangat membantu kang