Volatility Vision modern
- Göstergeler
- Pavel Bereznichenko
- Sürüm: 1.2
- Etkinleştirmeler: 10
Volatility Vision'ı Keşfedin: Ticaret Devriminiz
Hem Yeni Başlayanlar Hem de Uzman Traderlar İçin Mükemmel
Volatility Vision indikatörü, grafiklerinizde kesin volatilite seviyelerini haritalayan güçlü bir araçtır. Bu çok yönlü araç, ticaret stratejinize entegre etmek için gereklidir ve tüm döviz çiftleri ve hisse senedi piyasaları ile uyumludur.
Volatilite eşiklerini kullanarak haftalık işlemlerinizi güvenle yönetin.
Volatility Vision'ın Avantajları
- Artırılmış Doğruluk: Stokastik Osilatörlerle yaygın olan yanlış pozitifleri önemli ölçüde azaltır.
- Erken Sinyaller: RSI'dan daha önce ticaret sinyallerini yakalar ve kaçırılan fırsatları değerlendirmenize yardımcı olur.
- Piyasa Lideri: MACD tepki vermeden önce proaktif içgörüler sunar.
- Güvenilirlik: CCI'nın yaygın yanlış sinyal sorunlarını önler.
Kolay Konfigürasyon
Başlamak için ATR değerini girin (varsayılan değer 15'tir). Tüm seviyeler tutarlı analiz için sabittir; verileri güncellemek için zaman dilimlerini değiştirin.
İndikatör Kılavuzu
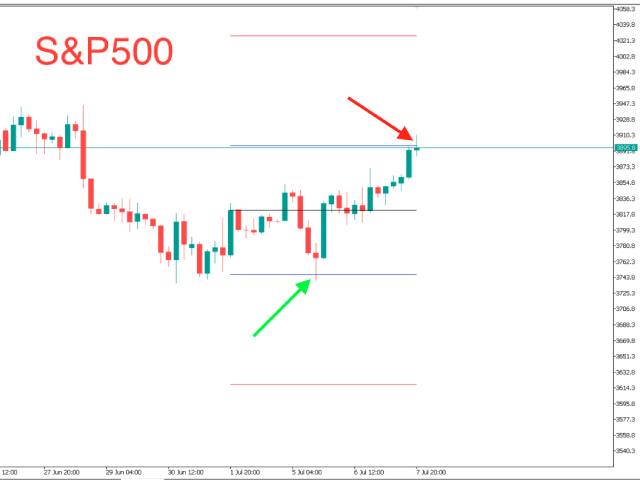
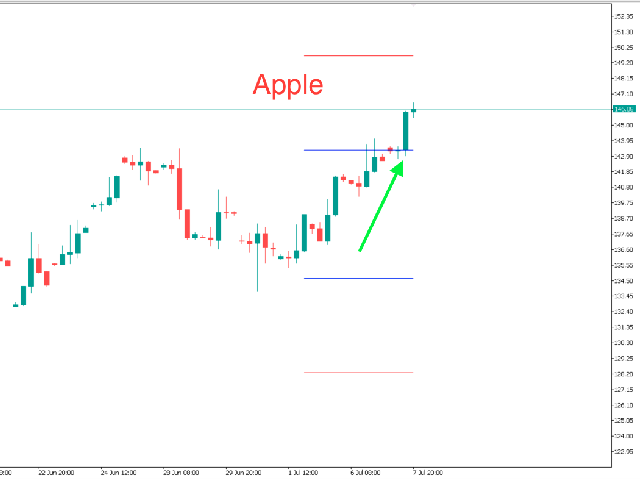
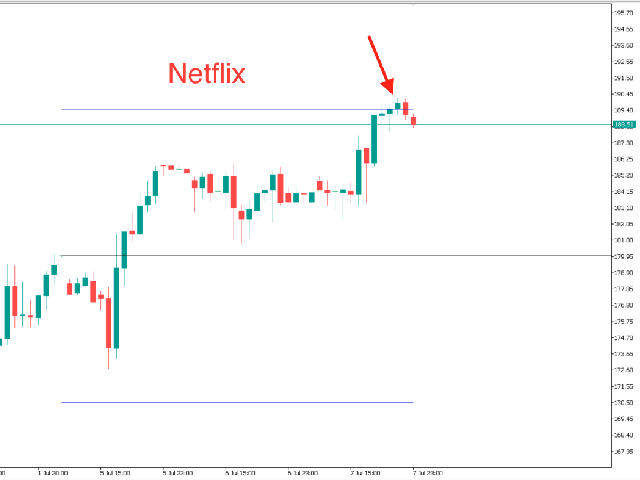
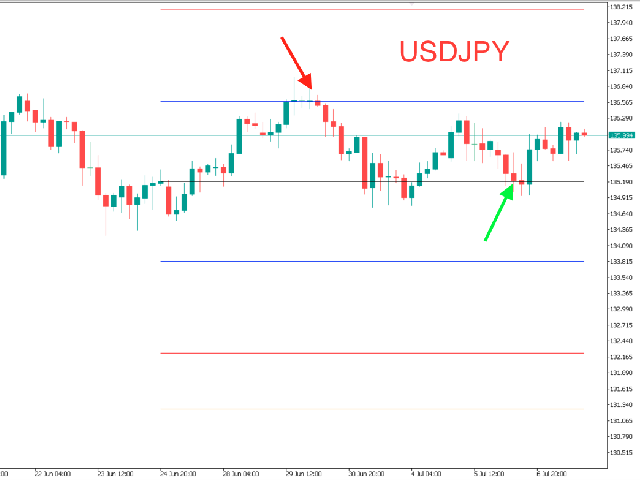
- Mavi Çizgi: Günlük volatilite.
- Kırmızı Çizgi: Haftalık volatilite.
- Turuncu Çizgi: Aylık volatilite.
Volatility Vision'ı geleneksel ATR ile birleştirerek daha stratejik fırsatlar elde edin. Ticaret stratejinizi bugün geliştirin!
İndikatörü Şimdi Edinin: Pazarı Ziyaret Edin
Kurulumu basittir ve anında başarı için sizi hazırlar!
Önemli: Statik değer sınırlamaları nedeniyle, indikatör platformlarda yalnızca ilk hafta boyunca test edilebilir.