• Genel bakış
  • İncelemeler
  • Yorumlar (2)
  • Yenilikler

Bollinger Bands Cross Alert MT5

Description: 

For a comprehensive understanding of our indicators, we invite you to explore the entire Q&A section within this MQL5 blog post here.

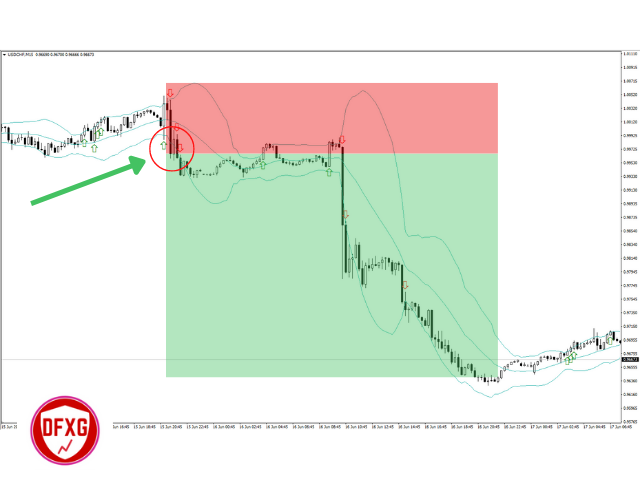
The Bollinger Bands Cross Alert Indicator is a versatile tool in the world of technical analysis, designed to assist traders in identifying potential trend reversals and significant price movements. This powerful indicator is based on Bollinger Bands, a popular volatility indicator, and offers real-time alerts for accurate and timely trading decisions.

Key Features:

  • Bollinger Bands: At the core of this indicator are the Bollinger Bands, which consist of a centerline (simple moving average) and two outer bands representing standard deviations from the centerline. The bands dynamically adjust based on market volatility, expanding during periods of high volatility and contracting during low volatility.

  • Cross Alert Signals: The indicator generates signals when the price crosses above or below the upper or lower Bollinger Bands. A bullish signal occurs when the price crosses above the upper band, suggesting potential upward momentum. Conversely, a bearish signal is triggered when the price crosses below the lower band, indicating a possible downtrend.

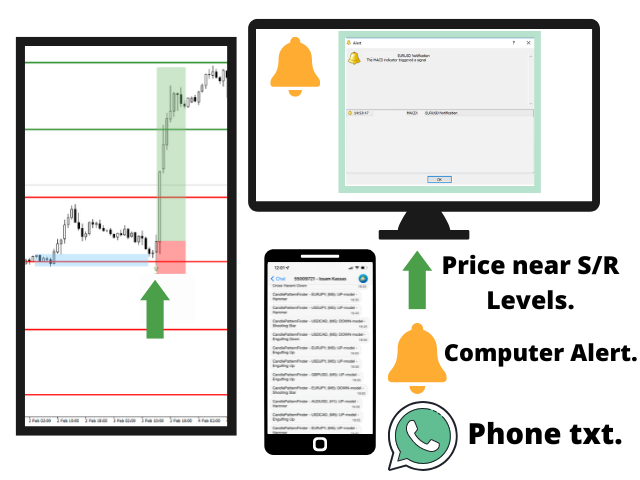
  • Customizable Alerts: Stay on top of the market with real-time alerts. The indicator allows you to set personalized alerts for bullish and bearish crosses, so you never miss an opportunity.

  • Volatility Assessment: Analyze market volatility by observing the width between the Bollinger Bands. Wider bands indicate higher volatility, while narrower bands suggest lower volatility. Understanding volatility can help you anticipate potential price breakouts or reversals.

  • Confirmation with Other Indicators: Enhance your trading strategies by combining Bollinger Bands signals with other technical indicators, such as RSI or MACD, for added confirmation.

How to Use:

  1. Trend Identification: Watch for the price to touch or cross the upper or lower Bollinger Bands. An uptrend is likely when the price stays above the centerline or crosses above the upper band. Conversely, a downtrend is possible when the price remains below the centerline or crosses below the lower band.

  2. Volatility Assessment: Monitor the width of the Bollinger Bands. Increasing width indicates rising volatility, while decreasing width signals reduced volatility. High volatility may precede major price movements.

  3. Overbought and Oversold Levels: Pay attention to price action near the Bollinger Bands. Prices near the upper band may suggest an overbought condition, while prices near the lower band may indicate an oversold condition.

  4. Divergence: Look for divergence between price and the Bollinger Bands. Divergence can indicate potential trend reversals.

  5. Risk Management: Implement sound risk management techniques, such as setting sl and tp levels, to safeguard your capital during market fluctuations.


Önerilen ürünler
The standard Bollinger Bands indicator has been improved by integrating additional indications from the Standard Deviation indicator (StdDev), which gives an additional filter for confirming trading signals. In addition, the color of the indicator's lines shows the beginning of a trend, its development and exhaustion. This indicator has a signal block that notifies the trader of the beginning of the trend on any time frame to which it is attached. Settings Type of messages - select the type of
Schaff Trend Cycle STC
Mohammad Taher Halimi Tabrizi
The Schaff Trend Cycle indicator is the product of combining Slow Stochastics and the moving average convergence/divergence (MACD). The MACD has a reputation as a trend indicator, but it's also notorious for lagging due to its slow responsive signal line. The improved signal line gives the STC its relevance as an early warning sign to detect currency trends. this indicator is converted from Trading View code of STC Indicator - A Better MACD [SHK]
40% off. Original price: $50 Advanced Bollinger Bands Scanner is a multi symbol multi timeframe Bollinger bands dashboard that monitors and analyzes the Bollinger Bands indicator from one chart. This panel scans the Bollinger bands indicator in up to 28 configurable instruments and 9 timeframes for price overbought/oversold, price consolidation (Bollinger bands squeeze), and consolidation breakout (squeeze break)  with a deep scan feature to scan all market watch symbols (up to 1000 instrument
Stochastic R
Antony Augustine
Stochastic  Reversal  allows you to recognize reversals professionally. Stochastic Indicator: This technical indicator was developed by George Lane more than 50 years ago. The reason why this indicator survived for so many years is because it continues to show consistent signals even in these current times. The Stochastic indicator is a momentum indicator that shows you how strong or weak the current trend is. It helps you identify overbought and oversold market conditions within a trend.  Rules
FXC iDeM-DivergencE MT5 Indicator This is an advanced DeMarker indicator that finds trend-turn divergences on the current symbol. The indicator detects divergence between the DeMarker and the price movements as a strong trend-turn pattern. Main features: Advanced divergence settings Price based on Close, Open or High/Low prices Give Buy/Sell open signals PUSH notifications E-mail sending Pop-up alert Customizeable Information panel Input parameters: DeM Period: The Period size of the DeMarker in
Description:  For a comprehensive understanding of our indicators, we invite you to explore the entire Q&A section within this MQL5 blog post   here . The "Moving Average Lines Crossover with Alert" is a valuable technical analysis tool designed to help traders identify potential trend reversals and trading opportunities. Seamlessly integrated into your trading platform, this indicator empowers you with essential data to make well-informed trading decisions. Spot Trend Reversals: Utilize the po
Description:  For a comprehensive understanding of our indicators, we invite you to explore the entire Q&A section within this MQL5 blog post   here . The Stochastic Cross Alert Indicator is a valuable technical analysis tool that helps traders with better signals for identifying potential trend reversals and momentum shifts. Designed to work seamlessly on various financial instruments, this indicator provides real-time alerts and customizable parameters, making it a versatile addition to your t
Owl Smart Levels MT5
Sergey Ermolov
4.07 (28)
MT4 versiyonu  |  FAQ Owl Smart Levels Indicator , Bill Williams'ın gelişmiş fraktalları , piyasanın doğru dalga yapısını oluşturan Valable ZigZag ve kesin giriş seviyelerini gösteren Fibonacci seviyeleri gibi popüler piyasa analiz araçlarını içeren tek gösterge içinde eksiksiz bir ticaret sistemidir. pazara ve kar elde edilecek yerlere. Stratejinin ayrıntılı açıklaması Gösterge ile çalışma talimatı Baykuş Yardımcısı ticaretinde Danışman Yardımcısı Kullanıcıların özel sohbeti -> Satın aldıktan
MACDivergence MTF MT5
Pavel Zamoshnikov
4 (5)
Advanced ideas of the popular MACD indicator: It detects and displays classic and reverse divergences (two methods of detecting divergences). It uses different color to highlight an uptrend and a downtrend. Two methods of determining a trend: а) MACD crosses the 0 level (classic signal); б) MACD crosses its own average (early signal). This is a multi-timeframe indicator: it can display MACD data from other timeframes. Two methods of drawing: classic histogram and line. It generates sound and vis
Advanced Trading Chaos  The main purpose of the indicator is to help the trader detect the signals described by Bill Williams in his books to make a quick and correct trading decision. 1)Bullish/Bearish Reversal Bar(BDB) 2) Divergent Bar(DB) 3) Second Sage Signal — the third consecutive Awesome Oscillator bar  4) Working fractals (Fractals that worked above/below the red forehead  5) Three bar coloring modes  5.1) Coloring of bars according to the AO indicator (Including the squatting bar)  5.2
Технический индикатор Universal Oscillator является комбинацией торговых сигналов самых популярных и широко используемых осцилляторов. Индикатор представлен гистограммами, а также линиями fast и slow MA, что позволяет расширить список получаемых торговых рекомендаций и работать как по тренду, так и в боковом движении рынка. Таким образом, гистограммы позволяют определить момент пробоя ценовых значений и движение в новой фазе рынка, а линии указывают на зоны перекупленности и перепроданности.  Ос
Description:  For a comprehensive understanding of our indicators, we invite you to explore the entire Q&A section within this MQL5 blog post   here . The Trend Line Detector Indicator is a powerful tool designed to assist traders in identifying and drawing trendlines with precision and efficiency. This indicator simplifies the process of trendline analysis by automatically detecting significant price levels and drawing trendlines based on these levels. Key features of the Trend Line Detector
Ichimoku Kinko Hyo is a purpose-built trend trading charting system that has been successfully used in nearly every tradable market. It is unique in many ways, but its primary strength is its use of multiple data points to give the trader a deeper, more comprehensive view into price action. This deeper view, and the fact that Ichimoku is a very visual system, enables the trader to quickly discern and filter "at a glance" the low-probability trading setups from those of higher probability. This i
The GGP Wave Trend Oscillator MT5 Indicator is a volatility and momentum tool designed to help traders optimize their trading performance and providing traders find the most accurate market reversals. This indicator is MT5 conversion of the Indicator: WaveTrend Oscillator [WT] by “ LazyBear “ in Trading View website and some alert methods are added to provide real-time alerts when a trading signal is generated, in order to allow traders to act quickly and efficiently. When the oscillator is abov
The " Stochastic Advanced " indicator displays the signals of the 'Stochastic" indicator directly on the chart without the presence of the indicator itself at the bottom of the screen. The indicator signals can be displayed not only on the current timeframe, but also on a timeframe one level higher. In addition, we have implemented a filter system based on the Moving Average indicator. Manual (Be sure to read before purchasing) | Version for MT4 Advantages 1. Displaying the signals of the "Stoch
MACD Color Histogram
German David Nino Cifuentes
5 (1)
MACD Histogram göstergesi, traderların piyasa trendlerini ve momentum değişikliklerini daha iyi anlamalarını sağlamak için tasarlanmış, MACD göstergesinin güncellenmiş bir versiyonudur. Orijinal MACD'den farklı olarak, bu versiyon iki çizgi arasındaki farkı gösteren bir çubuk grafik olan bir histogram içerir: MACD çizgisi ve sinyal çizgisi. Nasıl çalıştığına gelince: MACD çizgisi sinyal çizgisinin üzerinde olduğunda, yükseliş piyasasını önerir ve histogram çubukları yeşil renkte gösterilir. Öte
Range Target
Ignacio Agustin Mene Franco
Range Target! indicator that marks the depletion of strength of the candle where it touches the floor and catches a trend, whether it is up or down The indicator has two support lines where it marks the floor and the ceiling. where on the same line marks the entry for rise or fall, the lines have Gold and Blue colors the gold line shows the purchase the blue line shows the sale works for any season works for forex markets works for synthetic index markets! Good Profit, World Investor.
The Optimized MACD Divergence indicator is a powerful tool designed to identify potential trading opportunities by detecting divergences between price action and the MACD indicator. It combines classic divergence analysis with candlestick pattern recognition and volume filtering to provide more accurate and reliable signals. How it Works The indicator operates on the following principles: MACD Calculation:   It calculates the MACD indicator using user-defined parameters for fast EMA, slow EMA,
Noize Absorption Index - is the manual trading system that measures the difference of pressure between bears forces and bulls forces. Green line - is a noize free index that showing curent situation. Zero value of index shows totally choppy/flat market.Values above zero level shows how powerfull bullish wave is and values below zero measures bearish forces.Up arrow appears on bearish market when it's ready to reverse, dn arrow appears on weak bullish market, as a result of reverse expectation.
VSA target
Evgenii Bazhenov
Vsa'nın amacı Gösterge, profesyonel alıcıyı veya profesyonel satıcıyı grafikte VSA (Volume Spread Analysis) sistemini kullanarak tanımlar ve bu çubuklara (mumlara) ve hedef seviyelere göre bir eğilim destek bölgesi oluşturur.  Özellikler: 1. Bu göstergede, yalnızca profesyonel alıcının veya profesyonel satıcının tanımlanacağı ve her iki profesyonel katılımcının aynı anda tanımlanacağı bir mod seçebilirsiniz. 2. Destek bölgesini ve hedef seviyelerini belirlemek için sembol üzerindeki herhangi bi
Description:  For a comprehensive understanding of our indicators, we invite you to explore the entire Q&A section within this MQL5 blog post   here . The RSI Cross Alert Indicator is a powerful technical analysis tool designed to assist traders in identifying potential trend reversals and generating timely buy or sell signals. This user-friendly indicator is suitable for both novice and experienced traders, providing valuable insights into market trends and price movements. Key Features: - RSI
FXC iMACD-DivergencE MT5 Indicator This is an advanced MACD indicator that finds trend-turn divergences on the current symbol. The indicator detects divergence between the MACD and the price movements as a strong trend-turn pattern. Main features: Advanced divergence settings Price based on Close, Open or High/Low prices Give Buy/Sell open signals PUSH notifications E-mail sending Pop-up alert Customizeable Information panel Input parameters: MACD Fast-EMA: The Fast-EMA variable of the MACD indi
KDJ Index 4   交易实用必备工具指标 波浪自动计算指标,通道趋势交易 完美的趋势-波浪自动计算通道计算 , MT4版本 完美的趋势-波浪自动计算通道计算 , MT5版本 本地跟单复制交易 Easy And Fast Copy , MT4版本 Easy And Fast Copy , MT5版本 本地跟单复制交易 模拟试用 Easy And Fast Copy , MT4 模拟账号运行 Easy And Fast Copy , MT5 模拟账号运行 "Cooperative QQ:556024  "  "Cooperation wechat:556024"  "Cooperative email:556024@qq.com" 强烈推荐趋势指标, 波浪的标准自动计算   和   波浪的标准自动计算MT5版本     KDJ指标又叫 随机指标 ,是一种相当新颖、实用的技术分析指标,它起先用于期货市场的分析,后被广泛用于股市的中短期趋势分析,是期货和股票市场上最常用的技术分析工具。 随机指标KDJ一般是用于股票分析的统计体系,根据统计学原理,通过一个特定的周期(常为9日、9周等)
Buy CTS scalping indicator, provide buying and selling signals, automatic channeling and sending signals to mobile phones Using technical analysis and price action methods and modern methods, CTS indicator can draw price channels and recognize price trends with high accuracy and issue entry and exit signals according to them. Traders can easily fluctuate using this indicator in different time frames and in different markets. With the CTS indicator, you can signal in different ways. This indicato
Trilliant trend göstergesi. Trilliant trend, trendi erken tespit etmek için gizli saygın göstergeleri birleştiren gelişmiş bir forex göstergesidir. Adının gösterdiği gibi bu bir trend göstergesi ama neredeyse tüm forex stratejileri (her biri) ticaret için birleştirilmiştir, göstergede ayarları, bantları ve satırları manipüle eder. Her forex stratejisi trilyonluk eğilimi kullanarak ticaret edilebilir. Koşullar oluşturan mumlar bir satın alma sinyali okunuşu vermek için trilliant üst bantı ve
The indicator identifies divergences between chart and RSI, with the possibility of confirmation by stochastics or MACD. A divergence line with an arrow appears on the chart when divergence is detected after the current candle has expired. There are various filter parameters that increase the accuracy of the signals. To identify a divergence, point A must be set in the RSI, then point B Value must be edited, which sets the difference between point A and point B. The indicator can be used for tim
The main advantage of this indicator is filtering of buy and sell signals in the direction of the market impulse and ranking them by strength. Configuration of the indicator is simple and intuitive. All you need to do is to react only to strong signals. Adhere to the money management rules. Description The Color Stochastic with an analytical panel indicator consists of the Stochastic indicator itself and the information/analytics panel. The indicator provides options for configuring the paramet
Supertrend indicator uses a combination of a moving average and average true range to detect the trend of a trading instrument. Supertrend indicator for MetaTrader 5 easily shows the trend as a line following the price. Triple SuperTrend Histo indicator  calculate  three supertrends to show the trend as a histogram. Changing the color from red to green means you can BUY , from green to red means you can SELL . Description of the method of drawing a histogram. The price is above the EMA 200,
Point Black
Ignacio Agustin Mene Franco
Black Card Pack indicator 5/1 point black It has the strategy of professional bollingers where each arrow gives you a different entry signal. It is used to operate in m1 and in d1 It is used for scalping and intraday, modified for forex markets ! suitable for all pairs modified for synthetic index markets suitable for all pairs! Ideal for volatility and jumps!
Ichimoku Aiko MTF
Michael Jonah Randriamampionontsoa
Ichimoku Aiko MTF is a collection of technical indicators that show support and resistance levels, as well as momentum and trend direction. It is a multi-timeframe indicator so you don't need to change the chart timeframe when you want to see the ichimoku clouds on a higher timeframe.  eg. The chart timeframe is M15 and you want to see on the M15 timeframe chart the H1 ichimoku indicators (the ichimoku in Metatrader can't do that) that's why you need to use Ichimoku Aiko MTF.
Bu ürünün alıcıları ayrıca şunları da satın alıyor
Trend Screener Pro MT5
STE S.S.COMPANY
4.89 (72)
Trend Göstergesi, Trend Alım Satım ve Filtreleme için Çığır Açan Benzersiz Çözüm, Tüm Önemli Trend Özellikleriyle Tek Bir Araç İçinde Yerleştirildi! Forex, emtialar, kripto para birimleri, endeksler ve hisse senetleri gibi tüm sembollerde/araçlarda kullanılabilen %100 yeniden boyamayan çoklu zaman çerçevesi ve Çoklu para birimi göstergesidir. Trend Screener, grafikte noktalarla ok trend sinyalleri sağlayan etkili bir trend trend göstergesidir. Trend analizörü göstergesinde bulunan özellikler: 1.
Golden Trend Indicator MT5
Noha Mohamed Fathy Younes Badr
4.86 (14)
Golden Trend indicator  is The best indicator for predicting trend movement this indicator never lags and never repaints and never back paints    and give  arrow buy and sell    before the candle appear  and it will help you and  will make your trading decisions clearer its work on all currencies and  gold and crypto and all time frame This unique  indicator uses very secret algorithms to catch the  trends, so you can trade using this indicator and see the trend clear on charts  manual guide and
FX Volume MT5
Daniel Stein
4.82 (17)
FX Volume: Bir Broker’ın Perspektifinden Gerçek Piyasa Duyarlılığını Deneyimleyin Kısa Özet Trading yaklaşımınızı bir adım öteye taşımak ister misiniz? FX Volume , perakende traderlar ile brokerların nasıl konumlandığını gerçek zamanlı olarak sunar—COT gibi gecikmeli raporlardan çok daha önce. İster istikrarlı kazançları hedefliyor olun, ister piyasada daha güçlü bir avantaj arayın, FX Volume önemli dengesizlikleri belirlemenize, kırılmaları (breakout) doğrulamanıza ve risk yönetiminizi iyileş
FX Power MT5 NG
Daniel Stein
5 (10)
FX Power: Daha Akıllı Ticaret Kararları için Para Birimlerinin Gücünü Analiz Edin Genel Bakış FX Power , her piyasa koşulunda başlıca para birimlerinin ve altının gerçek gücünü anlamak için vazgeçilmez bir araçtır. Güçlü para birimlerini alıp zayıf olanları satarak, FX Power ticaret kararlarınızı basitleştirir ve yüksek olasılıklı fırsatları ortaya çıkarır. İster trendlere sadık kalın ister Delta'nın aşırı değerlerini kullanarak tersine dönüşleri öngörün, bu araç ticaret tarzınıza mükemmel bir
Quantum TrendPulse
Bogdan Ion Puscasu
5 (13)
SuperTrend   ,   RSI   ve   Stochastic'in   gücünü tek bir kapsamlı göstergede birleştirerek işlem potansiyelinizi en üst düzeye çıkaran nihai işlem aracı olan   Quantum TrendPulse'u   tanıtıyoruz. Hassasiyet ve verimlilik arayan yatırımcılar için tasarlanan bu gösterge, piyasa trendlerini, momentum değişimlerini ve en uygun giriş ve çıkış noktalarını güvenle belirlemenize yardımcı olur. Temel Özellikler: SuperTrend Entegrasyonu:   Güncel piyasa trendlerini kolayca takip edin ve karlılık dalgası
IX Power MT5
Daniel Stein
4.83 (6)
IX Power: Endeksler, Emtialar, Kripto Paralar ve Forex Piyasaları için İçgörüler Genel Bakış IX Power , endeksler, emtialar, kripto paralar ve forex sembollerinin gücünü analiz etmek için tasarlanmış çok yönlü bir araçtır. FX Power , tüm kullanılabilir döviz çiftlerinin verilerini kullanarak döviz çiftleri için maksimum doğruluk sağlarken, IX Power yalnızca temel sembolün piyasa verilerine odaklanır. Bu, IX Power 'ı forex dışındaki piyasalar için ideal ve daha basit forex analizleri için güven
FX Levels MT5
Daniel Stein
5 (2)
FX Levels: Tüm Piyasalar İçin Son Derece Hassas Destek ve Direnç Hızlı Bakış Döviz kurları, endeksler, hisseler veya emtialar gibi herhangi bir piyasada güvenilir destek ve direnç seviyeleri belirlemek mi istiyorsunuz? FX Levels geleneksel “Lighthouse” yöntemini ileri düzey bir dinamik yaklaşımla birleştirerek neredeyse evrensel bir doğruluk sağlar. Gerçek broker deneyimimize ve otomatik günlük güncellemeler ile gerçek zamanlı güncellemelerin birleşimine dayalı olarak, FX Levels size dönüş nok
TPSpro RFI Levels MT5
Roman Podpora
4.53 (19)
TALİMATLAR         RUS   -        ENG       Bir gösterge ile kullanılması   önerilir       -       TPSpro   TREND PRO -   Sürüm MT4         Ticarette önemli bir unsur, bir ticaret aracını satın alma veya satma kararlarının alındığı bölgeler veya seviyelerdir. Büyük oyuncuların piyasadaki varlıklarını gizleme girişimlerine rağmen, kaçınılmaz olarak izler bırakırlar. Bizim görevimiz bu izleri nasıl tanımlayacağımızı ve doğru şekilde nasıl yorumlayacağımızı öğrenmekti. Ana işlevler:: Satıcılar ve
TPSproTREND PrO MT5
Roman Podpora
4.47 (17)
TPSpro TREND PRO  - is a trend indicator that automatically analyzes the market and provides information about the trend and each of its changes, as well as giving signals for entering trades without redrawing! The indicator uses each candle, analyzing them separately. referring to different impulses - up or down impulse. Exact entry points into transactions for currencies, crypto, metals, stocks, indices!  ИНСТРУКЦИЯ RUS         INSTRUCTIONS  ENG       R ecommended to use with an indicator   -
RelicusRoad Pro MT5
Relicus LLC
4.78 (18)
Şimdi 147 $ (birkaç güncellemeden sonra 499 $ 'a yükseliyor) - Sınırsız Hesaplar (PC'ler veya Mac'ler) RelicusRoad Kullanım Kılavuzu + Eğitim Videoları + Özel Discord Grubuna Erişim + VIP Durumu PİYASAYA BAKMAK İÇİN YENİ BİR YOL RelicusRoad, forex, vadeli işlemler, kripto para birimleri, hisse senetleri ve endeksler için dünyanın en güçlü ticaret göstergesidir ve yatırımcılara kârlı kalmaları için ihtiyaç duydukları tüm bilgileri ve araçları sağlar. Başlangıç ​​seviyesinden ileri seviyeye ka
Support And Resistance Screener, MetaTrader için tek bir gösterge içinde birden fazla araç sağlayan tek bir Düzey göstergesindedir. Kullanılabilir araçlar şunlardır: 1. Piyasa Yapısı Eleme Aracı. 2. Geri Çekilme Bölgesi Boğa. 3. Geri Çekilme Bölgesi Ayı. 4. Günlük Pivot Noktaları 5. haftalık Pivot Noktaları 6. aylık Pivot Puanları 7. Harmonik Modele ve hacme dayalı Güçlü Destek ve Direnç. 8. Banka Seviyesi Bölgeleri. SINIRLI SÜRELİ TEKLİF : YG Destek ve Direnç Göstergesi sadece 50 $ ve ömür boyu
Bill Williams Advanced
Siarhei Vashchylka
5 (9)
Bill Williams Advanced is designed for automatic chart analysis using Bill Williams' "Profitunity" system. The indicator analyzes four timeframes at once. Manual (Be sure to read before purchasing) Advantages 1. Automatically analyzes the chart using the "Profitunity" system of Bill Williams. The found signals are placed in a table in the corner of the screen. 2. Equipped with a trend filter based on the Alligator indicator. Most of the system signals are recommended to be used only according t
Bu gösterge paneli, seçilen semboller için mevcut en son   harmonik kalıpları   gösterir, böylece zamandan tasarruf edersiniz ve daha verimli olursunuz /   MT4 sürümü . Ücretsiz Gösterge:   Basic Harmonic Pattern Gösterge sütunları Symbol :   seçilen semboller görünecektir Trend:   yükseliş veya düşüş Pattern :   desen türü (gartley, kelebek, yarasa, yengeç, köpekbalığı, cypher veya ABCD) Entry :   giriş fiyatı SL:   zararı durdur fiyatı TP1:   1. kar alma fiyatı TP2:   2. kar alma fiyatı TP
Öncelikle, bu Ticaret Aracının Non-Repainting, Non-Redrawing ve Non-Lagging Gösterge olduğunu vurgulamakta fayda var, bu da onu profesyonel ticaret için ideal hale getiriyor. Çevrimiçi kurs, kullanıcı kılavuzu ve demo. Akıllı Fiyat Hareketi Kavramları Göstergesi, hem yeni hem de deneyimli tüccarlar için çok güçlü bir araçtır. İleri ticaret fikirlerini, Inner Circle Trader Analizi ve Smart Money Concepts Ticaret Stratejileri gibi 20'den fazla kullanışlı göstergeyi bir araya getirerek bir araya
Top indicator for MT5   providing accurate signals to enter a trade without repainting! It can be applied to any financial assets:   forex, cryptocurrencies, metals, stocks, indices .  Watch  the video  (6:22) with an example of processing only one signal that paid off the indicator! MT4 version is here It will provide pretty accurate trading signals and tell you when it's best to open a trade and close it. Most traders improve their trading results during the first trading week with the help of
FX Dynamic: Özelleştirilebilir ATR Analiziyle Volatilite ve Trendleri Takip Edin Genel Bakış FX Dynamic , ortalama gerçek aralık (ATR) hesaplamalarını kullanarak günlük ve gün içi volatilite hakkında rakipsiz bilgiler sağlayan güçlü bir araçtır. 80%, 100%, 130% gibi net volatilite eşikleri ayarlayarak, piyasa olağan hareketlerinin ötesine geçtiğinde hızlı şekilde uyarı alabilir ve potansiyel kazanç fırsatlarını süratle tespit edebilirsiniz. FX Dynamic , brokerınızın zaman dilimine uyum sağlaya
Gold Stuff mt5
Vasiliy Strukov
4.92 (173)
Gold Stuff mt5, özellikle altın için tasarlanmış bir trend göstergesidir ve herhangi bir finansal enstrümanda da kullanılabilir. Gösterge yeniden çizilmez ve gecikmez. Önerilen zaman dilimi H1. Ayarları ve kişisel bir bonusu almak için satın alma işleminden hemen sonra benimle iletişime geçin!  Güçlü Destek ve Trend Tarayıcı göstergemizin ücretsiz bir kopyasını pm'den alabilirsiniz. Ben!   AYARLAR Ok Çiz - açık kapalı. grafik üzerinde oklar çizmek. Uyarılar - sesli uyarılar kapalı. E-posta b
Tanıtım       Quantum Breakout PRO   , Breakout Bölgeleri ile ticaret yapma şeklinizi değiştiren çığır açan MQL5 Göstergesi! 13 yılı aşkın ticaret tecrübesine sahip deneyimli tüccarlardan oluşan bir ekip tarafından geliştirilmiştir.       Kuantum Breakout PRO       yenilikçi ve dinamik koparma bölgesi stratejisiyle ticaret yolculuğunuzu yeni zirvelere taşımak için tasarlanmıştır. Kuantum Breakout Göstergesi, size 5 kar hedefi bölgesi ile kırılma bölgelerinde sinyal okları ve kırılma kutusuna da
Matrix Arrow Indicator MT5
Juvenille Emperor Limited
5 (13)
Matrix Arrow Indicator MT5 ,   forex ,   emtialar ,   kripto   para birimleri ,   endeksler ,   hisse senetleri   gibi tüm sembollerde/araçlarda kullanılabilen   %100 yeniden boyamayan   çoklu zaman çerçevesi göstergesini izleyen benzersiz bir 10'u 1 arada trenddir.  Matrix Arrow Indicator MT5 , mevcut eğilimi erken aşamalarında belirleyecek ve aşağıdakiler gibi 10'a kadar standart göstergeden bilgi ve veri toplayacaktır: Ortalama Yönlü Hareket Endeksi (ADX) Emtia Kanal Endeksi (CCI) Klasik Hei
Easy Breakout MT5
Mohamed Hassan
5 (3)
After your purchase, feel free to contact me for more details on how to receive a bonus indicator called VFI, which pairs perfectly with Easy Breakout for enhanced confluence!     Easy Breakout MT5   is a powerful price action trading system built on one of the most popular and widely trusted strategies among traders: the   Breakout strategy ! This indicator delivers crystal-clear Buy and Sell signals based on breakouts from key support and resistance zones. Unlike typical breakout indicators
Gartley Hunter Multi
Siarhei Vashchylka
5 (9)
Gartley Hunter Multi - An indicator for searching for harmonic patterns simultaneously on dozens of trading instruments and on all possible timeframes. Manual (Be sure to read before purchasing) | Version for MT4 Advantages 1. Patterns: Gartley, Butterfly, Shark, Crab. Bat, Alternate Bat, Deep Crab, Cypher 2. Simultaneous search for patterns on dozens of trading instruments and on all possible timeframes 3. Search for patterns of all possible sizes. From the smallest to the largest 4. All fou
Royal Scalping Indicator M5
Vahidreza Heidar Gholami
5 (6)
Royal Scalping Indicator is an advanced price adaptive indicator designed to generate high-quality trading signals. Built-in multi-timeframe and multi-currency capabilities make it even more powerful to have configurations based on different symbols and timeframes. This indicator is perfect for scalp trades as well as swing trades. Royal Scalping is not just an indicator, but a trading strategy itself. Features Price Adaptive Trend Detector Algorithm Multi-Timeframe and Multi-Currency Trend Low
Trade smarter, not harder: Empower your trading with Harmonacci Patterns Special Offer: Purchase now to receive free bonuses worth $165! (Read more for details) This is arguably the most complete harmonic price formation auto-recognition indicator you can find for the MetaTrader Platform. It detects 19 different patterns, takes fibonacci projections as seriously as you do, displays the Potential Reversal Zone (PRZ) and finds suitable stop-loss and take-profit levels. [ Installation Guide | Upd
Bu gösterge paneli, seçilen semboller için ticaret stratejinize bağlı olarak hem ölçeklendirme hem de uzun vadeli modda grafikteki   Arz ve Talep   bölgelerini keşfeder ve görüntüler. Ek olarak, gösterge tablosunun tarayıcı modu, istediğiniz tüm sembolleri bir bakışta kontrol etmenize ve uygun pozisyonları kaçırmamanıza yardımcı olur /   MT4 sürümü Ücretsiz gösterge:   Basic Supply Demand Özellikler Birden fazla döviz çiftinde   alım satım fırsatlarını görüntülemenize olanak tanıyarak, arz
QM Pattern Scanner MT5
Reza Aghajanpour
5 (4)
Contact me  to send you instruction and add you in group. QM (Quasimodo) Pattern is based on Read The Market(RTM) concepts. The purpose of this model is to face the big players of the market (financial institutions and banks), As you know in financial markets, big traders try to fool small traders, but RTM prevent traders from getting trapped. This style is formed in terms of price candles and presented according to market supply and demand areas and no price oscillator is used in it. RTM conc
Auto Order Block with break of structure based on ICT and Smart Money Concepts (SMC) Futures Break of Structure ( BoS )             Order block ( OB )            Higher time frame Order block / Point of Interest ( POI )    shown on current chart           Fair value Gap ( FVG ) / Imbalance   -  MTF      ( Multi Time Frame )    HH/LL/HL/LH  -  MTF      ( Multi Time Frame )  Choch  MTF      ( Multi Time Frame )  Volume Imbalance     ,  MTF          vIMB Gap’s Power of 3 Equal High / Low’s  
Volumatic VIDyA MT5
Duc Hoan Nguyen
5 (1)
Special offer : ALL TOOLS , just $35 each! New tools   will be   $30   for the   first week   or the   first 3 purchases !  Trading Tools Channel on MQL5 : Join my MQL5 channel to update the latest news from me Volumatic VIDYA (Variable Index Dynamic Average) , trendleri izlemek ve her trend aşamasında alım-satım baskısını analiz etmek için tasarlanmış gelişmiş bir göstergedir. Dinamik Ortalama Değişken Endeksi (Variable Index Dynamic Average) temel bir dinamik düzleştirme tekniği olarak kullan
Dark Absolute Trend   is an Indicator for intraday trading. This Indicator is based on   Trend Following  strategy but use also candlestick patterns and Volatility. We can enter in good price with this Indicator, in order to follow the main trend on the current instrument. It is advised to use low spread ECN brokers. This Indicator does   Not repaint   and   N ot lag . Recommended timeframes are M5, M15 and H1. Recommended working pairs: All. I nstallation and  Update Guide   -  Troubleshooting
CONTACT US  after purchase to get the Indicator Manual. Try Now—Limited 50% Discount for First 10 Buyers! Download the  Metatrader 4 Version Due to regulatory restrictions, our service is unavailable in certain countries such as India, Pakistan, and Bangladesh. William Delbert Gann (W.D. Gann) was an exceptional market analyst, whose trading technique was based on a complex blend of mathematics, geometry, astrology, and ancient mathematics which proved to be extremely accurate. A Note from t
Suleiman Levels
Suleiman Alhawamdah
5 (2)
Önemli Not: Ekran görüntülerinde gösterilen resim, benim 2 göstergem olan "Süleyman Seviyeleri" göstergesi ve "RSI Trend V" göstergesine aittir. "RSI Trend V1" göstergesiyle birlikte kullanılmasını önerdim, özellikle renkli bulutu doğrulamak ve eşleştirmek için, ayrıca ok sinyalleri için, bunun yanı sıra Fibonacci göstergesinin ve eklenen olağanüstü seviyelerinin önemini de vurguladım : https://www.mql5.com/en/market/product/132080 "Süleyman Seviyeleri" göstergesi, gelişmiş, hepsi bir arada pro
Yazarın diğer ürünleri
Trend Yakalayıcı: Alarm İndikatörü ile Trend Yakalayıcı Stratejisi, piyasa trendlerini ve potansiyel giriş ve çıkış noktalarını belirlemede yardımcı olan çok yönlü bir teknik analiz aracıdır. Piyasa koşullarına uyum sağlayarak trend yönünün net görsel temsili için dinamik bir Trend Yakalayıcı Stratejisi sunar. Tüccarlar tercihlerine ve risk toleranslarına göre parametreleri özelleştirebilirler. Gösterge, trendleri tanımlamaya yardımcı olur, potansiyel ters dönüşleri sinyaller, trailing stop me
FREE
Öncelikle, bu Ticaret Aracının Non-Repainting, Non-Redrawing ve Non-Lagging Gösterge olduğunu vurgulamakta fayda var, bu da onu profesyonel ticaret için ideal hale getiriyor. Çevrimiçi kurs, kullanıcı kılavuzu ve demo. Akıllı Fiyat Hareketi Kavramları Göstergesi, hem yeni hem de deneyimli tüccarlar için çok güçlü bir araçtır. İleri ticaret fikirlerini, Inner Circle Trader Analizi ve Smart Money Concepts Ticaret Stratejileri gibi 20'den fazla kullanışlı göstergeyi bir araya getirerek bir araya
Destek ve Direnç Seviyeleri Bulucu: Destek ve Direnç Seviyeleri Bulucu, ticarette teknik analizi geliştirmek için tasarlanmış gelişmiş bir araçtır. Dinamik destek ve direnç seviyeleriyle donatılmış olup, yeni anahtar noktalar grafikte ortaya çıktıkça gerçek zamanlı olarak adapte olur ve böylece dinamik ve tepkisel bir analiz sunar. Benzersiz çoklu zaman dilimi yeteneği, kullanıcıların istedikleri zaman diliminde farklı zaman dilimlerinden destek ve direnç seviyelerini göstermelerine olanak tan
FREE
Trading Pozisyonu ve Geri Test Aracı: "Trading Pozisyonu ve Geri Test Aracı", aynı zamanda "Risk Ödül Oranı Aracı" olarak da bilinen kapsamlı ve yenilikçi bir göstergedir ve teknik analizinizi ve ticaret stratejilerinizi geliştirmek için tasarlanmıştır. Risk Aracı, forex ticaretinde etkili risk yönetimi için kapsamlı ve kullanıcı dostu bir çözümdür. Giriş fiyatı, stop-loss (SL) ve take-profit (TP) seviyeleri de dahil olmak üzere ticaret pozisyonlarını önizleme yeteneği ile gelecek işlemlerin ş
FREE
Trading Oturumları Zaman Göstergesi: "Trading Oturumları Zaman Göstergesi", forex piyasasındaki farklı işlem oturumlarına ilişkin anlayışınızı artırmak amacıyla tasarlanmış güçlü bir teknik analiz aracıdır. Bu sorunsuz entegre edilmiş gösterge, Tokyo, Londra ve New York gibi ana oturumların açılış ve kapanış saatleri hakkında önemli bilgiler sağlar. Otomatik zaman dilimi ayarıyla dünya çapındaki tüccarlara hitap ederek, yüksek likidite dönemleri için işlem saatlerini optimize etmelerine ve düş
FREE
Öncelikle, bu Ticaret Sistemi'nin Non-Repainting, Non-Redrawing ve Non-Lagging Göstergesi olduğunu vurgulamak önemlidir, bu da hem manuel hem de robot ticareti için ideal hale getirir. Online kurs, kılavuz ve ön ayarları indir. "Smart Trend Trading System MT5", yeni ve deneyimli tüccarlar için özelleştirilmiş kapsamlı bir ticaret çözümüdür. 10'dan fazla premium göstergeyi birleştiriyor ve 7'den fazla sağlam ticaret stratejisi sunuyor, bu da çeşitli piyasa koşulları için esnek bir seçim yapar. Tr
Destek ve Direnç Seviyeleri Bulucu: Destek ve Direnç Seviyeleri Bulucu, ticarette teknik analizi geliştirmek için tasarlanmış gelişmiş bir araçtır. Dinamik destek ve direnç seviyeleriyle donatılmış olup, yeni anahtar noktalar grafikte ortaya çıktıkça gerçek zamanlı olarak adapte olur ve böylece dinamik ve tepkisel bir analiz sunar. Benzersiz çoklu zaman dilimi yeteneği, kullanıcıların istedikleri zaman diliminde farklı zaman dilimlerinden destek ve direnç seviyelerini göstermelerine olanak tan
FREE
Trading Oturumları Zaman Göstergesi: "Trading Oturumları Zaman Göstergesi", forex piyasasındaki farklı işlem oturumlarına ilişkin anlayışınızı artırmak amacıyla tasarlanmış güçlü bir teknik analiz aracıdır. Bu sorunsuz entegre edilmiş gösterge, Tokyo, Londra ve New York gibi ana oturumların açılış ve kapanış saatleri hakkında önemli bilgiler sağlar. Otomatik zaman dilimi ayarıyla dünya çapındaki tüccarlara hitap ederek, yüksek likidite dönemleri için işlem saatlerini optimize etmelerine ve düş
FREE
Trading Pozisyonu ve Geri Test Aracı: "Trading Pozisyonu ve Geri Test Aracı", aynı zamanda "Risk Ödül Oranı Aracı" olarak da bilinen kapsamlı ve yenilikçi bir göstergedir ve teknik analizinizi ve ticaret stratejilerinizi geliştirmek için tasarlanmıştır. Risk Aracı, forex ticaretinde etkili risk yönetimi için kapsamlı ve kullanıcı dostu bir çözümdür. Giriş fiyatı, stop-loss (SL) ve take-profit (TP) seviyeleri de dahil olmak üzere ticaret pozisyonlarını önizleme yeteneği ile gelecek işlemlerin ş
FREE
Get FREE Advanced Online Course and Learn About Our Advanced Trading System, Link in the Bio!  Click Here.  Our Mission and Vision:   Why Am I Even Here?    Here is The Deal Brother, We Offer:Premium Quality Indicators: The Highest Quality Possible Algorithms. Unlimited Activations: Can be used on Unlimited number of Computers, MT4s and MT5s for lifetime. Inexpensive Prices: 30$ is the lowest price possible, Knowing that more than 50% of our Indicators are 100% FREE. But Why Am I telling You th
Description:  The "ABC Pattern Strategy With Fibonacci" Indicator is a sophisticated technical analysis tool meticulously designed to recognize and leverage the power of the ABC chart patterns in combination with Fibonacci levels. This cutting-edge strategy empowers traders to make well-informed decisions in the dynamic forex market. By making spotting ABC patterns on price charts an easy task, the indicator offers insights into potential trend reversals or continuations. It seamlessly incorpora
Get FREE Advanced Online Course and Learn About Our Advanced Trading System, Link in the Bio!  Click Here.  Our Mission and Vision:   Why Am I Even Here? Here is The Deal Brother, We Offer:Premium Quality Indicators: The Highest Quality Possible Algorithms. Unlimited Activations: Can be used on Unlimited number of Computers, MT4s and MT5s for lifetime. Inexpensive Prices: 30$ is the lowest price possible, Knowing that more than 50% of our Indicators are 100% FREE. But Why Am I telling You this?
Description:  For a comprehensive understanding of our indicators, we invite you to explore the entire Q&A section within this MQL5 blog post   here . Technical indicators are crucial tools for analyzing market trends. Smart Volume, can help traders understand price movements and market strength. This indicator utilizes tick volume and price action to identify market trends and reversals. The Smart Volume indicator displays volume bars in blue, yellow, green, red, and white, each signifying dis
Description:  For a comprehensive understanding of our indicators, we invite you to explore the entire Q&A section within this MQL5 blog post   here . The "Moving Average Lines Crossover with Alert" is a valuable technical analysis tool designed to help traders identify potential trend reversals and trading opportunities. Seamlessly integrated into your trading platform, this indicator empowers you with essential data to make well-informed trading decisions. Spot Trend Reversals: Utilize the pow
FREE
Description:  For a comprehensive understanding of our indicators, we invite you to explore the entire Q&A section within this MQL5 blog post   here . The "Show TP and SL Values" Indicator is a valuable technical analysis tool designed to enhance your trading experience by displaying the  (TP) and  (SL) levels directly on your chart. This simple yet effective tool provides traders with crucial information, allowing for better decision-making and risk management. Key Features: TP and SL Display:
FREE
Price Alert Panel MT4
Issam Kassas
4.75 (12)
Get FREE Advanced Online Course and Learn About Our Advanced Trading System, Link in the Bio!  Click Here.  Our Mission and Vision: Why Am I Even Here?Here is The Deal Brother, We Offer: Premium Quality Indicators: The Highest Quality Possible Algorithms. Unlimited Activations: Can be used on Unlimited number of Computers, MT4s and MT5s for lifetime. Inexpensive Prices: 30$ is the lowest price possible, Knowing that more than 50% of our Indicators are 100% FREE. But Why Am I telling You this?
FREE
Description:  For a comprehensive understanding of our indicators, we invite you to explore the entire Q&A section within this MQL5 blog post   here . The "Show TP and SL Values" Indicator is a valuable technical analysis tool designed to enhance your trading experience by displaying the  (TP) and  (SL) levels directly on your chart. This simple yet effective tool provides traders with crucial information, allowing for better decision-making and risk management. Key Features: TP and SL Display:
FREE
Description:  The Range Breakout Catcher Indicator is a powerful tool known for its non-repainting, non-redrawing, and non-lagging capabilities, making it suitable for both manual and robot trading. This indicator utilizes a smart algorithm to calculate ranges and generate early signals for Buy and Sell positions at the breakout of these ranges, facilitating the capture of trends during ranging consolidations. The range calculation involves a comprehensive system based on various elements, prov
Description:  For a comprehensive understanding of our indicators, we invite you to explore the entire Q&A section within this MQL5 blog post   here . The Moving Average 5EMA Indicator is a valuable tool designed to provide comprehensive insights into market trends and potential entry and exit points. It incorporates five exponential moving average (EMA) lines, each representing the average price over different periods. This powerful combination offers a deeper understanding of price movements a
FREE
Description:  For a comprehensive understanding of our indicators, we invite you to explore the entire Q&A section within this MQL5 blog post   here . The "Live Account Statistics" Indicator is a powerful technical analysis tool that provides real-time insights into the performance of your trading account. With this indispensable tool, you can access crucial account statistics, such as balance, equity, drawdown, and more, allowing you to make data-driven trading decisions. Key Features: Real-Ti
FREE
Description:  For a comprehensive understanding of our indicators, we invite you to explore the entire Q&A section within this MQL5 blog post   here . The "High Spread Alert" Indicator is a valuable tool for traders, providing real-time information about spread fluctuations in the forex market. As a technical analysis tool, it helps traders make informed decisions by alerting them to periods of high spread, which can impact trading conditions and execution. Key Features: Spread Monitoring: The
FREE
Description:  For a comprehensive understanding of our indicators, we invite you to explore the entire Q&A section within this MQL5 blog post   here . The "VWAP Indicator Strategy" is a cutting-edge technical analysis tool designed to provide traders with a competitive advantage in the financial markets. By incorporating the Volume Weighted Average Price (VWAP) indicator, this tool offers valuable insights into market trends, price levels, and potential turning points. Understanding the VWAP Ind
Description:  The "Trend Finder Multi Time Frames multi pairs" indicator is a new technical analysis tool designed to assist traders in identifying and confirming trends across multiple timeframes and multiple pairs at the same time. By combining the strengths of various timeframes, this indicator offers a comprehensive view of the market's direction, helping traders make more informed decisions. Features: Multi-Timeframe Analysis: The indicator analyzes trends on different timeframes (e.g., M1
Description:  For a comprehensive understanding of our indicators, we invite you to explore the entire Q&A section within this MQL5 blog post   here . The "High Spread Alert" Indicator is a valuable tool for traders, providing real-time information about spread fluctuations in the forex market. As a technical analysis tool, it helps traders make informed decisions by alerting them to periods of high spread, which can impact trading conditions and execution. Key Features: Spread Monitoring: The i
FREE
Description:  For a comprehensive understanding of our indicators, we invite you to explore the entire Q&A section within this MQL5 blog post   here . The "Currency Strength Meter Strategy" Indicator is a cutting-edge technical analysis tool that offers traders a unique perspective on the forex market. By analyzing the relative strength of different currencies, this indicator provides valuable insights into the market's dynamics, allowing traders to make informed decisions. Understanding Curren
Description:  For a comprehensive understanding of our indicators, we invite you to explore the entire Q&A section within this MQL5 blog post   here . The "Candlestick Pattern Finder with Alerts and Hide Button" is a sophisticated technical analysis tool designed to elevate your trading experience by identifying key candlestick patterns in the market. This powerful indicator offers valuable insights into price action, enabling you to make well-informed trading decisions. Unlock Candlestick Insi
Description:  For a comprehensive understanding of our indicators, we invite you to explore the entire Q&A section within this MQL5 blog post   here . The "MACD Crossover with Alert and Button" is a valuable technical analysis tool designed to help traders spot potential trend changes and trading opportunities in the market. This indicator provides essential insights into the market's momentum, enabling you to make well-informed trading decisions. Master the MACD Indicator: The Moving Average Co
Description:  For a comprehensive understanding of our indicators, we invite you to explore the entire Q&A section within this MQL5 blog post   here . The "Moving Average Lines Crossover with Alert" is a valuable technical analysis tool designed to help traders identify potential trend reversals and trading opportunities. Seamlessly integrated into your trading platform, this indicator empowers you with essential data to make well-informed trading decisions. Spot Trend Reversals: Utilize the po
Description:  For a comprehensive understanding of our indicators, we invite you to explore the entire Q&A section within this MQL5 blog post   here . The Moving Average Cross Price Alert Indicator is a technical tool designed to simplify your trading decisions. With a single moving average line, this indicator effectively identifies trend changes and potential trade opportunities. Its core function is to provide real-time alerts when the price crosses above or below the moving average line, sig
Filtrele:
amar Alalee
92
amar Alalee 2023.09.19 11:25 
 

Kullanıcı incelemeye herhangi bir yorum bırakmadı

Wayne Cloete
88
Wayne Cloete 2023.08.17 16:07 
 

Kullanıcı incelemeye herhangi bir yorum bırakmadı

Christiaan Wheeler
295
Christiaan Wheeler 2023.08.10 16:12 
 

Kullanıcı incelemeye herhangi bir yorum bırakmadı

Hello Momo
123
Hello Momo 2023.08.08 09:31 
 

Kullanıcı incelemeye herhangi bir yorum bırakmadı

SmokCzerwony1
317
SmokCzerwony1 2023.08.08 00:41 
 

Kullanıcı incelemeye herhangi bir yorum bırakmadı

Zdzislaw Wanke
114
Zdzislaw Wanke 2023.08.06 23:16 
 

Kullanıcı incelemeye herhangi bir yorum bırakmadı

Bandiusha
81
Bandiusha 2023.07.29 13:08 
 

Kullanıcı incelemeye herhangi bir yorum bırakmadı

Lemmertz
65
Lemmertz 2023.07.27 20:45 
 

Kullanıcı incelemeye herhangi bir yorum bırakmadı

smsr2033
139
smsr2033 2023.07.26 10:24 
 

Kullanıcı incelemeye herhangi bir yorum bırakmadı

WaqarFx
74
WaqarFx 2023.07.20 13:25 
 

Kullanıcı incelemeye herhangi bir yorum bırakmadı

asadbilly
76
asadbilly 2023.07.15 16:22 
 

Kullanıcı incelemeye herhangi bir yorum bırakmadı

Juergen Loebach
929
Juergen Loebach 2023.07.09 21:38 
 

Kullanıcı incelemeye herhangi bir yorum bırakmadı

IK°L
819
IK°L 2023.07.07 07:29 
 

Kullanıcı incelemeye herhangi bir yorum bırakmadı

Mlamuli Innocent
18
Mlamuli Innocent 2022.09.22 13:07 
 

Kullanıcı incelemeye herhangi bir yorum bırakmadı

İncelemeye yanıt
Sürüm 1.10 2022.06.23
Performance Optimization