ATR Fractal Swings
- Göstergeler
- Flavio Javier Jarabeck
- Sürüm: 1.0
- Etkinleştirmeler: 20
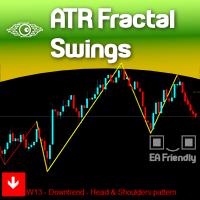
The concept of Fractals is everywhere in the respected Technical Analysis teaching and for a good reason: It Makes Sense! It is not a "self-fulfilling prophecy" like Fibonacci levels which we totally respect but we didn't explore yet, but this concept of Fractals can only be seen visually on your chart if we really SHOW that to you on your chart, right?
There are dozens of Zig-zag and Swing Legs indicators out there so you probably would be wondering: Why our indicator is different?
Because we are Minions Labs. We always bring you new ideas and Out of the Box thinking to let you earn the hard-to-gain: EDGE!
To begin with, ATR Fractal Swings is not based on fixed Ticks or Points crossover, it is based on the Average True Range (ATR) so it is totally adaptable to the market volatility conditions you are in. Real Volatility = Real Swings.
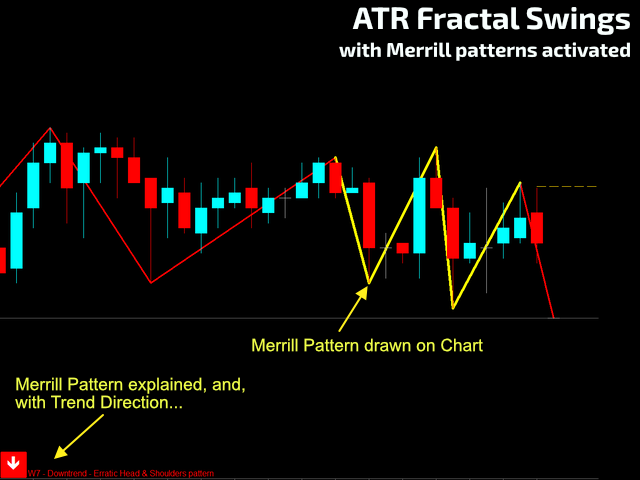
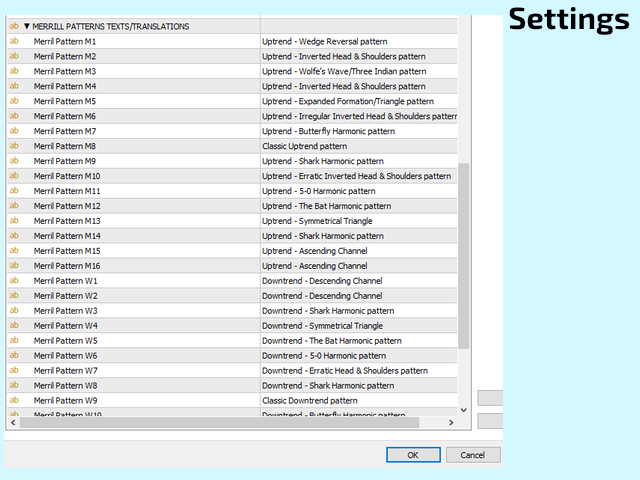
And the Plus: We added the famous Merrill Pattern Analysis to the swings so novice and intermediate traders can visually understand the Market Structure and where it is going... If you want to know more about the Merrill Patterns and want to dig deeper, Arthur A. Merrill (Merrill Analysis Inc.) published a paper in 1980 called "M&W Wave Patterns", which is a derivative work from Robert A. Levy (1971 - "Predictive Significance of Five Point Chart Patterns").
HOW TO READ THIS INDICATOR
- The basic Higher Highs and Higher Lows = Uptrend.
- The same for a Downtrend movement = Lower Highs and Lower Lows.
- But the market is not the same anymore, so we need more analysis than that... That's why we added the Merrill Patterns analysis.
- The higher the timeframe, the higher the accuracy.
- The Merrill Patterns Analysis will give you hints of probable directions. You have to use all your Price Action and Technical Analysis experience to sort out your trading decisions.
- This indicator can act as a trigger indicator depending on the timeframe and ATR leve you are using. Explore!
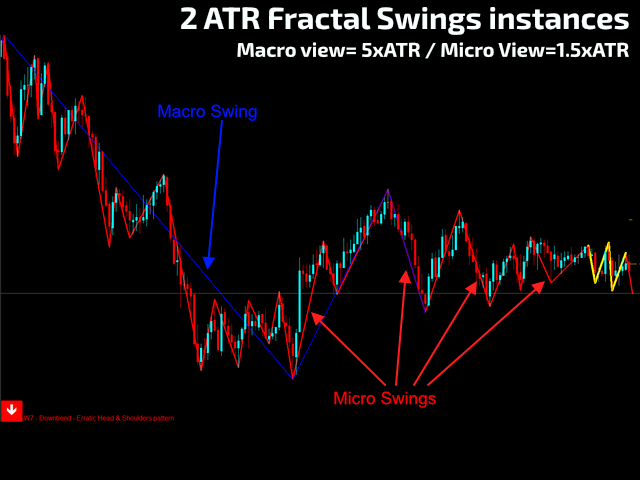
- Using higher ATR multipliers you will have the "big view" of the trend. You can use 2 instances of this indicator (one with a big ATR multiplier and another with a lower value) as a Fractal View of the trend!
SETTINGS
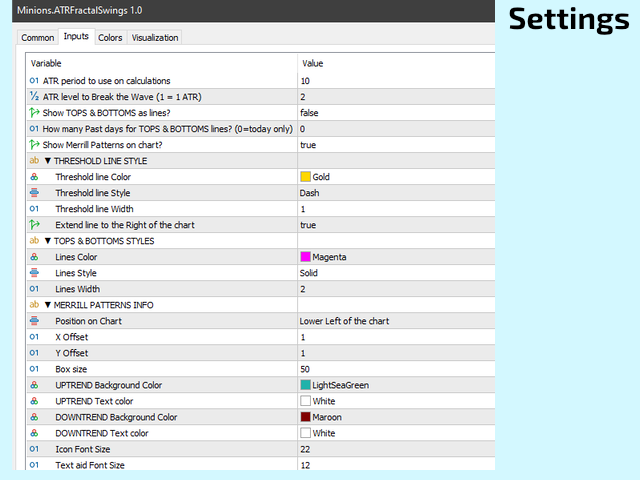
- ATR Period of analysis.
- ATR level to be considered a "Break" level.
- Show Tops & Bottoms lines formed by the swings?
- How many days back you will want to show the Tops & Bottoms?
- Show the Merrill Pattern Analysis on your chart?
- Styles & More Styles of everything in the interface! You know us, everything is totally flexible! Check out the video!
BUFFERS TO USE ON YOUR EA
- #0: ZigZag vertices (Price). Otherwise, 0 value.
- #1: Vertices Direction. Up=1 ; Down=-1
- #2: ATR data buffer.
- #3: Tops & Bottoms Price vertices. Just read this buffer backward for values >0.
- #4: Merrill patterns - holds the last 5 vertices drawn on the chart. Just read this buffer backward for values >0.
- #5: Merril Pattern Number: 1=M1; 2=M2; 3=M3; ... 16=M16; 17=W1; 18=W2; ... 32=W16.
- #6: Current wave/leg direction (last buffer element) - 1=UPTREND / 2=DOWNTREND.
- #7: Current to be reached for a new "leg" to be formed. Useful for Stop Loss positioning.
If you want to try this indicator for free on your REAL or DEMO account, read these instructions from our Blog: https://www.mql5.com/pt/blogs/post/749794 |
|---|
Didn't Find a Feature You Need?
No product is perfect for everyone. If you think you need a missing feature from our product just send us a message. We love feedback!
About Us
Flavio Jarabeck is the owner of MinionsLabs.com, an entrepreneurship focused on leveraging the knowledge and experience of professional traders through automated trading robots, freeing them to seek new opportunities and strategies in new markets and assets.
;)
