• Genel bakış
  • İncelemeler (5)
  • Yorumlar (6)
  • Yenilikler

LT Donchian Channel

4.75

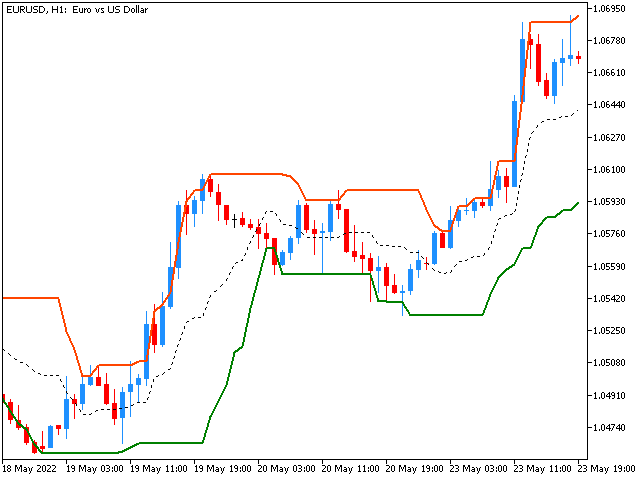
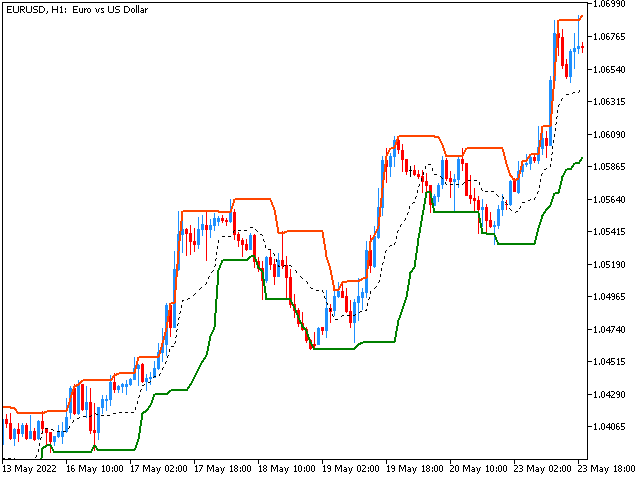
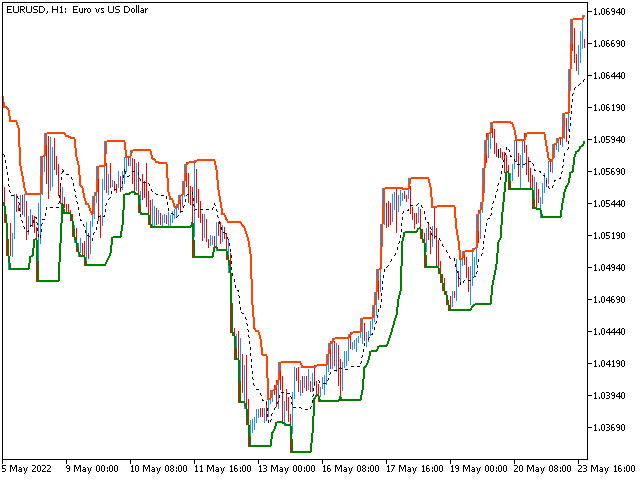
Donchian Channel is an indicator created by Richard Donchian. It is formed by taking the highest high and the lowest low of the last specified period in candles. The area between high and low is the channel for the chosen period.
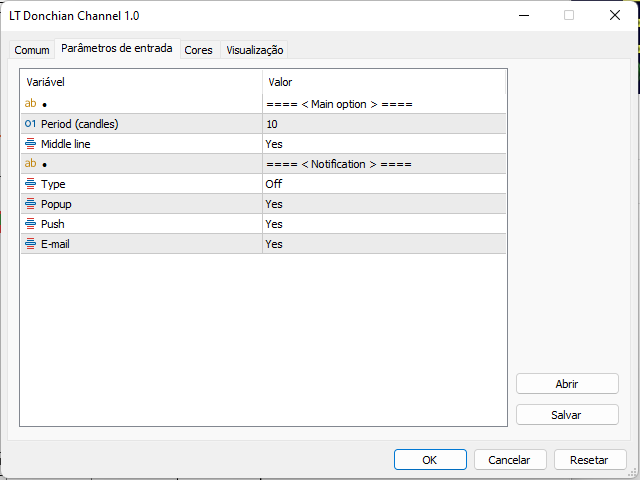
Its configuration is simple. It is possible to have the average between the upper and lower lines, plus you have alerts when price hits one side.

If you have any questions or find any bugs, please contact me.

Enjoy!

İncelemeler 5
Santanilla71
164
Santanilla71 2024.02.10 20:27 
 

gracias muy bueno

Marcel Matsuno
120
Marcel Matsuno 2023.10.07 06:36 
 

Bom 👍

Tom Birk
53
Tom Birk 2023.08.10 13:57 
 

Works Great! I use a 9 period on any time frame. Easy to read trend.

Önerilen ürünler
Follow The Line MT5
Oliver Gideon Amofa Appiah
4.42 (31)
This indicator obeys the popular maxim that: "THE TREND IS YOUR FRIEND" It paints a GREEN line for BUY and also paints a RED line for SELL. (you can change the colors). It gives alarms and alerts of all kinds. IT DOES NOT REPAINT and can be used for all currency pairs and timeframes. Yes, as easy and simple as that. Even a newbie can use it to make great and reliable trades. NB: For best results, get my other premium indicators for more powerful and reliable signals. Get them here: https://www.m
FREE
Important Lines
Terence Gronowski
4.88 (26)
This indicator displays Pivot-Lines, preday high and low, preday close and the minimum and maximum of the previous hour. You just have to put this single indicator to the chart to have all these important lines, no need to setup many single indicators. Why certain lines are important Preday high and low : These are watched by traders who trade in a daily chart. Very often, if price climbs over or falls under a preday low/high there is an acceleration in buying/selling. It is a breakout out of
FREE
Free automatic Fibonacci is an indicator that automatically plots a Fibonacci retracement based on the number of bars you select on the BarsToScan setting in the indicator. The Fibonacci is automatically updated in real time as new highest and lowest values appears amongst the selected bars. You can select which level values to be displayed in the indicator settings. You can also select the color of the levels thus enabling the trader to be able to attach the indicator several times with differe
FREE
Are you tired of drawing trendlines every time you're analyzing charts? Or perhaps you would like more consistency in your technical analysis. Then this is for you. This indicator will draw trend lines automatically when dropped on a chart. How it works Works similar to standard deviation channel found on mt4 and mt5. It has 2 parameters: 1. Starting Bar 2. Number of bars for calculation The   starting bar   is the bar which drawing of the trend lines will begin, while the   number of bars for c
FREE
Weis Waves
Flavio Javier Jarabeck
3.15 (26)
The original author is David Weis, an expert in the Wyckoff Method. The Weis Wave is a modern adaptation of the 1930's Wyckoff Method, another expert in Tape Reading techniques and Chart Analysis. Weis Waves takes market volume and stacks it into waves according to price conditions giving the trader valuable insights about the market conditions. If you want to learn more about this subject you can find tons of videos in YouTube. Just look for "The Wickoff Method", "Weis Wave" and "Volume Spread
FREE
Infinity'nin para birimlerinin gücünü ölçen bu yenilikçi gösterge, scalper'lar ve uzun vadeli ticaret yapan tüccarlar için vazgeçilmez bir yardımcıdır. Para birimlerinin Güç / zayıflık analiz sistemi uzun zamandır bilinmektedir ve dünyanın önde gelen tüccarları tarafından piyasada kullanılmaktadır. Herhangi bir arbitraj ticareti bu analiz olmadan tamamlanamaz. Göstergemiz, temel para birimlerinin birbirine göre gücünü kolayca belirler. Tüm para birimlerinde veya mevcut para birimlerinde çizgi g
FREE
PZ Penta O MT5
PZ TRADING SLU
4 (6)
The Penta-O is a 6-point retracement harmonacci pattern which usually precedes big market movements. Penta-O patterns can expand and repaint quite a bit. To make things easier this indicator implements a twist: it waits for a donchian breakout in the right direction before signaling the trade. The end result is an otherwise repainting indicator with a very reliable trading signal. The donchian breakout period is entered as an input. [ Installation Guide | Update Guide | Troubleshooting | FAQ | A
FREE
Pivot Point Fibo RSJ, Fibonacci oranlarını kullanarak günün destek ve direnç çizgilerini izleyen bir göstergedir. Bu muhteşem gösterge, Fibonacci oranlarını kullanarak Pivot Point üzerinden 7 seviyeye kadar destek ve direnç oluşturur. Fiyatların, bir operasyonun olası giriş/çıkış noktalarını algılamanın mümkün olduğu bu destek ve direncin her bir düzeyine uyması harika. Özellikleri 7 seviyeye kadar destek ve 7 seviye direnç Seviyelerin renklerini ayrı ayrı ayarlayın Girişler Pivot Tipi
FREE
Rainbow MT5
Jamal El Alama
4.33 (3)
Description : Rainbow MT5 is a technical indicator based on Moving Average with period 34 and very easy to use. When price crosses above MA and MA changes color to green, then this is a signal to buy. When price crosses below MA and MA changes color to red, then this is a signal to sell. The Expert advisor ( Rainbow EA MT5 ) based on Rainbow MT5 indicator is now available here . MT4 version is available here .
FREE
This indicator is especially for the binary trading. Time frame is 1 minutes and exp time 5 or 3 minutes only. You must be use martingale 3 step. So you must put lots size is 10 % at most. You should use Mt2 trading platform to connect with my indicator to get more signal without human working. This indicator wining rate is over 80% but you may get 100% of profit by using martingale 3 step. You should use MT2 Trading Platform to connect meta trader platform and binary platform . You can get mt2
FREE
Tabajara V5
Flavio Javier Jarabeck
4.88 (41)
Metatrader 5 version of the famous Andre Machado's Tabajara indicator. If you don't know Andre Machado's Technical Analysis work you don't need this indicator... For those who need it and for those several friend traders who asked this porting from other platforms, here it is... FEATURES 8-period Moving Average 20-period Moving Average 50-period Moving Average 200-period Moving Average Colored candles according to the inflexion of the 20-period MA SETTINGS You can change the Period of all M
FREE
Dual RSI
Paul Conrad Carlson
Indicator alerts for Dual Relative strength index rsi. Large rsi preset at 14 is below 30 small rsi preset at 4 is below 10 for buy bullish signals . Large rsi preset are 14 is above 70 small rsi preset at 4 is above 90 for sell bearish signals . Includes mobile and terminal alerts. draws lines when alerts. This indicator can help identify extremes and then the tops or bottoms of those extremes .
FREE
This is a buyer and seller aggression indicator that analyzes the shape of each candle and project this data in a histogram form. There are 4 histograms in one. On the front we have two: Upper - Buyer force. Lower - Seller force. At the background we also have two histogram, both with same color. They measure the combined strenght of buyers and sellers. This histograms can be turned off in Input Parameters. It is also possible to have the real or tick volume to help on this force measurement. IN
FREE
The idea of the system is to indentify the reversal patterns using the calculation of the composite candle. The reversal patterns is similar to the "Hammer" and "Hanging Man" patterns in Japanese candlestick analysis. But it uses the composite candle instead the single candle and doesn't need the small body of the composite candle to confirm the reversal. Input parameters: Range - maximal number of bars, used in the calculation of the composite candle. Minimum - minimal size of the composite can
FREE
Mitimom
Danil Poletavkin
The indicator is based on Robert Miner's methodology described in his book "High probability trading strategies" and displays signals along with momentum of 2 timeframes. A Stochastic oscillator is used as a momentum indicator. The settings speak for themselves period_1 is the current timeframe, 'current' period_2 is indicated - the senior timeframe is 4 or 5 times larger than the current one. For example, if the current one is 5 minutes, then the older one will be 20 minutes The rest of the
FREE
Pivot MT5
Dmitrij Isaenko
5 (1)
The indicator draws daily support and resistance lines on the chart, as well as the Pivot level (reversal level). Adapted to work in MT5 The standard timeframe for calculating support and resistance levels is D1. You can choose other timeframes according to your strategy (for example, for M1-M15, the optimal timeframe for calculations is H1) The function for calculating support and resistance levels has been updated; in this calculation option, fibonacci levels are taken into account, res
FREE
Value Chart Candlesticks
Flavio Javier Jarabeck
4.67 (9)
The idea of a Value Chart indicator was presented in the very good book I read back in 2020 , " Dynamic Trading Indicators: Winning with Value Charts and Price Action Profile ", from the authors Mark Helweg and David Stendahl. The idea is simple and the result is pure genius: Present candlestick Price analysis in a detrended way! HOW TO READ THIS INDICATOR Look for Overbought and Oversold levels. Of course, you will need to test the settings a lot to find the "correct" one for your approach.
FREE
The indicator identifies when a divergence occurs between price and an indicator or oscillator. It identifies both regular and hidden divergences. Combined with your own rules and techniques, this indicator will allow you to create (or enhance) your own powerful system. Features Can detect divergences for the following oscillators/indicators:   MACD, OsMA, Stochastics, RSI, CCI, RVI, Awesome, ADX, ATR, OBV, Composite index, MFI and Momentum. Only one oscillator/indicator can be selected. Draws
FREE
Bar Color Trend
Germano Chagas
4.5 (10)
Combining the best of Price Action , Directional Movement , and Divergence/Convergence analysis, Candle Color Trend is a easy and reliable way to identify trend direction. The indicator automatically paints the candles according to the assumption that an uptrend is defined by prices that form a series of higher highs and higher lows. In contrast, a downtrend is defined by prices that form a series of lower highs and lower lows. Additionally, ADX Wilder indicator is used to measure trend weakness
FREE
Automatic Trendlines
Pasi Hakamaki
4.65 (51)
The indicator draws trendlines on chart. This indicator has six inputs. User can specify alternative labels for both lines. If multiple instances of the indicator are used, the labels must differ. User can set width and color of the lines and depth which specifies what significant peaks should be used. For example, Depth=10 sets trendlines using the current peaks and valleys that have at least 10 bars to the right and to the left and that have highs/lows less/greater than the peak's high/low. In
FREE
Trend Yakalayıcı: Alarm İndikatörü ile Trend Yakalayıcı Stratejisi, piyasa trendlerini ve potansiyel giriş ve çıkış noktalarını belirlemede yardımcı olan çok yönlü bir teknik analiz aracıdır. Piyasa koşullarına uyum sağlayarak trend yönünün net görsel temsili için dinamik bir Trend Yakalayıcı Stratejisi sunar. Tüccarlar tercihlerine ve risk toleranslarına göre parametreleri özelleştirebilirler. Gösterge, trendleri tanımlamaya yardımcı olur, potansiyel ters dönüşleri sinyaller, trailing stop m
FREE
Donchian Pro
Paulo Henrique Faquineli Garcia
5 (2)
The Donchian Channel Channels are among the most popular tools of technical analysis, as they visually convey to the analyst the limits within which most price movement tends to occur. Channel users know that valuable information can be obtained at any time, whether prices are in the central region of a band or close to one of the border lines. One of the best known techniques to explore these concepts is Bollinger Bands. However, John Bollinger was not the only one to research the applicatio
FREE
High Low Open Close
Alexandre Borela
4.97 (39)
Bu projeyi seviyorsanız, 5 yıldız incelemesi bırakın. instagram'da izleyin: borelatech Bu gösterge açık, yüksek, düşük ve belirtilen fiyatlar için çizer Dönem ve belirli bir zaman bölgesi için ayarlanabilir. Bunlar birçok kurumsal ve profesyonel tarafından görünen önemli seviyelerdir. tüccarlar ve daha fazla olabileceği yerleri bilmeniz için yararlı olabilir Aktif. Mevcut dönemler şunlardır: Önceki gün. Önceki Hafta. Önceki Ay. Previous Quarter. Önceki yıl. Veya: Mevcut gün. Hafta. Şimdi Ay.
FREE
MIDAS Super VWAP
Flavio Javier Jarabeck
4.29 (14)
Imagine VWAP, MVWAP and MIDAS in one place... Well, you found it! Now you can track the movement of Big Players in various ways, as they in general pursue the benchmarks related to this measuring, gauging if they had good execution or poor execution on their orders. Traders and analysts use the VWAP to eliminate the noise that occurs throughout the day, so they can measure what prices buyers and sellers are really trading. VWAP gives traders insight into how a stock trades for that day and deter
FREE
Bollinger Bands B
Flavio Javier Jarabeck
5 (3)
John Bollinger created this indicator in 2010 as a way to read the original indicator (Bollinger Bands) in a more "technical" way, shown as an oscillator. The typical range of the Bollinger Bands %B is 0 - 0.5 - 1.0, where "0" represents the lower band, the "0.5" the middle band, and "1" the upper band. The line on the indicator represents the Closing prices. As simple as that. SETTINGS Bollinger Bands period of analysis Standard Deviation multiplier Shift Price type to be analyzed If you
FREE
Cumulative Delta MT5
Evgeny Shevtsov
4.5 (60)
The indicator analyzes the volume scale and splits it into two components - seller volumes and buyer volumes, and also calculates the delta and cumulative delta. The indicator does not flicker or redraw, its calculation and plotting are performed fairly quickly, while using the data from the smaller (relative to the current) periods. The indicator operation modes can be switched using the Mode input variable: Buy - display only the buyer volumes. Sell - display only the seller volumes. BuySell -
FREE
The Scaled Awesome Oscillator (SAO) represents a refined adaptation of the Awesome Oscillator, aimed at establishing consistent benchmarks for identifying market edges. Unlike the standard Awesome Oscillator, which records the variation in pips across different commodities, the only unchanging reference point is the zero line. This limitation hampers investors and traders from pinpointing specific levels for trend reversals or continuations using the traditional Awesome Indicator, a creation of
FREE
Aggression Volume
Flavio Javier Jarabeck
3.86 (21)
Aggression Volume Indicator is the kind of indicator that is rarely found in the MQL5 community because it is not based on the standard Volume data provided by the Metatrader 5 platform. It requires the scrutiny of all traffic Ticks requested on the platform... That said, Aggression Volume indicator requests all Tick Data from your Broker and processes it to build a very special version of a Volume Indicator, where Buyers and Sellers aggressions are plotted in a form of Histogram. Additionally,
FREE
Donchian Channel DC is the indicator of Donchian Channels, that plots maximum and minimum values of a specific period, besides mean value line. It´s possible to configure simple period for analysis and the indicator will plot all three values. You can trade with this indicator as trend or reversal, according to each strategy. Do not let to test others indicators as soon as others expert advisors.
Expansoes M
Marcus Vinicius Da Silva Miranda
The M Extensions are variations of the Golden Ratio (Fibonacci Sequence). It is the World's first technique developed for Candle Projections. Advantages: Easy to plot. Candle anchoring; High and accurate precision as support and resistance; Excellent Risk x Return ratio; Works in any timeframe; Works in any asset / market.   The M Extensions are classified into: M0: Zero point (starting candle) RC: Initial candle control region M1: Extension region 1 M2: Extension region 2 M3: Extension r
FREE
Bu ürünün alıcıları ayrıca şunları da satın alıyor
Öncelikle belirtmek gerekir ki bu Ticaret Göstergesi Yeniden Çizim Yapmaz, Gecikmez ve Gecikme Göstermez, bu da hem manuel hem de robot ticareti için ideal hale getirir. Kullanıcı kılavuzu: ayarlar, girişler ve strateji. Atom Analisti, Piyasada Daha İyi Bir Avantaj Bulmak İçin Fiyatın Gücünü ve Momentumunu Kullanan PA Fiyat Hareketi Göstergesidir. Gürültüleri ve Yanlış Sinyalleri Kaldırmaya ve Ticaret Potansiyelini Artırmaya Yardımcı Olan Gelişmiş Filtrelerle Donatılmıştır. Birden fazla katmanl
Öncelikle, bu Ticaret Sistemi'nin Non-Repainting, Non-Redrawing ve Non-Lagging Göstergesi olduğunu vurgulamak önemlidir, bu da hem manuel hem de robot ticareti için ideal hale getirir. Online kurs, kılavuz ve ön ayarları indir. "Smart Trend Trading System MT5", yeni ve deneyimli tüccarlar için özelleştirilmiş kapsamlı bir ticaret çözümüdür. 10'dan fazla premium göstergeyi birleştiriyor ve 7'den fazla sağlam ticaret stratejisi sunuyor, bu da çeşitli piyasa koşulları için esnek bir seçim yapar. Tr
FX Power MT5 NG
Daniel Stein
5 (5)
Sabah Brifingimiz burada mql5 ve on Telegram! FX Power MT5 NG , uzun zamandır çok popüler olan döviz gücü ölçerimiz FX Power'ın yeni neslidir. Peki bu yeni nesil güç ölçer ne sunuyor? Orijinal FX Power hakkında sevdiğiniz her şey PLUS GOLD/XAU güç analizi Daha da hassas hesaplama sonuçları Ayrı ayrı yapılandırılabilir analiz dönemleri Daha da iyi performans için özelleştirilebilir hesaplama limiti Özel çokluDaha fazlasını görmek isteyenler için örnek ayarlar Her grafikte en sevdiğiniz renkler i
Quantum Trend Sniper
Bogdan Ion Puscasu
4.91 (43)
Tanıtım       Kuantum Trend Keskin Nişancı Göstergesi   , trend tersine dönmeleri belirleme ve ticaret yapma şeklinizi değiştiren çığır açan MQL5 Göstergesi! 13 yılı aşkın ticaret tecrübesine sahip deneyimli tüccarlardan oluşan bir ekip tarafından geliştirilmiştir.       Kuantum Trend Keskin Nişancı Göstergesi       trend dönüşlerini son derece yüksek doğrulukla belirlemenin yenilikçi yolu ile ticaret yolculuğunuzu yeni zirvelere taşımak için tasarlanmıştır. ***Kuantum Trend Keskin Nişancı Gö
Reversal First Impulse levels (RFI)      INSTRUCTIONS        RUS       -       ENG              R ecommended to use with an indicator   -   TREND PRO -  Version MT4                 A key element in trading is zones or levels from which decisions to buy or sell a trading instrument are made. Despite attempts by major players to conceal their presence in the market, they inevitably leave traces. Our task was to learn how to identify these traces and interpret them correctly. Main functions:: Di
Trend Screener Pro MT5
STE S.S.COMPANY
4.88 (64)
Trend Göstergesi, Trend Alım Satım ve Filtreleme için Çığır Açan Benzersiz Çözüm, Tüm Önemli Trend Özellikleriyle Tek Bir Araç İçinde Yerleştirildi! Forex, emtialar, kripto para birimleri, endeksler ve hisse senetleri gibi tüm sembollerde/araçlarda kullanılabilen %100 yeniden boyamayan çoklu zaman çerçevesi ve Çoklu para birimi göstergesidir. Trend Screener, grafikte noktalarla ok trend sinyalleri sağlayan etkili bir trend trend göstergesidir. Trend analizörü göstergesinde bulunan özellikler: 1.
Öncelikle, bu Ticaret Aracının Non-Repainting, Non-Redrawing ve Non-Lagging Gösterge olduğunu vurgulamakta fayda var, bu da onu profesyonel ticaret için ideal hale getiriyor. Çevrimiçi kurs, kullanıcı kılavuzu ve demo. Akıllı Fiyat Hareketi Kavramları Göstergesi, hem yeni hem de deneyimli tüccarlar için çok güçlü bir araçtır. İleri ticaret fikirlerini, Inner Circle Trader Analizi ve Smart Money Concepts Ticaret Stratejileri gibi 20'den fazla kullanışlı göstergeyi bir araya getirerek bir aray
Gold Stuff mt5
Vasiliy Strukov
4.89 (178)
Gold Stuff mt5, özellikle altın için tasarlanmış bir trend göstergesidir ve herhangi bir finansal enstrümanda da kullanılabilir. Gösterge yeniden çizilmez ve gecikmez. Önerilen zaman dilimi H1. Ayarları ve kişisel bir bonusu almak için satın alma işleminden hemen sonra benimle iletişime geçin!  Güçlü Destek ve Trend Tarayıcı göstergemizin ücretsiz bir kopyasını pm'den alabilirsiniz. Ben!   AYARLAR Ok Çiz - açık kapalı. grafik üzerinde oklar çizmek. Uyarılar - sesli uyarılar kapalı. E-post
FX Volume MT5
Daniel Stein
4.94 (17)
Sabah Brifingimiz aracılığıyla ayrıntılar ve ekran görüntüleri ile günlük piyasa güncellemenizi alın burada mql5 ve on Telegram ! FX Volume, bir brokerin bakış açısından piyasa duyarlılığı hakkında GERÇEK bir fikir veren İLK ve TEK hacim göstergesidir. COT raporlarından çok daha hızlı bir şekilde, brokerlar gibi kurumsal piyasa katılımcılarının Forex piyasasında nasıl konumlandıklarına dair harika bilgiler sağlar. Bu bilgileri doğrudan grafiğinizde görmek, ticaretiniz için gerçek oyun değiştir
TPSproTREND PrO MT5
Roman Podpora
4.88 (8)
TPSpro TRENDPRO  - is a trend indicator that automatically analyzes the market and provides information about the trend and each of its changes, as well as giving signals for entering trades without redrawing! The indicator uses each candle, analyzing them separately. referring to different impulses - up or down impulse. Exact entry points into transactions for currencies, crypto, metals, stocks, indices!  -  Version MT4               DETAILED DESCRIPTION               R ecommended to use with
FxaccurateLS
Shiv Raj Kumawat
WHY IS OUR FXACCCURATE LS MT5 THE PROFITABLE ? PROTECT YOUR CAPITAL WITH RISK MANAGEMENT Gives entry, stop and target levels from time to time. It finds Trading opportunities by analyzing what the price is doing during established trends. POWERFUL INDICATOR FOR A RELIABLE STRATEGIES We have made these indicators with a lot of years of hard work. It is made at a very advanced level. Established trends provide dozens of trading opportunities, but most trend indicators completely ignore them!
The Volume by Price Indicator for MetaTrader 5 features Volume Profile and Market Profile TPO (Time Price Opportunity). Volume and TPO histogram bar and line charts. Volume Footprint charts. TPO letter and block marker collapsed and split structure charts. Session filtering and grouping. Static, dynamic and flexible range segmentation and compositing methods with relative and absolute visualizations. Graphical layering, positioning and styling options to suit the user's analytic and aesthetic n
AW Trend Predictor MT5
AW Trading Software Limited
4.78 (58)
Tek bir sistemde trend ve kırılma seviyelerinin kombinasyonu. Gelişmiş bir gösterge algoritması piyasa gürültüsünü filtreler, trendi, giriş noktalarını ve olası çıkış seviyelerini belirler. Gösterge sinyalleri, sinyal geçmişinin etkinliğini gösteren en uygun enstrümanların seçilmesine izin veren bir istatistiksel modüle kaydedilir. Gösterge Kâr Al ve Zararı Durdur işaretlerini hesaplar. Kılavuz ve talimatlar ->   BURAYA   / MT4 versiyonu ->   BURAYA Gösterge ile nasıl ticaret yapılır: Trend Pre
ICT, SMC, SMART MONEY CONCEPTS, SMART MONEY, Smart Money Concept, Support and Resistance, Trend Analysis, Price Action, Market Structure, Order Blocks, BOS/CHoCH,   Breaker Blocks ,  Momentum Shift,   Supply&Demand Zone/Order Blocks , Strong Imbalance,   HH/LL/HL/LH,    Fair Value Gap, FVG,  Premium  &   Discount   Zones, Fibonacci Retracement, OTE, Buy Side Liquidity, Sell Side Liquidity, BSL/SSL Taken, Equal Highs & Lows, MTF Dashboard, Multiple Time Frame, BigBar, HTF OB, HTF Market Structure
Quantum Heiken Ashi PRO MT5
Bogdan Ion Puscasu
4.5 (8)
Quantum Heiken Ashi PRO ile   tanışın Pazar eğilimleri hakkında net bilgiler sağlamak üzere tasarlanan Heiken Ashi mumları, gürültüyü filtreleme ve yanlış sinyalleri ortadan kaldırma yetenekleriyle ünlüdür. Kafa karıştırıcı fiyat dalgalanmalarına veda edin ve daha sorunsuz, daha güvenilir bir grafik sunumuna merhaba deyin. Quantum Heiken Ashi PRO'yu gerçekten benzersiz kılan şey, geleneksel şamdan verilerini okunması kolay renkli çubuklara dönüştüren yenilikçi formülüdür. Kırmızı ve yeşil çubukl
Easy By Sell is a market indicator for opening and closing positions. It becomes easy to track market entries with alerts. It indicates trend reversal points when a price reaches extreme values ​​and the most favorable time to enter the market. it is as effective as a Fibonacci to find a level but it uses different tools such as an algorithm based on ATR indicators and Stochastic Oscillator. You can modify these two parameters as you wish to adapt the settings to the desired period. My othe
Legacy of Gann for MT5
Pavel Zamoshnikov
5 (6)
The indicator very accurately determines the levels of the possible end of the trend and profit fixing. The method of determining levels is based on the ideas of W.D.Gann, using an algorithm developed by his follower Kirill Borovsky. Extremely high reliability of reaching levels (according to K. Borovsky  - 80-90%) Indispensable for any trading strategy – every trader needs to determine the exit point from the market! Precisely determines targets on any timeframes and any instruments (forex, met
"Piranha" - an autonomous trading system that determines overbought and oversold levels on the chart. Red and blue zones represent overbought and oversold levels respectively. Entry points are marked with arrows: a downward arrow in the red zone for "sell" and an upward arrow in the blue zone for "buy". The Take profit level is indicated by the green moving average. Key features: Adjusting the Take profit level as the green moving average changes position. Averaging ability when a new market e
Fiyat tersine döndükçe ve geri çekildikçe piyasa yapısından elde edilen kâr değişir. Piyasa yapısını tersine çevirme uyarısı göstergesi, bir trendin veya fiyat hareketinin ne zaman tükenmeye yaklaştığını ve tersine dönmeye hazır olduğunu tanımlar. Genellikle bir geri dönüş veya büyük bir geri çekilme meydana gelmek üzereyken meydana gelen piyasa yapısındaki değişiklikler konusunda sizi uyarır. Gösterge, olası bir tükenme noktasının yakınında her yeni yüksek veya düşük oluştuğunda, başlangıçta
Top indicator for MT5   providing accurate signals to enter a trade without repainting! It can be applied to any financial assets:   forex, cryptocurrencies, metals, stocks, indices .  Watch  the video  (6:22) with an example of processing only one signal that paid off the indicator! MT4 version is here It will provide pretty accurate trading signals and tell you when it's best to open a trade and close it. Most traders improve their trading results during the first trading week with the help of
IX Power MT5
Daniel Stein
5 (3)
IX Power   nihayet FX Power'ın rakipsiz hassasiyetini Forex dışı sembollere getiriyor. En sevdiğiniz endeksler, hisse senetleri, emtialar, ETF'ler ve hatta kripto para birimlerindeki kısa, orta ve uzun vadeli eğilimlerin yoğunluğunu doğru bir şekilde belirler. Terminalinizin sunduğu   her şeyi analiz   edebilirsiniz. Deneyin ve işlem yaparken   zamanlamanızın   nasıl   önemli ölçüde iyileştiğini   deneyimleyin. IX Power Temel Özellikler 100 hassas, yeniden boyanmayan hesaplama sonuçları -
Bill Williams Advanced
Siarhei Vashchylka
5 (5)
Bill Williams Advanced is designed for automatic chart analysis using Bill Williams' "Profitunity" system. The indicator analyzes four timeframes at once. Manual (Be sure to read before purchasing) Advantages 1. Automatically analyzes the chart using the "Profitunity" system of Bill Williams. The found signals are placed in a table in the corner of the screen. 2. Equipped with a trend filter based on the Alligator indicator. Most of the system signals are recommended to be used only accordi
TPA True Price Action indicator reveals the true price action of the market makers through 100% non-repainting signals strictly at the close of a candle! TPA shows entries and re-entries, every time the bulls are definitely stronger than the bears and vice versa. Not to confuse with red/green candles. The shift of power gets confirmed at the earliest stage and is ONE exit strategy of several. There are available now two free parts of the TPA User Guide for our customers. The first "The Basics"
** All Symbols x All Timeframes scan just by pressing scanner button ** ***Contact me after purchase to send you instructions and add you in "123 scanner group" for sharing or seeing experiences with other users. After 17 years of experience in the markets and programming, Winner indicator is ready. I would like to share with you! Introduction The 123 Pattern Scanner indicator with a special enhanced algorithm is a very repetitive common pattern finder with a high success rate . Interestingly,
Yeni Başlayanlar veya Uzman Tüccarlar için En İyi Çözüm! Bu Gösterge benzersiz, yüksek kaliteli ve uygun fiyatlı bir ticaret aracıdır çünkü bir dizi tescilli özellik ve yeni bir formül ekledik. Sadece BİR grafik ile 28 Forex çifti için Döviz Gücünü okuyabilirsiniz! Yeni bir trendin veya scalping fırsatının tam tetik noktasını belirleyebildiğiniz için ticaretinizin nasıl gelişeceğini hayal edin? Kullanım kılavuzu:   buraya tıklayın Bu ilk olan, orijinal! Değersiz bir özenti klonunu almayın
Bu gösterge paneli, seçilen semboller için mevcut en son   harmonik kalıpları   gösterir, böylece zamandan tasarruf edersiniz ve daha verimli olursunuz /   MT4 sürümü . Ücretsiz Gösterge:   Basic Harmonic Pattern Gösterge sütunları Symbol :   seçilen semboller görünecektir Trend:   yükseliş veya düşüş Pattern :   desen türü (gartley, kelebek, yarasa, yengeç, köpekbalığı, cypher veya ABCD) Entry :   giriş fiyatı SL:   zararı durdur fiyatı TP1:   1. kar alma fiyatı TP2:   2. kar alma fiyatı
Yeni Nesil Otomatik Arz ve Talep Bölgeleri. Her Grafikte Çalışan Yeni ve Yenilikçi Algoritma. Tüm Bölgeler Piyasanın Fiyat Hareketine Göre Dinamik Olarak Oluşturulmaktadır. İKİ TÜR UYARI --> 1) FİYAT BİR BÖLGEYE ÇIKTIĞINDA 2) YENİ BİR BÖLGE OLUŞTURDUĞUNDA Bir tane daha işe yaramaz gösterge almazsın. Kanıtlanmış Sonuçlarla eksiksiz bir Ticaret Stratejisi elde edersiniz.     Yeni özellikler:     Fiyat Arz/Talep Bölgesine ulaştığında uyarılar     Yeni bir Arz/Talep Bölgesi olu
AW Prime Oscillator MT5
AW Trading Software Limited
İki osilatörün birleşimi. Birincisi giriş noktalarını, ikincisi ise mevcut trendi gösterir. Gösterge, osilatör sinyallerini iki modda oklarla görüntüleyebilir; tüm hızlı osilatör sinyalleri veya yalnızca mevcut trend yönündeki sinyaller. Çok zaman dilimli bir panele ve üç tür sinyal bildirimine sahiptir. Faydalar: Günlük ve scalping ticaretine uygundur Trend filtreleme Basit ve hassas kurulum Çoklu zaman dilimi paneli Bir danışmana entegrasyona uygundur. Herhangi bir sembol ve herhangi bir zaman
Owl Smart Levels MT5
Sergey Ermolov
4.38 (37)
MT4 versiyonu  |  FAQ Owl Smart Levels Indicator , Bill Williams'ın gelişmiş fraktalları , piyasanın doğru dalga yapısını oluşturan Valable ZigZag ve kesin giriş seviyelerini gösteren Fibonacci seviyeleri gibi popüler piyasa analiz araçlarını içeren tek gösterge içinde eksiksiz bir ticaret sistemidir. pazara ve kar elde edilecek yerlere. Stratejinin ayrıntılı açıklaması Gösterge ile çalışma talimatı Baykuş Yardımcısı ticaretinde Danışman Yardımcısı Kullanıcıların özel sohbeti -> Satın aldıktan
ADR Ters Çevirme Göstergesi, normal ortalama günlük aralığına göre fiyatın şu anda nerede işlem gördüğünü bir bakışta size gösterir. Fiyat, ortalama aralığı ve seçtiğiniz seviyenin üzerindeki seviyeleri aştığında, açılır pencere, e-posta veya push yoluyla anında uyarılar alacaksınız, böylece hızlı bir şekilde geri çekilmelere ve geri dönüşlere atlayabilirsiniz. Gösterge, grafikte ortalama günlük aralık uç noktalarında yatay çizgiler ve ayrıca fiyatları aşan matematiksel olasılıkları olan seviye
Yazarın diğer ürünleri
Trade Copy is an EA-shaped tool that replicates the trades done on a Meta Trader 5 to all Meta Traders 5 opened on same computer. Is useful if you want to trade more than once account yours or if you want to work with third party account management. Demo version:  https://www.mql5.com/pt/market/product/40906 MT4 version:  https://www.mql5.com/pt/market/product/40902/ Configurations: MAIN OPTIONS Idiom - change to English or Portuguese. Copy trades from - specify if the trades will be copied fro
LT Easy Trade Manager is a tool in EA type that makes operation more intuitive. As in other programs, Meta Trader lacks graphical information, even though it is an excellent program. With that in mind we have created this tool. It makes it easy to view the entry point, Take Profit and Stop Loss, as well as the floating profit from operation. It also automatically corrects the SL and TP price (optional) and highlights the price and opening time of the operation (optional). Plus, you can close par
FREE
This indicator draw a watermark on the chart, with the timeframe and symbol name. You can change everything, including add a aditional watermark. Functions: Symbol watermark: Size -  text size. Font -  text font. Color -  text color. Background text -  watermark at foreground or background mode. Horizontal correction -  x correction in pixels. Vertical correction -  y correction in pixels. Separator period X symbol -  what will separate the period from symbol. Aditional watermark: Enable custom
FREE
LT Volume
Thiago Duarte
4.69 (13)
This is a conventional volume indicator, which displays the ticks or real volume (if available from your broker). But it has others features like: 5 color schemes: single, when crossing with moving average, when crossing a specific level, when having different volume between bars and when candle change color. Being hable to have a customizable moving average. Being hable to have a value indicator line. Many thanks to  Diego Silvestrin  for the ideas to version 1.1 and   Konstantin Demidov   for
FREE
Do you like Meta Trader? Nice, me too. Have you missed one or more features that could exist in it? Me too. Annoyed by this, I decided to create the Trade Panel. This tool has two versions: Lite and Pro. It is literally magical!  It expands, and a lot, the possibilities of your Meta Trader! It ceases to be a good program and becomes excellent! Do you doubt? It is okay. Buy and see for yourself ;) One warning: you will love it! Lite version (free):   https://www.mql5.com/en/market/product/40410 A
Round numbers (or key levels) is an amazing strategy. These numbers are strong support and resistance levels. So what this indicator does is draw horizontal lines on the chart to help you find these levels. Configurations: Key levels in pips - distance between the lines. Color -   lines color. Style -   lines style. Width -  lines width. Display at background -  draw lines in front or back of candles. Selectable -  turn on or off the option to select the lines. Lines identification -  identifica
FREE
Have you missed any tools or shortcuts in Meta Trader? Simple things that would make your daily trading much easier ? We have the solution for you: our Trade Panel! This is an EA tool (Expert Advisor) that, if configured to controll all symbols, needs to be loaded only once. This is the Lite version (free) of our tool. Professional version:   https://www.mql5.com/en/market/product/42658 If you have some problemas with the shortcut buttons on chart on unpinned mode try change the tickets d
FREE
LT Day High Low
Thiago Duarte
4.59 (27)
This indicator draw a line on high and low levels of X number of days. It is possible to have an alert (in the software and mobile app) for when the price breaks the high or low of the current day. Configurações: Days -   past days to calculate (1 = actual day only). Alert when reach levels -   activate the alert for specific levels or both. Push notification -   enable the alert to the mobile MT5 app. Appearance High -   high level color. Low -   low level color. Size actual day -   thi
FREE
Simple indicator that draws the market hours on chart (broker, local and GMT). Functions: Horizontal distance - from border. Vertical distance - from border. Color - text color. Font - text font. Size - text size. Corner - which chart corner will be drawn. Show seconds - show or hide seconds. Draw as background - candles front or back. Label local - text before local time. Label broker - text before broker time. Label GMT - text before GMT time. Separator - separator between label and time Objec
FREE
RSI with Moving Average
Thiago Duarte
4.87 (15)
RSI with moving average is great to see when the price is overbought and oversold instead of RSI only. INPU T PARAME TERS : RSI: Period - RSI period. Price - RSI applied price. Color scheme - RSI color scheme (4 available). MOVING AVERAGE: Period - MA period. Type - MA  type. Apply - MA applica tion. Shift - MA shif t (correc tion). PRICE LINE: Show - specify if line with price, only line or nothing. Style - line style. OTHER: Overbought level - specify  the level . Overboug
FREE
LT Weis Waves
Thiago Duarte
5 (11)
The Weis Wave first takes the market volume and then organizes it with the price into Wave charts. It is the only software that will present the true picture of the market before you. If anyone of you, has watched an intraday price movement then you must know that it unfolds in a series of selling as well as buying waves-a procedures tearing down and building up. Wave analysis is an integral part of the trading method. The indicator helps to deal with today’s volatile market. Moreover, it works
FREE
This indicator show the candle remaining time on the chart and/or in the corner of the window. It also display notificaton (popup and push) when a new candle is formed (optional). You configure the timer on candles and at chart corner. I don't need to explain the functions because are very simple. MT5 version:  https://www.mql5.com/pt/market/product/38470 Any doubt or suggestion to a new feature please comment. Enjoy!
FREE
LT Force
Thiago Duarte
5 (6)
For those who like trend the Force will be a very useful indicator. This is because it is based on the famouse ADX, which measure the strenght of a trend, but without its 3 confusing lines. Force has its very simple interpretation: if the histogram is above zero level the trend is up, otherwise it is down. You can use it to find divergences too, which is very profitable. Thanks to Andre Sens for the version 1.1 idea. If you have any doubt or suggestion, please, contact me. Enjoy! This is a fre
FREE
This indicator show the candle remaining time on the chart and/or in the corner of the window. It also display notificaton (popup and push) when a new candle is formed (optional). You configure the timer on candles and at chart corner. I don't need to explain the functions because are very simple. MT4 version:  https://www.mql5.com/en/market/product/38677 Any doubt or suggestion please contact us. Enjoy! This is a free indicator, but it took hours to develop. If you want to pay me a coffee, I
FREE
Active Symbol is a tool that works together with our Trade Panel. Since version 1.2 our panel can manage multiple symbols without having to open it in all of them, just one. This tool make this possible, because with it the actual or remote symbol information are saved for our Trade Panel to use. Remember to enable the panel control mode in the all symbols function. If you have some problemas with the shortcut buttons on chart on unpinned mode of Trade Panel try change the tickets digits option.
FREE
Volume Weighted Average Price or VWAP is an indicator wich shows different average prices on chart. This is very useful to find strong negotiation price areas and as trend following. Configurations: Day, Week and Month - Show different VWAPs according to the period. You can change each line style on "colors" tab. Any doubt or suggestion please contact us. Enjoy! This is a free indicator, but it took hours to develop. If you want to pay me a coffee, I appreciate a lot   <3 PayPal, Skrill, Ne
FREE
New Candle Alert MT5
Thiago Duarte
4.8 (5)
New Candle Alert is a simple indicator that notify you when a new candle is formed. Func tions : Alert type - option to choose between message with sound or only sound. Message -   alert message. Push notifications -   enable push notifications. Show timeframe -  show the symbol timeframe. Show hour -   show the alarm time. Test message - if you don't want to wait a new candle formed to see the message. MT4 version:  https://www.mql5.com/pt/market/product/37988 Hope you enjoy it. Any doubt or su
FREE
LT Clock MT4
Thiago Duarte
4.73 (11)
Simple indicator that draws the market hours on chart (broker, local and GMT). Functions: Horizontal distance -  from border. Vertical distance -  from border. Color -  text color. Font -  text font. Size -  text size. Corner -  which chart corner will be drawn. Show seconds -  show or hide seconds. Draw as background -  candles front or back. Label local -  text before local time. Label broker -  text before broker time. Label GMT -  text before GMT time. Object ID -  identification from object
FREE
LT Easy Market
Thiago Duarte
5 (3)
Easy Market makes the market easier to trade. It allows you to see an "eternally" side (no trend) market, making it extremely easy to see when the price is overbought or oversold. Both trend and consolidation traders will like Easy Market. You can use it as an auxiliary window (below chart) or in full screen mode. See the screenshots and note how it gives you accurate entries! If you have any doubt or suggestion, please, contact us! Ejoy!
Are you a  trend surfer like us? Do you use Moving Averages too? Ever wanted the are between them to be painted? Yeah, we solved this problem with the Filled MAs indicator! It is very simple, just puts two fully customizable Moving Averages on chart and fill the space between them, changing the color as they intersect. Thanks to gmbraz for the version 1.1 idea. Any questions os suggestions please contact me! Enjoy! This is a free indicator, but it took hours to develop. If you want to pay me a
FREE
Round numbers (or key levels) is an amazing strategy. These numbers are strong support and resistance levels. So what this indicator does is draw horizontal lines on the chart to help you find these levels. Configurations: 1St level: Color - lines color. Style - lines style. Width -  lines width. 2Nd level: Second level lines? -  turn off second level lines. Color -  lines color. Style -  lines style. Width -  lines width. Space between lines in points -  I don't need explain :) Display at backg
FREE
This indicator draw a watermark on the chart, with the timeframe and symbol name. You can change everything, including add a aditional watermark. Functions: Symbol watermark: Size -  text size. Font -  text font. Color -  text color. Background text -  watermark at foreground or background mode. Horizontal correction -  x correction in pixels. Vertical correction -  y correction in pixels. Separator period X symbol -  what will separate the period from symbol. Aditional watermark: Enable custom
FREE
Candle Cross MA
Thiago Duarte
5 (3)
Candle cross MA is an indicator that works "silently", that is, drawing only a moving average on the chart. It alerts you when the last candle cross with a moving average that you set. Alert is given only when the candle closes. The moving average settings are fully customizable. The indicator sends popup, and push notifications. You can also deactivate alerts when the chart is inactive. Are you the trend type?  Do not miss another opportunity!
FREE
Tired of calculate every weekend and the end of the month to know how much you've earned and how much your capital has grown? Then this indicator will help you! It informs you how much your capital has grown in money and percentage in the day, week, month, year and in history, plus show how much volume ou used, how much trades you did and how much comission and swap you paid. Alo the open positions result are showed in money and percentage. Note: The amount of trades displayed may differ from
As it name implies, this is an exaustion oscillator. However, you may wonder: what differs you from others oscillators like RSI, Stochastic, CCI etc? The difference is that ours is more powerful and accurate ! Your oscillator filters the nois e made by other oscillators, and shows you only the exact moment to enter the trade. Of course, using it alone, like any other indicator, has its risks. Ideally, reconcile it with technical analysis and/or others indicators. If you buy i t you ge t up  to 1
Are you the type who likes to use moving averages and surf the trend? Me Too! that is why I developed this indicator. It is basically a moving average that changes the color according to the trend (up or down). Its appearance can be customized and the price method too. The setup is very simple, no need to explain. If you have any questions or find any errors please contact us! Enjoy! This is a free indicator, but it took hours to develop. If you want to pay me a coffee, I appreciate a lot   <3
FREE
This is a simple indicator that shows the spread in points. It is useful for those like trade scalper, in addition to be customizable. Functions: Color - I don't need to explain :) Font type - I don't need to explain :) Font size - I don't need to explain :) First text - text in front of spread number Second text - aditional text after the spread number. Corner - specify the corner where the spread will be written. Horizontal distance - horizontal distance from the edge. Vertical distance -
FREE
Are you tired of erasing the objects on chart and then having to put them back in? What if you had a tool that would allow you to hide and show all objects any time? Cool, huh? That is why I developed this tool as an indicator. With it you hide all objects using a shortcut button on chart or the keyboard (customizable). If you have any suggestions or find a bug, please, contact us. Enjoy!
FREE
Trailing Step is an EA that lets the order's stop loss at a specific distance of current price, set by pips. Its configuration is very simple: Trailing stop in pips - sets the stop loss distance in relation to the current price in pips. Trail step in pips - sets the "step" of stop loss in pips. Never miss a trade by forgetting to move the stop. Guarantee your profit! Any doubt or suggestion do not hesitate in contact us. Enjoy! Obs. You need to set the stoploss when you open your trade
FREE
Are you the type that likes to protect your trades by moving the stop loss to the entry point and also using trail stop? Cool! This EA will help you with that. What's more, it also partially closes the trade when the trail stop is activated. That's it! Beyond all this it shows the stop loss projection (which you can move)   and notify you when it is activated. EA can be used by configuring the default window or by using a custom window , which makes it easy to change settings. You can t
Filtrele:
Santanilla71
164
Santanilla71 2024.02.10 20:27 
 

gracias muy bueno

Csaba Zoltan Jonas
190
Csaba Zoltan Jonas 2024.01.22 10:14 
 

With the new MT5 update the indicator does not work. (Forget it, they have fixed the bug in MT5. Everything works again.)

Thiago Duarte
192888
Geliştiriciden yanıt Thiago Duarte 2024.01.22 20:18
You could have informed me of this in the discussion tab. I would have updated the indicator on the same day.
Marcel Matsuno
120
Marcel Matsuno 2023.10.07 06:36 
 

Bom 👍

Tom Birk
53
Tom Birk 2023.08.10 13:57 
 

Works Great! I use a 9 period on any time frame. Easy to read trend.

Thiago Duarte
192888
Geliştiriciden yanıt Thiago Duarte 2023.08.10 15:31
I am glad that you liked it ˆˆ
kester ugochukwu enebeli
80
kester ugochukwu enebeli 2022.09.11 16:14 
 

helpful

Thiago Duarte
192888
Geliştiriciden yanıt Thiago Duarte 2023.07.19 18:15
I am glad you liked it :D
İncelemeye yanıt
Sürüm 1.3 2024.01.22
Compiled to work with the new MT5 and MQL5 version (build 4153).
Sürüm 1.2 2023.07.20
- Now alerts also specify the symbol name (thanks to jaecker).
Sürüm 1.1 2022.05.28
- Improved calculations, now the indicator is incredibly more faster!