RSI Dashboard Scanner
- Göstergeler
- Teddy Mutugi Mworia Teddy Mutugi Mworia
- Sürüm: 2.0
- Güncellendi: 9 Ağustos 2022
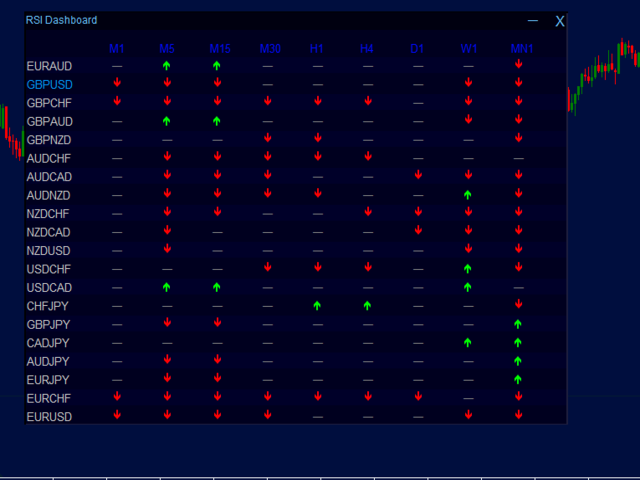
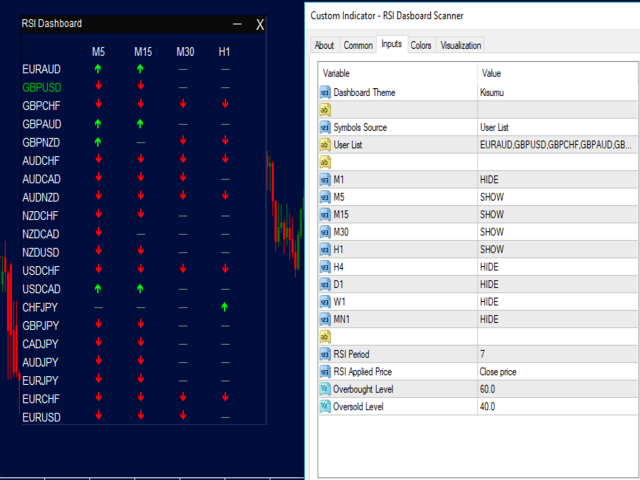
Bu gösterge, RSI değerleri için çoklu zaman dilimlerinde birden fazla çifti tarar ve gerçek zamanlı olarak RSI aşırı alım değerleri için yeşil yukarı oklar ve aşırı satım RSI değerleri için kırmızı aşağı oklar çizer.
Özellikler
• Hareketli satır çizimi
• Boyutlandırılabilir
• Yeniden konumlandırılabilir
• En aza indirilebilir
• Çoklu gösterge tablosu temaları
• Birden çok zaman dilimi
• Bir çifti tıklayarak açabilirsiniz.
• Farklı bir renkle işaretlenmiş mevcut grafik çifti
• Piyasa saati çiftlerini veya kendi çift listenizi kullanın
• Görüntülenecek zaman dilimlerini seçin


Completely admirable! Good stuff, my respect to you!