ATR Scanner Pro MT5
- Göstergeler
- Amir Atif
- Sürüm: 1.40
- Güncellendi: 9 Haziran 2024
- Etkinleştirmeler: 15
40% off. Original price: $50
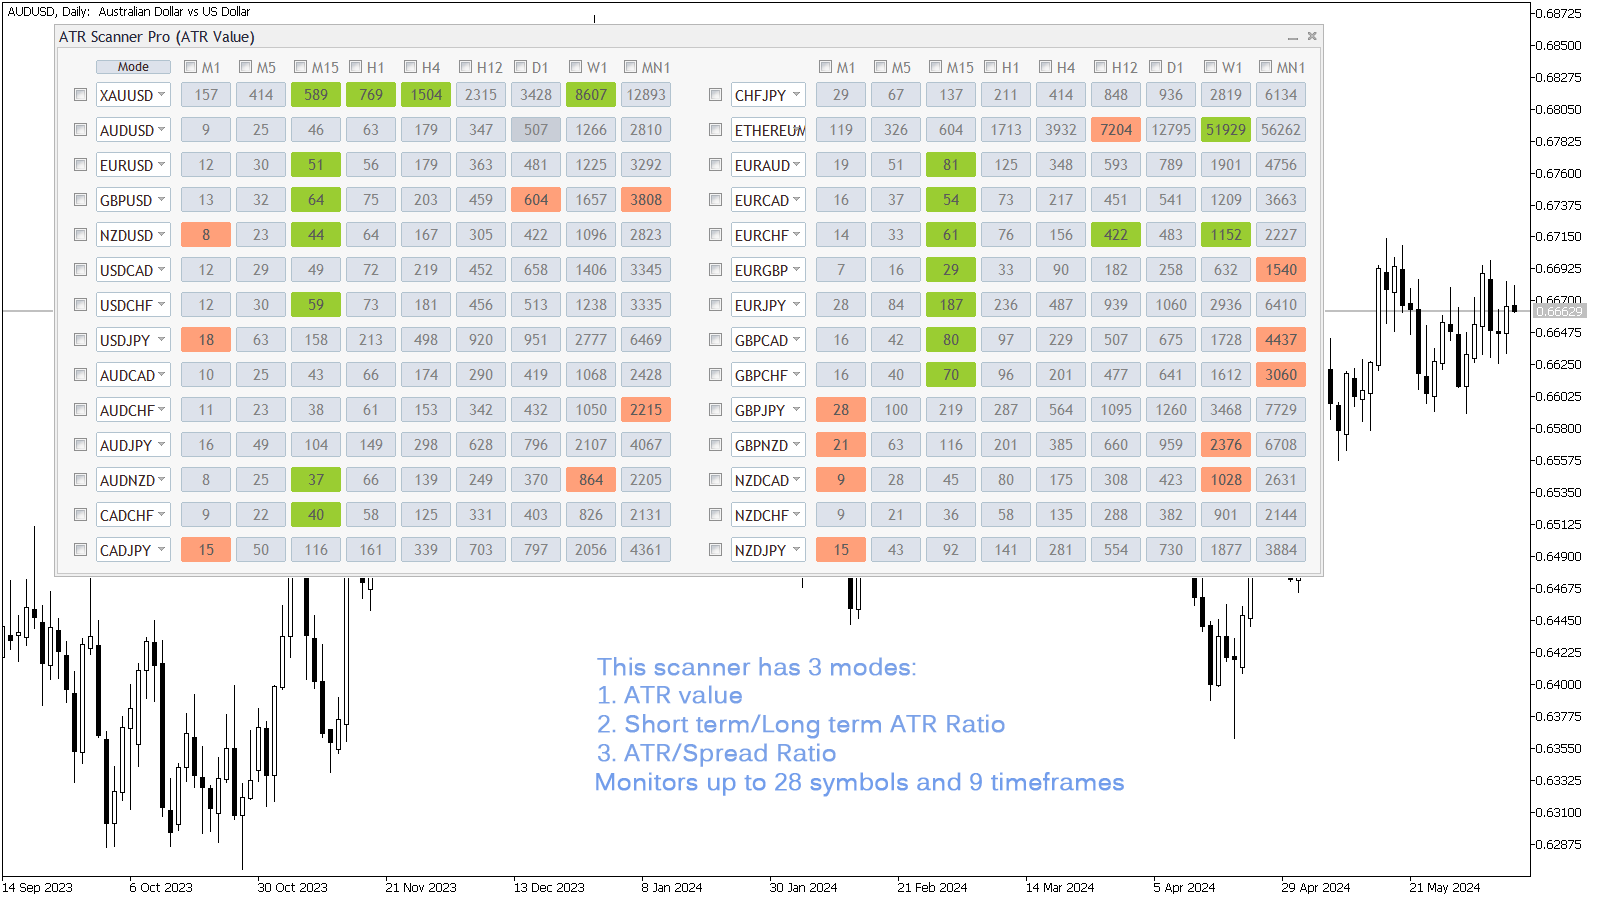
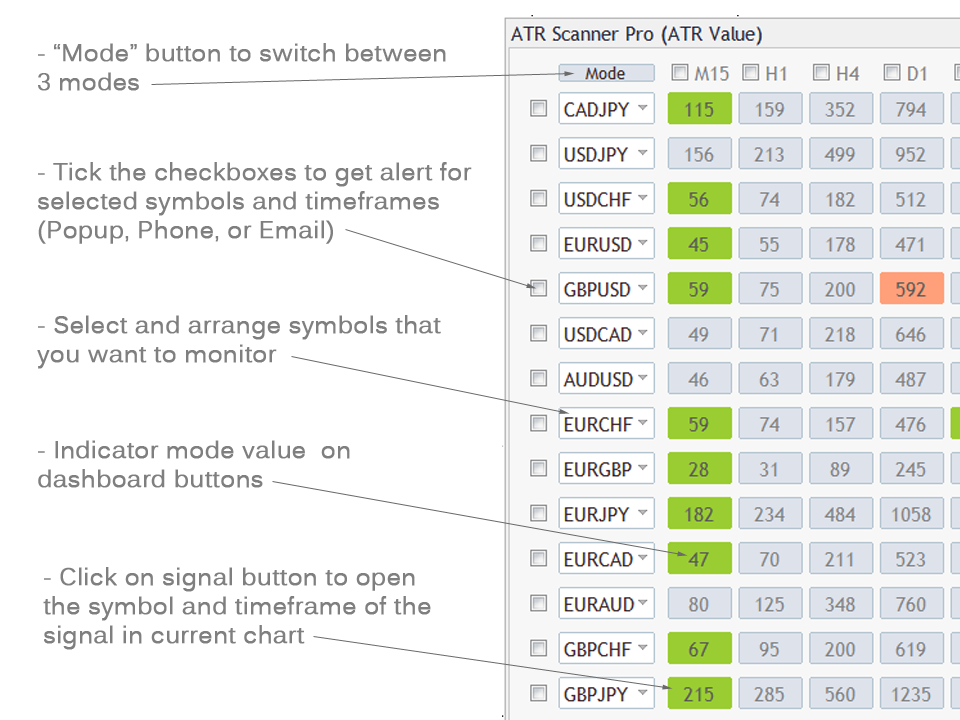
ATR Scanner Pro is a multi symbol multi timeframe volatility scanner that monitors and analyzes Average True Range indicator value in up to 28 symbols and 9 timeframes in 3 modes :
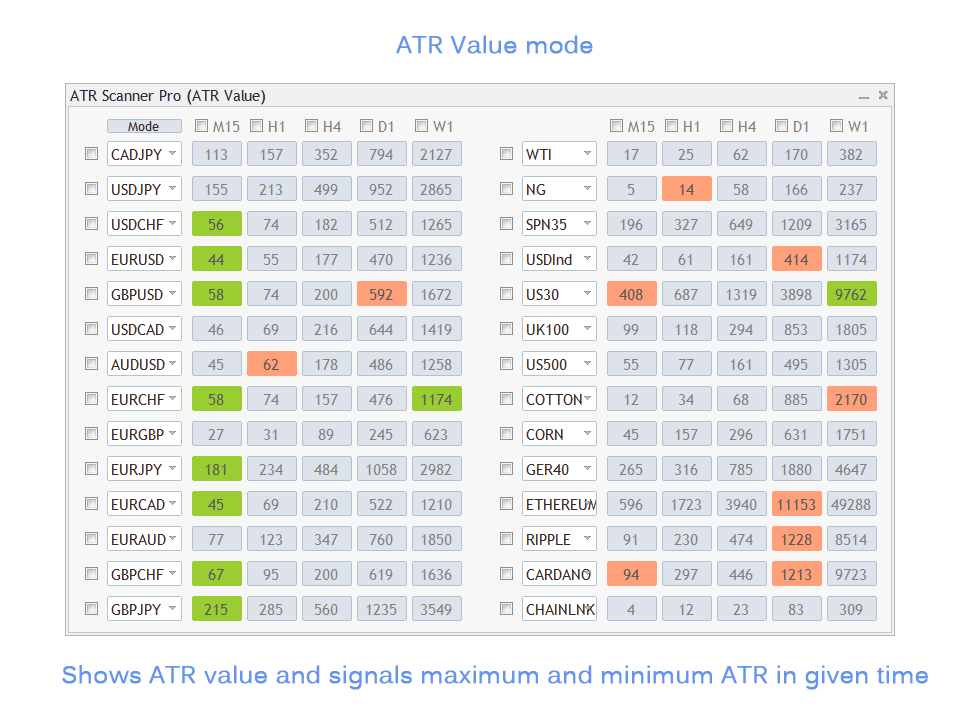
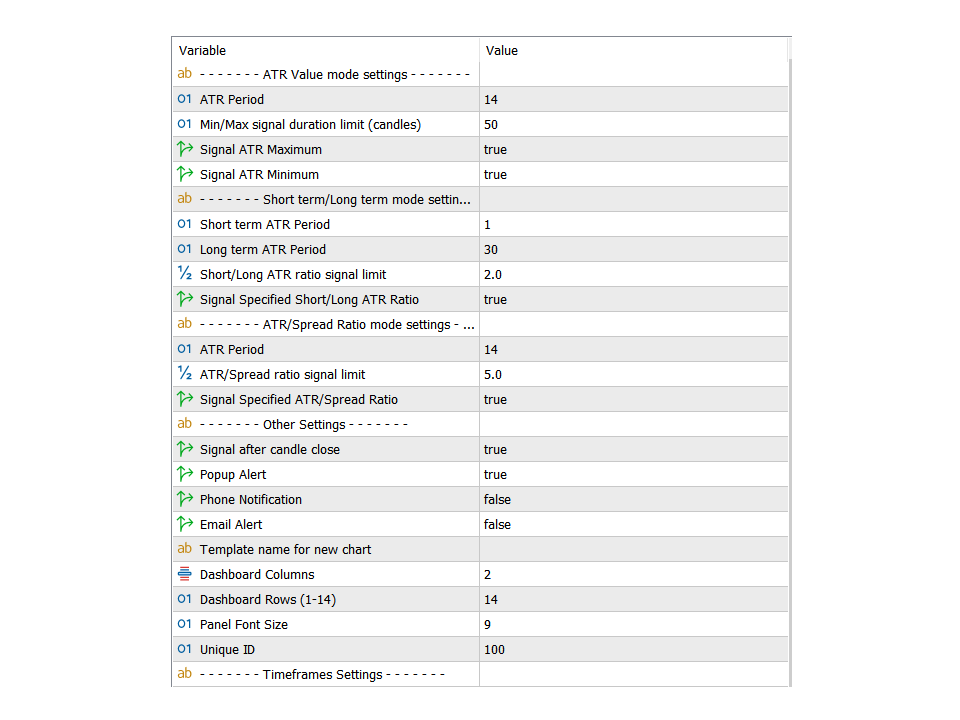
- ATR value: As a volatility dashboard it shows the ATR indicator value in all pairs and timeframes and signals when the ATR value reaches a maximum or minimum in a given duration.
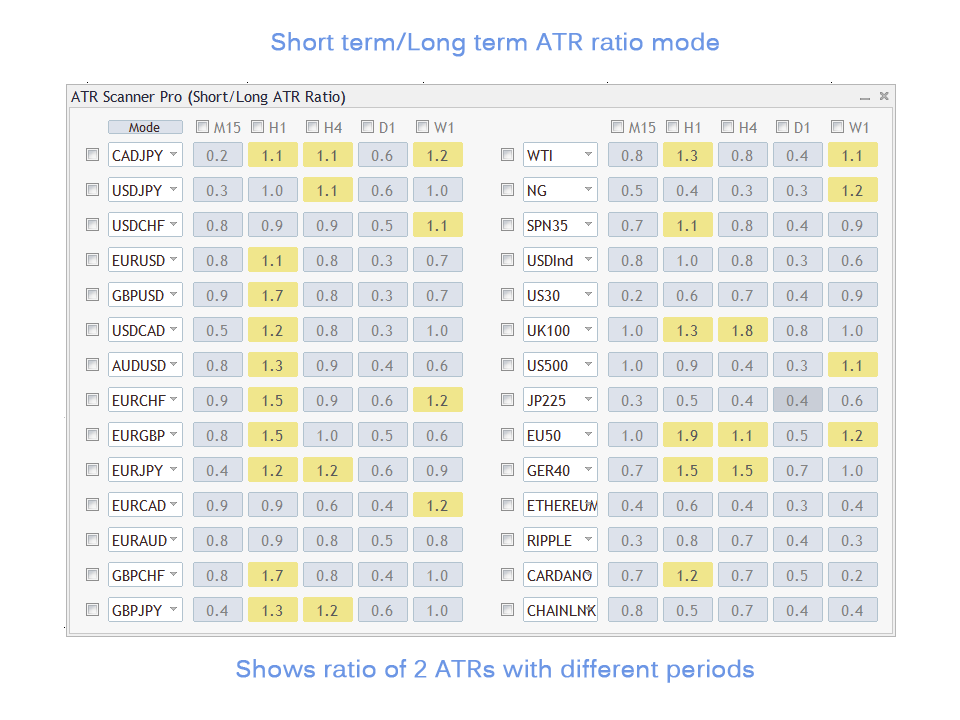
- Short term ATR/Long term ATR ratio: It shows ratio of 2 ATRs with different periods. It's useful in detecting short term volatility and explosive moves.
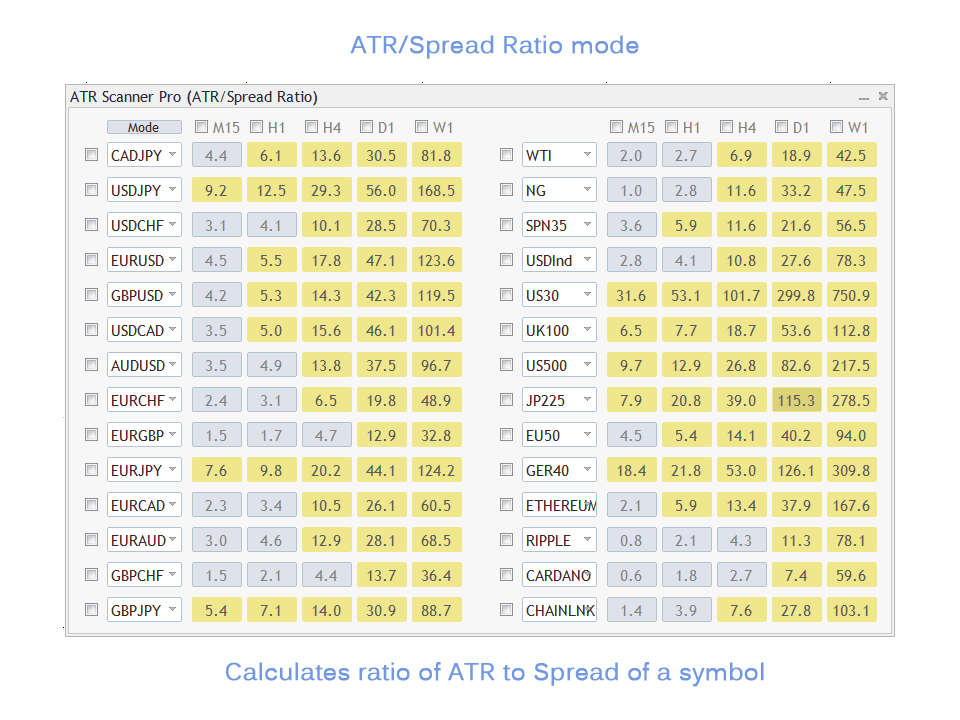
- ATR Value/Spread ratio: Shows the ratio of ATR and symbol spread useful in choosing a symbol to trade considering money management especially when we are trading in lower timeframes. (scalping)
ATR Scanner Pro features:
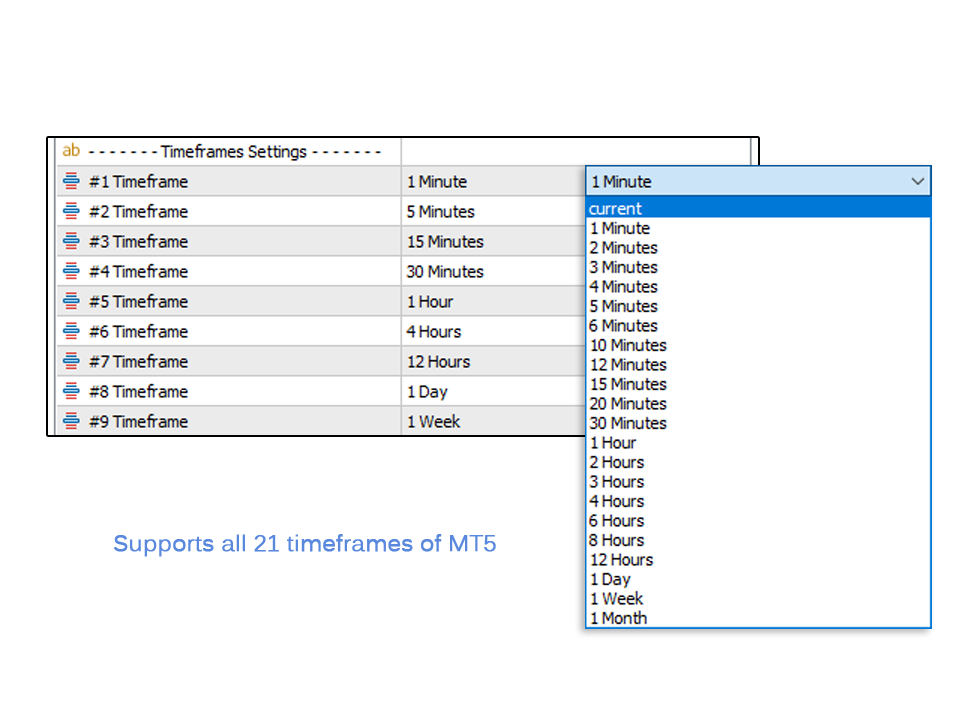
- Monitors 28 customizable instruments and 9 timeframes at the same time.
- Supports all 21 timeframes of the MT5 platform.
- Popup, email, and phone notification alerts for selected symbols and timeframes.
- Quick review of signals in the same chart by clicking on signal buttons.
Notes
- If you want to monitor more than 28 instruments you can load the indicator on another chart with different "Unique ID" in the settings and set different symbols for it.
- The symbols that you want to add to the ATR dashboard must be visible in the MetaTrader market watch window. The first time you run the indicator or load a new symbol in the dashboard it might take a few seconds to update its data and show signals.
If you trade strong price moves or any type of consolidation breakouts, you may want to try the Reward Multiplier.