• Genel bakış
  • İncelemeler
  • Yorumlar

Fibo Panda Daily Auto

Fibo Panda is an indicator that can help you predict the end of daily trends.

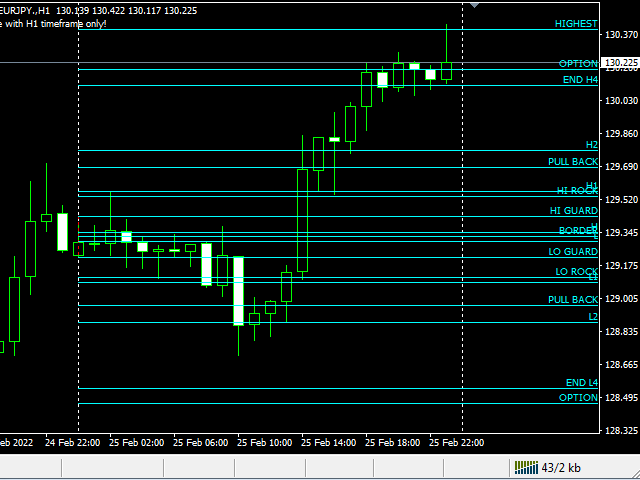
If the daily price has reached the END L4 or END H4, means the Daily volume is enough. If the daily price has reached the Highest or Lowest, means the price has reached the highest or lowest level.

Price must touch the End Hi or End Low Level to complete the price movement of each timeframe.

A conclusion can be made whether to buy or sell.

If the price is in the High Guard and Low Guard areas it means the price is now in the sideway, this is the neutral zone. You are not encouraged to enter this area.


PRICE IS IN THE NEUTRAL ZONE

BETWEEN HI GUARD AND LO GUARD, NEUTRAL ZONE IS LIKE A "HOME" NEGOTIATION PLACE TO WANT TO HI OR LO,
AS LONG AS THE PRICE IS IN THE NEUTRAL ZONE THEN IT IS SIDEWAY IT IS NOT ENCOURAGED TO ENTRY IN THE NEUTRAL ZONE UNLESS THERE IS OTHER UNDERSTANDING.

** FUNCTION ** HI / LO GUARD IS LIKE "SECURITY" TO HI and LO NEED TO GET“ACCESS” FROM GUARD

MAIN PRICE CONDITIONS NEED TO CLOSE OUTSIDE THE GUARD, EVERY BREAK NEEDS A RETRACEMENT. SO WAIT FOR THE NEW RETRACEMENT LOOK FOR SETUP FOR ENTRY.


LEVEL HI/LO ROCK (150.00) H1/L1 (161.8)

• ROCK TO ROCK MEANS OFTEN WHEN THE PRICE DOES NOT "BREAK"
 LEVEL ROCK (150.00) PRICE WILL GO TO THE OPPOSING LEVEL ROCK .. FROM LO ROCK TO HI ROCK.

• CHANCE TO WIN BETWEEN 20 - 40 PIP IF ENTRY IS AT ROCK LEVEL.

• HOW TO ENTRY IN TF H1 CONFIRMATION IN M15. IN TF H4 CONFIRMATION IN TF H1.

• IF THERE IS A REJECTION CANDLE THAT EXCEEDS 2 3 4 THE CANDLE SHOWS PRICE IS NOT AFFORDABLE TO BREAK AND WILL APPLY RETRACE OR REVERSAL.

• OFTEN PRICE WILL RE -ENTER THE "NEUTRAL ZONE" BY OPPORTUNITY SCALPING BETWEEN 10-20 PIPS.

• GENERALLY ENTRY AT LEVEL ROCK IS SOMEWHAT RISK UNLESS THERE IS OTHER UNDERSTANDING.

• “ALWAYS” APPLIES WHEN THE PRICE “STARTS TO MOVE” FROM THE ROCK LEVEL IT WILL END AT END CYCLE (END LO / HI).

• EXAMPLE IF STARTING FROM LO ROCK WILL END AT END HI.


LEVEL HI/LO PULLBACK (200.00) H2/L2 (261.8).

• LEVELS THAT HAVE HIGH RISK N HIGH REWARD.

• AT THIS LEVEL “OFTEN” APPLY 3R (Rejection, Retracement, Reversal).

• SITUATIONS OCCUR AT EVERY TIME FRAME AND PAIR.

• ENTRY OPPORTUNITY “WATCH” THE ENTIRE MOVEMENT PRICE IN TIME FRAME H4, DAILY, WEEK.

• PRICE OFTEN “STARTS MOVING” AT THE PULLBACK LEVEL AND END IN END ZONE (HI/LO).

• TF H4 "MUST" BE FOCUSED WHEN PRICE IS AT LEVEL SUCH.

• FOR ENTRY MAKE SURE “WAIT MANDATORY” CANDLE CLOSED.


ROUTING 4 (R4) IS THE * BACKBONE * IN FIBO PANDA

• THIS IS RELATED TO DAILY, WEEKLY, MONTHLY AND ANNUAL VOLUME.

• DAILY VOLUME TF H1, WEEKLY TF H4, MONTHLY TF D1, ANNUAL TF WEEK.

• PRICE * MANDATORY * TOUCH LEVEL END HI OR END LO TO COMPLETE PRICE MOVEMENT AT EACH TIME FRAME.

• MAKE SURE THE SIZE / SETTING IN EACH TF IS CORRECT AND ACCURATE.

• WITH FULLY UNDERSTANDING THE MOVEMENT OF ROUTING 4, THIS IS CERTAIN WILL BE ABLE TO READ * MARKET DIRECTIONS * AND CLEAR PRICE MOVEMENT FOR ENOUGH VOLUME, YOU MUST LOOK FOR END HI OR END LO

• FOR MORE CLEAR PLEASE DO A BACK TEST AND SEE THE PRICE MOVEMENT ON AVERAGE 90% PRICE TOUCH END HI AND END LO.



Önerilen ürünler
This is indicator for checking your trades. Please see the pictures attachment, the indicator show info about: - Breakeven Level; - Margin Call Level; - Two volume info, past and current (With color exchange base on the past volume); - Spreads; - Swap Long and Swap Short (With color change, positive and negative swap); - Running Price; -Today High Low Pips; - Today Open to Current Running Price pips. This indicator not for trading entry, only to assist your trade management Regards
Harmonic Trading is now much easy than ever before with Harmonic Master Scanner Pro you can now scan time frames from 5m to 1w for 17 harmonic patterns on all bares at the same time. Harmonic Master Scanner Pro works based on original MetaTrader4 Zigzag indicator and the standard harmonic patterns elements. This software send alert and email to you when a harmonic pattern is detected on any charts. If you want the scanner to draw the pattern just switch the time frame to the alert time frame. Th
Ska ZigZag BuySell
NKATEKO VUKOSI LEROY MASANGO
Ska ZigZag BuySell indicator determines the overbought and oversold regions within a trend. The indicator determines the overbought region by the candlestick high and the oversold region by the candlestick low. This indicator only gives signals with arrow and audible alerts each and every time when a new candlestick appear. To utilize the full strategy i recommend using "Ska ZigZag BuySell" together with "Ska ZigZag Line". The Ska ZigZag Line indicator is available for free. NOTE: Indicator is h
Acemi veya Profesyonel, en çok satan çok zaman dilimli Pivot Prof, alış ve satışlarınızı güzelleştirecek ve uzmanların kullandığı Destek ve Direnç katmanlarıyla size birinci sınıf değişim olanakları sunacaktır. Pivot alış ve satış, anahtar aralıklarda piyasaya giriş ve çıkış yapmak için kolay ve güzel bir tekniktir ve yetkililer tarafından uzun süredir kullanılmaktadır ve tüm semboller üzerinde çalışmaktadır: Forex, Kripto, Hisse Senetleri, Endeksler vb. Pivot Prof top getiriyor Katmanları bayi
Contact me for any queries or custom orders, if you want to use this in an EA. Key Features: Pattern Recognition : Identifies Fair Value Gaps (FVGs) Spots Break of Structure (BOS) points Detects Change of Character (CHoCH) patterns Versatile Application : Optimized for candlestick charts Compatible with any chart type and financial instrument Real-Time and Historical Analysis : Works seamlessly with both real-time and historical data Allows for backtesting strategies and live market analysis V
FREE
Extremum Reverse Bar
Yurij Izyumov
2.8 (5)
This indicator has been created for finding the probable reversal points of the symbol price. A small candlestick reversal pattern is used it its operation in conjunction with a filter of extremums. The indicator is not redrawn! If the extremum filter is disabled, the indicator shows all points that have a pattern. If the extremum filter is enabled, the condition works – if the history Previous bars 1 candles back contains higher candles and they are farther than the Previous bars 2 candle, such
FREE
The indicator compares pattern found on chart history with the current price movement. Since history repeats itself, then, by comparing the two patterns, indicator can predict the further movement of the price. The indicator allows you to overlay highlighted history pattern with current movement and you will visually see this movement and will be able to compare the past and the present. To compare two patterns, you need: It is necessary to find and highlight a pattern on the history chart of a
The chart pattern is automatically drawn. It also automatically tells you the price at which you are most likely to buy or sell according to the pattern. Therefore, there is no need to memorize patterns or draw lines by yourself. We are live-streaming the actual operation of the system. Please check for yourself if it is usable. Please check it out for yourself. https://www.youtube.com/@ganesha_forex We do not guarantee your investment results. Investments should be made at your own risk. W
KT Asian Breakout Indicator
KEENBASE SOFTWARE SOLUTIONS
KT Asian Breakout indicator scans and analyzes a critical part of the Asian session to generate bi-directional buy and sell signals with the direction of a price breakout. A buy signal occurs when the price breaks above the session high, and a sell signal occurs when the price breaks below the session low. MT5 Version is available here https://www.mql5.com/en/market/product/41704 Things to remember If the session box is vertically too wide, a new trade should be avoided as most of the price
This indicator will allow you to evaluate single currency linear regression. WHAT IS LINEAR REGRESSION?(PIC.3) Linear regression is an attempt to model a straight-line equation between two variables considering a set of data values. The aim of the model is to find the best fit that can serve the two unknown values without putting the other at a disadvantage. In this case, the two variables are price and time, the two most basic factors in the Forex market. Linear regression works in such a wa
The indicator automatically sets trendlines on the really important points directly on the chart. Timeframe, color and style of the lines can be adjusted. Notification of a breakout above or below the line via a smartphone is possible. Input Parameters TimeFrame : Choose timeframe AppliedPrice : Choose close , open, high, low, median, typical or weighted price Formation : Choose swing, Shoulder head shoulder or long term formation Alerts : true = alert is on SendEmail : Send message to email a
QuantumAlert Stoch Navigator is a free indicator available for MT4/MT5 platforms, its work is to provide "alerts" when the market is inside "overbought and oversold" regions in the form of "buy or sell" signals. This indicator comes with many customization options mentioned in the parameter section below, user can customise these parameters as needful. Join our   MQL5 group , where we share important news and updates. You are also welcome to join our private channel as well, contact me for the p
FREE
Pivot Point Fibo RSJ, Fibonacci oranlarını kullanarak günün destek ve direnç çizgilerini izleyen bir göstergedir. Bu muhteşem gösterge, Fibonacci oranlarını kullanarak Pivot Point üzerinden 7 seviyeye kadar destek ve direnç oluşturur. Fiyatların, bir operasyonun olası giriş/çıkış noktalarını algılamanın mümkün olduğu bu destek ve direncin her bir düzeyine uyması harika. Özellikleri 7 seviyeye kadar destek ve 7 seviye direnç Seviyelerin renklerini ayrı ayrı ayarlayın Girişler Pivot Tipi
FREE
An indicator of patterns #45 and #46 (Three Falling Peaks and Three Rising Valleys) from Encyclopedia of Chart Patterns by Thomas N. Bulkowski. Parameters: Alerts - show alert when an arrow appears   Push - send a push notification when an arrow appears (requires configuration in the terminal) PeriodBars - indicator period K - an additional parameter that influences the accuracy of pattern shape recognition. The smaller the value is, the smoother the row of peaks/valleys should be, so fewer patt
The Channel Arg Control indicator, in addition to lines, reflects entry signals in the form of arrows. But how to do that? At first glance, this is not an easy task. But not for the Channel Arg Control indicator, this indicator will tell you whether you have configured the indicator correctly, while you can specify the history interval in the bars that interests you. And yet, how does the indicator tell you? Look at the numbers on the chart near the arrows! This is exactly what you thought, the
This indicator scans for you up to 30 trading instruments and up to 8 timeframes for occurrences of the high probability reversal patterns: Double Tops/Bottoms with fake breakouts . Please read also the blog post " Professional Trading With Double Tops/Bottoms And Divergences! " which explains the concepts behind the ULTIMATE Double Top/Bottom indicator and how you can use a professional top-down approach. This FREE Version of the Scanner scans only EURUSD and GBPUSD. The full version of the sca
FREE
AlarmLIne
Adrian Hernandez Castellanos
Trend Çizgisi Kırılma Uyarısı Açıklama: Bu gösterge, fiyat bir trend çizgisini yukarı veya aşağı kırdığında bir alarm (ses, uyarı veya bildirim) tetikler. Parametreler: Names of the trendlines. : Virgüllerle ayrılmış trend çizgisi isimleri (Trend çizgisi adınızın başında boşluk olmadığından ve doğru olduğundan emin olun). Value over/under the line (E.g.: 0.03% or 500 pips). : Alarmı tetiklemeden önce trend çizgisinin yukarıda/aşağıda bir marjı tanımlayan değer, bir sonraki parametreye bağlı olar
It's a multi-symbol and multi-timeframe scanner for our indicator - ACB Breakout Arrows . With default settings, it scans for the buy/sell signals on 28 currency pairs and 9 time-frames concurrently .  Features It can scan 252* combinations of symbols and time-frames from a single chart. Open the signal's chart loaded with a predefined template with a single click.  Easy drag n drop anywhere on the chart. Real-time alerts with popup, sound, push-notifications and email alerts.  Input Para
PX Trend
Vitalii Zakharuk
PX Trend is a technical indicator that mathematically transforms the price of a currency pair in the form of signaling arrows on the chart, it is used to predict the direction of the market movement. This tool is basic for the interpretation of the parameters of the graphs in technical analysis. PX Trend refers to an arrow indicator Forex - a tool that gives unambiguous signals to buy or sell currencies using arrows. An arrow directed upwards recommends buying, downward - selling. The indicat
Recommended on M15 and higher timeframes Sends alerts and notifications when the zone is create Sends alerts and notifications if zones are retested You will see the trading zones and identify the most profitable points to open positions. The indicator marks the supply and demand zones. With this show you will now make profitable trades that will set the trends. Shows all support and resistance zones. Can work in all time zones. No need to mess with complicated settings, all setti
FREE
**Binary Smart System: En İyi İşlem Yardımcınız** Binary Smart System sadece bir gösterge değil, piyasaların çeşitli alanlarında hassaslıkla işaretler üreten sofistike bir işlem aracıdır. Keskin algoritmaların ve geniş bir teknik gösterge koleksiyonunun birleşiminden oluşan bu sistem, işlem başarınızı en üst düzeye çıkarmak için tasarlanmıştır. **Gösterge Bileşenleri:** 1. **Hareketli Ortalama Yüzdesi (HAY):** Bu bileşen, birden fazla hareketli ortalamanın ağırlıklı ortalamasını hesaplar
Market Profile
Artem Titarenko
5 (1)
The "Market Profile" indicator displays the profiles and volumes of periods – weekly, daily, session (8-hour), 4-hour, hour, summary. The VAH/VAL price area is automatically highlighted by a dotted line for each profile (except for the summary). The indicator includes chroma Delta, which colors the profile areas. The areas of prevailing Buys is colored in green, that of Sells - in red. The intensity histogram features blue/red respectively. In the filter mode, the indicator displays the volume a
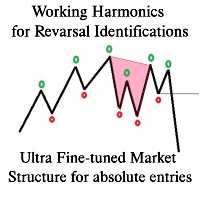
Last & Ultimate Indictor a trader would ever need while trading.        Confirmation Based  Harmonic Patterns for Trend Reversal Identification .        Ultra finetuned Candle Based Market structure(not pivot or average based like other noisy indicators) for a sniper & confirmational Entry      Added false breakout entry for dual parameter low risk entry This is the finest structure marking you will ever find in any market. indicator is coded based on actual candle breaks and not coded b
PDP indicator is used for: defining price probability distributions. This allows for a detailed representation of the channel and its borders and forecast the probability of a price appearing at each segment of its fluctuations; defining the channel change moment. Operation principles and features PDP analyzes a quote history on lower timeframes and calculates a price probability distribution on higher ones. Forecast algorithms allow the indicator to calculate probability distributions and m
TMA Channel is a price channel obtained through a special calculation method based on traditional TMA . The channel has upper, middle, and lower tracks . When the price approaches or exceeds the upper track, it is already in an overbought state, and attention should be paid to the situation of reversal and decline; When the price approaches or falls below the lower track, it is already in an oversold state, and attention should be paid to the situation of reversal and rise . The indicator will d
Parabolik SAR ve Destek/Direnç Seviyeleri, forex ticaretinde potansiyel trend dönüşlerini ve giriş ve çıkış noktalarını belirlemek için kullanılan bir teknik analiz göstergesi olmakla kalmayıp aynı zamanda hazır bir otonom ticaret stratejisidir. Gösterge, grafiğe dinamik destek ve direnç seviyeleri ekleyerek PSAR göstergesini temel alır ve bu da yatırımcıların piyasanın potansiyel olarak tersine dönebileceği önemli fiyat seviyelerini belirlemesine yardımcı olabilir. Yatırımcılar bu göstergeyi
Note : The slow loading of the indicator issue has been addressed . This new version loads fast and does not slow the platform. Version 1.3 : We have updated the indicator to include an historical bar scanning option . So instead of scanning all bars in the history (which can make the indicator slow sometimes ) , you can select the maximum number of bars it can scan which can increase the performance and make the indicator faster. This indicator scans the 1-3 Trendline pattern . The indic
This indicator is meant for Harmonic Traders, it helps them in identifying the formed patterns by analyzing the market past data, looking for Harmonic Patterns. The Patterns that this indicator can detect are: AB=CD Butterfly Gartely Crab Bat The indicator shows the following: The completed pattern, with the critical zone highlighted in Gray box The suggested 3 take profit levels (in green) The Suggested Stop Loss level (in Red) The formed pattern ratios can be checked by hovering the mouse on t
MQLTA Support Resistance Lines is an indicator that calculates the historical levels of Support and Resistance and display them as Lines on chart. It will also Alert you if the price is in a Safe or Dangerous zone to trade and show you the distance to the next level. The indicator is ideal to be used in other Expert Advisor through the iCustom function. This DEMO only works with AUDNZD, the full product can be found at https://www.mql5.com/en/market/product/26328 How does it work? The indicato
FREE
Rhino NW
Sergei Shishaev
Нестандартный индикатор определения текущего тренда. Альтернативный подход к определению текущей рыночной тенденции. В основе лежит уникальный алгоритм. Не используются   скользящие средние , осцилляторы , супер-тренды и прочие стандартные индикаторы. Для таймфреймов:   от M15 до D1 . Для стилей торговли:  интрадэй, свинг, долгосрок . Может стать готовой торговой стратегией совместно с любым канальным индикатором. Например таким, как индикатор   "Snake" . Внимание! Это индикатор, а не советни
Bu ürünün alıcıları ayrıca şunları da satın alıyor
FX Power MT4 NG
Daniel Stein
5 (14)
FX Power NG'nin Tüm Gücünün Kilidini Açın: Nihai Para Birimi Güç Ölçer FX Power, sekiz yılı aşkın süredir dünya çapındaki yatırımcıları güvenilir ve hassas döviz gücü analizleriyle güçlendirmektedir. Şimdi, FX Power NG bu güvenilir aracı bir sonraki seviyeye taşıyarak, ticaretinize benzersiz doğruluk, özelleştirme ve içgörüler getiren gelişmiş özellikler sunuyor. FX Power NG'yi Ciddi Yatırımcılar İçin Olmazsa Olmaz Kılan Nedir? FX Power NG, orijinal FX Power'da sevdiğiniz her şeyi temel ekle
Trend Reversal – MT4'te Trend Dönüşlerini Belirlemek İçin Yardımcınız Piyasa analizinizi geliştirmek ve daha bilinçli kararlar almak için güçlü ve sezgisel bir araç mı arıyorsunuz? Trend Reversal göstergesi, MetaTrader 4 platformunda trend dönüş noktalarını doğru bir şekilde belirlemek isteyen yatırımcılar için özel olarak tasarlanmıştır. Gelişmiş algoritmalar ve kanıtlanmış tekniklerin birleşimi sayesinde, Trend Reversal, piyasadaki önemli anları tanımanıza yardımcı olmak için net ve görünür
TPSproTREND PrO
Roman Podpora
4.79 (19)
TPSpro TREND PRO,   piyasayı otomatik olarak analiz eden, trend ve değişimlerinin her biri hakkında bilgi sağlayan, ayrıca yeniden çizmeden işlemlere girme sinyalleri veren bir trend göstergesidir! Gösterge her mumu ayrı ayrı analiz ederek kullanır. farklı dürtülere atıfta bulunur - yukarı veya aşağı dürtü. Para birimleri, kripto paralar, metaller, hisse senetleri ve endeksler için işlemlere tam giriş noktaları! Sürüm MT5                   GÖSTERGENİN TAM AÇIKLAMASI       Bunu -   RFI SEVİYELER
Scalper Inside PRO
Alexey Minkov
4.75 (60)
!!!CHRISTMAS SALE!!! An exclusive indicator that utilizes an innovative algorithm to swiftly and accurately determine the market trend. The indicator automatically calculates opening, closing, and profit levels, providing detailed trading statistics. With these features, you can choose the most appropriate trading instrument for the current market conditions. Additionally, you can easily integrate your own arrow indicators into Scalper Inside Pro to quickly evaluate their statistics and profitab
FX Volume
Daniel Stein
4.58 (33)
FX Hacmi ile Forex'te Gerçek Bir Avantaj Elde Edin: Nihai Hacim Göstergesi FX Volume, gerçek piyasa duyarlılığını içeriden bir bakış açısıyla ortaya koyan ilk ve tek hacim göstergesidir. FX Volume, kurumsal piyasa katılımcılarının ve brokerlerin nasıl konumlandıklarına dair benzersiz bilgiler sağlayarak, genellikle büyük oyuncular için ayrılmış öngörü ile ticaret yapmanıza olanak tanır. COT raporlarının gecikmelerine elveda deyin - FX Volume size bu önemli bilgileri anında grafiğinizde sunarak
Dynamic Forex28 Navigator
Bernhard Schweigert
5 (4)
Dynamic Forex28 Navigator - Yeni Nesil Forex Ticaret Aracı. ŞU ANDA %49 İNDİRİM. Dynamic Forex28 Navigator, uzun zamandır popüler olan göstergelerimizin evrimidir ve üçünün gücünü tek bir göstergede birleştirir: Gelişmiş Döviz Gücü28 Göstergesi (695 inceleme) + Gelişmiş Döviz İMPULS ve UYARI (520 inceleme) + CS28 Kombo Sinyalleri (Bonus). Gösterge hakkında ayrıntılar https://www.mql5.com/en/blogs/post/758844 Yeni Nesil Güç Göstergesi Ne Sunuyor?  Orijinallerde sevdiğiniz her şey, şimdi ye
Şu anda %20 İNDİRİMLİ! Herhangi bir Acemi veya Uzman Tüccar için En İyi Çözüm! Bu gösterge paneli yazılımı 28 döviz çifti üzerinde çalışıyor. Ana göstergelerimizden 2'sine (Gelişmiş Para Birimi Gücü 28 ve Gelişmiş Para Birimi Dürtüsü) dayanmaktadır. Tüm Forex piyasasına harika bir genel bakış sağlar. Gelişmiş Para Birimi Gücü değerlerini, para birimi hareket hızını ve tüm (9) zaman dilimlerinde 28 Forex çifti için sinyalleri gösterir. Trendleri ve / veya scalping fırsatlarını belirlemek içi
Full Forex Market View Dashboard
Opengates Success International
5 (2)
TAM FOREX PİYASASI GÖRÜNÜMÜ Pano Göstergesi Bu, Yatırımcılara piyasada neler olup bittiğine dair tam bir görüş sağlamak için oluşturulmuş özel bir göstergedir. Piyasaya erişmek ve başarılı ticaret yapmak için gereken her türlü bilgiyi görüntülemek için gerçek zamanlı bir veri kullanır. KURULUM: Bu Göstergeyi pencere grafiğinize eklemeden önce, MT4'ünüzün Piyasa İzleme paneline gidin ve ihtiyaç duymadığınız veya ticaret yapmadığınız tüm Döviz çiftlerini GİZLEYİN ve geri kalanını orada bı
ADR Ters Çevirme Göstergesi, normal ortalama günlük aralığına göre fiyatın şu anda nerede işlem gördüğünü bir bakışta size gösterir. Fiyat, ortalama aralığı ve seçtiğiniz seviyenin üzerindeki seviyeleri aştığında, açılır pencere, e-posta veya push yoluyla anında uyarılar alacaksınız, böylece hızlı bir şekilde geri çekilmelere ve geri dönüşlere atlayabilirsiniz. Gösterge, grafikte ortalama günlük aralık uç noktalarında yatay çizgiler ve ayrıca fiyatları aşan matematiksel olasılıkları olan seviye
TrendMaestro
Stefano Frisetti
5 (3)
note: this indicator is for METATRADER4, if you want the version for METATRADER5 this is the link:  https://www.mql5.com/it/market/product/108106 TRENDMAESTRO ver 2.4 TRENDMAESTRO recognizes a new TREND in the bud, he never makes mistakes. The certainty of identifying a new TREND is priceless. DESCRIPTION TRENDMAESTRO identifies a new TREND in the bud, this indicator examines the volatility, volumes and momentum to identify the moment in which there is an explosion of one or more of these data a
MetaBands M4
Vahidreza Heidar Gholami
5 (3)
MetaBands uses powerful and unique algorithms to draw channels and detect trends so that it can provide traders with potential points for entering and exiting trades. It’s a channel indicator plus a powerful trend indicator. It includes different types of channels which can be merged to create new channels simply by using the input parameters. MetaBands uses all types of alerts to notify users about market events. Features Supports most of the channel algorithms Powerful trend detection algorith
TPSpro RFI Levels
Roman Podpora
4.82 (22)
TALİMATLAR         RUS   -        ENG       Bir gösterge ile kullanılması   önerilir       -       TPSpro   TREND PRO -   Sürüm MT4         Ticarette önemli bir unsur, bir ticaret aracını satın alma veya satma kararlarının alındığı bölgeler veya seviyelerdir. Büyük oyuncuların piyasadaki varlıklarını gizleme girişimlerine rağmen, kaçınılmaz olarak izler bırakırlar. Bizim görevimiz bu izleri nasıl tanımlayacağımızı ve doğru şekilde nasıl yorumlayacağımızı öğrenmekti. Ana işlevler:: Satıcılar ve
Ultimate Index Advisor, piyasa hareketlerini hassas bir şekilde analiz etmek ve dinamik olarak ticaret fırsatlarını belirlemek için tasarlanmış gelişmiş bir araçtır. Gösterge, trendlere, düzeltmelere ve geri dönüşlere göre optimize edilmiş strateji kombinasyonlarına dayalı sinyaller sunarak, farklı ticaret stilleri için çok yönlü bir araçtır. Kullanıcı dostu arayüzü ile Ultimate Index Advisor, grafik üzerinde görülebilir oklarla net giriş ve çıkış noktalarını vurgular, ticaret kararlarındaki b
Ultimate Sniper Dashboard
Hispraise Chinedum Abraham
4.82 (22)
İndirimli fiyatı 299$! Fiyatlar gelecekte artabilir! Aşağıdaki açıklamayı okuyun! Ultimate Sniper Dashboard için En İyi Giriş Sistemi: NIHAI DINAMIK SEVIYELER. (Lütfen Ürünlerimi Kontrol Edin) Ultimate Sniper Dashboard, MT4 çoklu para birimi test limitleri nedeniyle SADECE canlı piyasalarda çalışır. Ultimate-Sniper Dashboard ile tanışın! Hem HA-Sniper hem de MA-Sniper içeren en iyimiz. ve birçok özel mod. Ultimate Sniper Dashboard mutlak bir canavar! Herhangi bir Acemi veya Uzman Tüccar
Advanced Supply Demand
Bernhard Schweigert
4.91 (294)
CURRENTLY 26% OFF !! Best Solution for any Newbie or Expert Trader! This indicator is a unique, high quality and affordable trading tool because we have incorporated a number of proprietary features and a new formula. With this update, you will be able to show double timeframe zones. You will not only be able to show a higher TF but to show both, the chart TF, PLUS the higher TF: SHOWING NESTED ZONES. All Supply Demand traders will love it. :) Important Information Revealed Maximize the potenti
Currency Strength Exotics
Bernhard Schweigert
4.87 (31)
ŞU ANDA %20 INDIRIMLI! Herhangi bir Acemi veya Uzman Tüccar için En İyi Çözüm! Bu Gösterge, Egzotik Çiftler Emtialar, Endeksler veya Vadeli İşlemler gibi herhangi bir sembol için para birimi gücünü göstermek için uzmanlaşmıştır. Türünün ilk örneğidir, Altın, Gümüş, Petrol, DAX, US30, MXN, TRY, CNH vb. gerçek para birimi gücünü göstermek için 9. satıra herhangi bir sembol eklenebilir. Bu benzersiz, yüksek kaliteli ve uygun fiyatlı bir ticaret aracıdır çünkü bir dizi tescilli özelliği ve yeni
Automated Trendlines
Georgios Kalomoiropoulos
5 (16)
Trend çizgileri, forex ticaretinde en önemli teknik analiz aracıdır. Ne yazık ki, çoğu tüccar onları doğru şekilde çizmez. Otomatik Trend Çizgileri göstergesi, piyasaların trend hareketini görselleştirmenize yardımcı olan ciddi tüccarlar için profesyonel bir araçtır. İki tür Trend Çizgisi, Boğa Trend Çizgisi ve Ayı Trend Çizgisi vardır. Yükseliş trendinde, Forex trend çizgisi, fiyat hareketinin en düşük salınım noktalarından geçer. En az iki "en düşük düşük"ü birleştirmek, bir trend çiz
FX Seviyelerini Keşfedin: Ticarette Başarı için Nihai Destek ve Direnç Göstergeniz FX Levels bir destek ve direnç göstergesinden daha fazlasıdır; döviz çiftleri, endeksler, hisse senetleri veya emtialar olsun, tüm ticaret sembollerinde hassasiyet, güvenilirlik ve sorunsuz işlevsellik isteyen ciddi tüccarlar için oyunun kurallarını değiştirir. Kanıtlanmış Lighthouse yöntemi üzerine inşa edilen ve dinamik, gerçek zamanlı uyarlanabilirlik ile geliştirilen FX Levels, hassas kar hedefleri belirleme
Ultimate Dynamic Levels
Hispraise Chinedum Abraham
4.7 (10)
Şu anda tatil indiriminde $399! Fiyatlar gelecekte artabilir. Aşağıdaki açıklamayı okuyun!  Ultimate Sniper Dashboard için EN İYİ Giriş Göstergesi olan Ultimate Dynamic Levels ile tanışın! Son derece Düşük Riskli zamanında girişler ve yüksek RR!!! Ultimate Sniper Dashboard'u BURADA bulabilirsiniz. Hem yeni başlayanlar hem de profesyonel tüccarlar için en önemli yetenek, bir piyasanın tam olarak nereye ve ne zaman dönme olasılığının en yüksek olduğunu ve güvenli bir şekilde nasıl girileceğini
MTF Supply Demand Zones
Georgios Kalomoiropoulos
4.82 (22)
Yeni Nesil Otomatik Arz ve Talep Bölgeleri. Her Grafikte Çalışan Yeni ve Yenilikçi Algoritma. Tüm Bölgeler Piyasanın Fiyat Hareketine Göre Dinamik Olarak Oluşturulmaktadır. İKİ TÜR UYARI --> 1) FİYAT BİR BÖLGEYE ÇIKTIĞINDA 2) YENİ BİR BÖLGE OLUŞTURDUĞUNDA Bir tane daha işe yaramaz gösterge almazsın. Kanıtlanmış Sonuçlarla eksiksiz bir Ticaret Stratejisi elde edersiniz.     Yeni özellikler:     Fiyat Arz/Talep Bölgesine ulaştığında uyarılar     Yeni bir Arz/Talep Bölgesi olu
Bu gösterge paneli, seçilen semboller için mevcut en son harmonik kalıpları gösterir, böylece zamandan tasarruf edersiniz ve daha verimli olursunuz / MT5 sürümü . Ücretsiz Gösterge: Basic Harmonic Pattern Gösterge sütunları Symbol : seçilen semboller görünecektir Trend: yükseliş veya düşüş Pattern : desen türü (gartley, kelebek, yarasa, yengeç, köpekbalığı, cypher veya ABCD) Entry : giriş fiyatı SL: zararı durdur fiyatı TP1: 1. kar alma fiyatı TP2: 2. kar alma fiyatı TP3: 3. kar alma fiya
Fiyat tersine döndükçe ve geri çekildikçe piyasa yapısından elde edilen kâr değişir. Piyasa yapısını tersine çevirme uyarısı göstergesi, bir trendin veya fiyat hareketinin ne zaman tükenmeye yaklaştığını ve tersine dönmeye hazır olduğunu tanımlar. Genellikle bir geri dönüş veya büyük bir geri çekilme meydana gelmek üzereyken meydana gelen piyasa yapısındaki değişiklikler konusunda sizi uyarır. Gösterge, olası bir tükenme noktasının yakınında her yeni yüksek veya düşük oluştuğunda, başlangıçta
Introduction to Fractal Pattern Scanner Fractal Indicator refers to the technical indicator that makes use of the fractal geometry found in the financial market. Fractal Pattern Scanner is the advanced Fractal Indicator that brings the latest trading technology after the extensive research and development work in the fractal geometry in the financial market. The most important feature in Fractal Pattern Scanner is the ability to measure the turning point probability as well as the trend probabi
CyberZingFx Trend Reversal
Afsal Meerankutty
4.18 (17)
NEW YEAR SPECIAL DISCOUNT RUNNING NOW 40% DISCOUNT Price slashed from $149 to $89 until 3rd Jan 2025 Indicator captures the trend reversals with no-repaint Buy and Sell Arrow signals. CyberZingFx Trend Reversal Indicator - your go-to solution for accurate and reliable trend reversal signals. With its  advanced trading strategy , the indicator offers you Buy and Sell Arrow signals that do not repaint, making it a reliable tool for catching Swing Highs and Swing Lows in any market and any time fr
Volume by Price MT4
Brian Collard
4.6 (10)
The Volume by Price Indicator for MetaTrader 4 features Volume Profile and Market Profile TPO (Time Price Opportunity). Volume and TPO histogram bar and line charts. Volume Footprint charts. TPO letter and block marker collapsed and split structure charts. Static, dynamic and flexible range segmentation and compositing methods with relative and absolute visualizations. Session hours filtering and segment concatenation with Market Watch and custom user specifications. Graphical layering, positio
Gann Swing Structure
Kirill Borovskii
5 (1)
This indicator is based on the mathematics of the great trader W.D. Ganna. With its help, you can easily find strong levels by analyzing swings to find the optimal entry point. The indicator works on all instruments and all timeframes. The indicator is fully manual and has control buttons. All you need to do is press the NEW button, a segment will appear, which you can place on any movement, swing or even 1 candle that you want to analyze. By placing the segment, press the OK button. A grid (th
TheStrat Monitor
Robert Gerald Wood
3 (2)
If you've not already learnt about The Strat trading strategy , go google it now. I promise it won't be a waste of your time, and you will likely learn some new tricks whether you use it or not. OK, so now you know what TheStrat is, you will be able to understand what this indicator can do for you. Key Features In short, the Indicator will: Show Timeframe Continuity for all supported timeframes Supports two timeset views, Day trader and Swing trader Show when Full Timeframe Continuity is in pl
This indicator is a too that : calculates position size based on account balance/equity , currency pair, given entry level, stop-loss level and risk tolerance (set either in percentage points or in base currency). It displays reward/risk ratio based on take-profit. Shows total portfolio risk based on open trades and pending orders. Calculates margin required for new position, allows custom leverage.                
FX Dynamic - İhtiyacınız Olan Tek ATR Göstergesi Ticaret stratejilerinizi benzersiz bir hassasiyet ve içgörü ile güçlendirmeye hazır mısınız? Döviz bazlı analiz ve brokerların GMT değişimleri için otomatik ayarlama için tasarlanmış ilk ve tek ATR göstergesi olan FX Dynamic ile tanışın. Modası geçmiş araçlara veda edin ve piyasa oynaklığında ustalaşmak için nihai çözümü benimseyin. FX Dynamic Neden Oyunu Değiştiriyor? Para Birimi Tabanlı ATR Analizi - Geleneksel araçlardan kurtulun. FX Dynam
Enigmera
Ivan Stefanov
5 (3)
ENIGMERA: Pazarın çekirdeği https://www.enigmera.com Giriş Bu gösterge ve ticaret sistemi, finansal piyasalar için dikkate değer bir yaklaşımdır. ENIGMERA, destek ve direnç seviyelerini doğru bir şekilde hesaplamak için fraktal döngüleri kullanır. Gerçek birikim aşamasını gösterir ve yön ve hedefler verir.  İster bir trendde ister bir düzeltmede olalım çalışan bir sistem.  Nasıl çalışır? ENIGMERA üç çizgiden oluşur: destek/direnç çizgisi, hedef çizgisi ve sapma çizgisi. Sistem, geçmiş veril
Yazarın diğer ürünleri
SW Scalper EA SW Scalper is a fully automated Expert Advisor based on scalping when indicated the market makes a fast movement. It uses smart algorithms to open any trade.Also this system come with very smart Money Management code and not like other Expert Advisor with this ea you will cant use fixed lot to trade. You must use the very smart Money Management system inside this ea to open any trade, you will need only to put your risk and the system will do all other job for you. And if you put
Engulfing Dashboard is a forex system that can help you generate forex profits easily without having to work hard to learn forex knowledge because this Dashboard is complete with all the facilities and functions that are sophisticated and effective. This system is made based on Supply and Demand techniques to measure Market Direction (trend) more accurately than using indicators such as Moving Average, MACD, trendline and so on. It is made using a certain formula so that the accuracy of the m
Winner Overbought Oversold Winner Overbought Oversold indicators are best suited for overbought/oversold analysis. Basically, there are two types of momentum oscillators: bound and unbound. Bound oscillators, such as this, fluctuate within a specific range. The most popular indicators used to identify overbought and oversold conditions are the   relative strength index (RSI)   and the   stochastic oscillator . But you need a second conformation for entry and exit position from forex market.
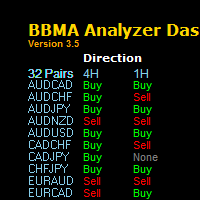
" The one of keys to trading success is a System Technique , MUST HAVE THIS SYSTEM!" BBMA Analyzer Dashboard BBMA is a popular technique that uses a combination of 2 indicators in MetaTrader 4 or MT4 which using Bollinger Band and Moving Average Indicator. Summary of BBMA Techniques has the basic elements: RE-ENTRY Formed after fall or price increase. Price will form a Sideway to enable Re-Entry. CSAK (Strong Direction Candle) The strong direction candle is a close candle directio
MHV Grid EA The  MHV Grid  EA uses the RSI indicator to enter the trade. To enter BUY, the RSI must cross the bottom up the value specified in the EA parameters (for the sales, on the contrary, cross from top to bottom). In case of a successful entry, the transaction closes either according to Trailing Stop is used. If the market goes in opposite direction, the order grid opens at a specified distance from the average price of the grid. Also, newly opened orders can be filtered using Bollin
William Intraday   This pure TREND  system is based on Price Action and Williams Percent Range Indicators. The EA has an innovative signal filter and adaptive trailing stop. Always sets Stop Loss and Take Profit to protect the deposit. This EA works best in pair EURUSD Timeframe for run this EA is best is H1 * No toxic or margin hugging technique, like Martingale, Averaging, Gridding, Zone Recovery Strategy.
Fibo Sequence EA The EA Strategy: This EA strategy is based on Fibonacci Sequence number Calculations to produce it's own signals and trade automatically. It was built for those traders who loves and trust Fibonacci Levels. In finance, Fibonacci level is a method of technical analysis for determining support and resistance levels. They are named after their use of the Fibonacci sequence.  Fibonacci is based on the idea that markets will retrace a predictable portion of a move, after which they
Various Trailing Manager EA Various Trailing Manager EA is a professional trader's tool that provides protection of floating profit on open trades. This EA Utility allows you to manage (with advanced filtering) unlimited open orders (manual or EA) with trailing stops based on 7 methods: percent, ATR, Moving Average, Candle, Parabolic, Fractal. The trailing stop can be either real or virtual, and you can exit fully or with a partial close percent on touch or bar close. Visualize all orders and
Supply and Demand Dashboard Supply and Demand Dashboard is a forex system that can help you generate lucrative profits from forex easily without having to work hard to learn forex knowledge because this Dashboard is complete with all the needs and functions that are sophisticated and effective for a forex trader. This system is made based on Supply and Demand techniques to measure Market Direction (trend) more accurately than using indicators such as Moving Average, MACD, trendline and so
EagleEye is an automated trading system that uses a indicator and price action to open and close trades. Trades every day at a full time. Every trade has Stop Loss from very beginning, and they do not change. This is for those, who are looking for steady and stable growth over the long run. The EA works according to the "Trend Follow" strategy, which means following the trend. Doesn't use grid, martingale or other dangerous money management methods. Timeframe H1, currency pairs EURUSD, GBPU
The Burst MT4
Mhd Amran Bin Lop
The Burst MT4 Hurry and Buy Before Price Doubles Tomorrow! *Non-Repainting Indicator "The Burst" is an indicator that shows precise Buy and Sell Trades. A great arsenal to add to any chart. It's Best to Use The D1,H4 or H1 chart "The Burst" is designed to alert BUY and SELLS. So Of course, For the best take The Arrows In a Uptrend or Downtrend Only For Confirmation *Non-Repainting *For Desktop MT4 Only *Great For Scalping *Great For Intraday *Great For Swing Trading *Arrow Appears at  The "Clo
Star Forecast
Mhd Amran Bin Lop
Star forecast is an analytical toolkit used to help currency traders with foreign exchange trading analysis through technical charts and indicators. Forex forecasting which help analysts and traders to determine appropriate and profitable entry and exit points for their forex trades. *Non-Repainting *For Desktop MT4 Only *Great For Intraday *Great For Swing Trading *Star Appears at  The "Close Of The Candle" *Attach On H1 Timeframe for see Daily Trend *Works On Any Mt4 Pair *Perfect For New Tr
The Engulfing candlestick setup has a strong reversal character. If the price is increasing and an Engulfing pattern is created on the way up, this gives us a signal that a top might be forming now. The opposite is in force too. If the price is decreasing and an Engulfing pattern appears on the chart, this suggests that the price action might be forming a bottom. ONLY 4 COPIES OUT OF 10 LEFT AT $98 ! After that, the price will be raised to $289. Pure Engulfing EA   it is a fully automated “Engul
TripleStar Trend Indicator, Breakthrough Solution For Trend Trading And Filtering With All Important trend Tool Features Built Inside One Tool!    This is a custom MT4 ( Metatrader 4 ) indicator that analyzes the trend and volatility analyzer indicator.  In addition, It identifies the beginning and the end of the trend that works for most currency pairs and timeframes. The Trend Monitor indicator is using an optimized formula based on momentum  to calculate the trend volatiltiy. Our indicator
DepthTrendView
Mhd Amran Bin Lop
DepthTrendView is an indicator that is used to see the direction of the market very clearly compared to the indicators that are commonly used by many people. What is interesting about this indicator is that you can see the direction of the trend and also know that the market is at the end or that the market wants to start a new trend. How to Use: 1- To see the earliest BUY direction you need to see previous candle below Aqua Line before green arrow appear. 2- To see the earliest SELL dire
Filtrele:
İnceleme yok
İncelemeye yanıt