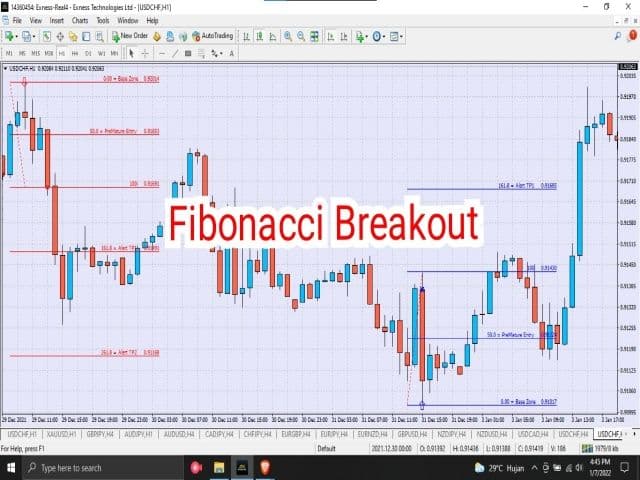
Fibonacci Breakout
- Göstergeler
- Agus Putu Gede Wira Adnyana
- Sürüm: 1.0
- Etkinleştirmeler: 5
Fibonacci Breakout, Fibonacci düzeltmesini kullanan bir ticaret stratejisidir. Bu teknik aslında trendin başlangıcına girmemizi sağlayan bir tekniktir. Yeni başlayanlar için bile anlaşılması çok kolay.
Strateji, otomatik özel fibonacci'nin görünmesini beklemeniz ve ardından bekleyen siparişinizi manuel olarak vermeniz, zararı durdurmanız ve Fibonacci seviyesinde kar elde etmenizdir. Fiyat başarılı bir yeniden test yaptığında pozisyon açılacaktır. Fibonacci Breakout Forex, Crypto ve hisse senetleri için uygundur.
Fibonacci Koparma Seviyesi detayları:
1- Ticareti İzleyin = 0 (zarar durdurma seviyesi olabilir)
2- Giriş Bölgeleri = 0,50 – 1.00 (Fiyat Bölge İçi Olduğunda Giriş)
3- Kar Bölgeleri Alın
TP 1 = 1.618
TP2 = 2.618
TP3 = 4.236
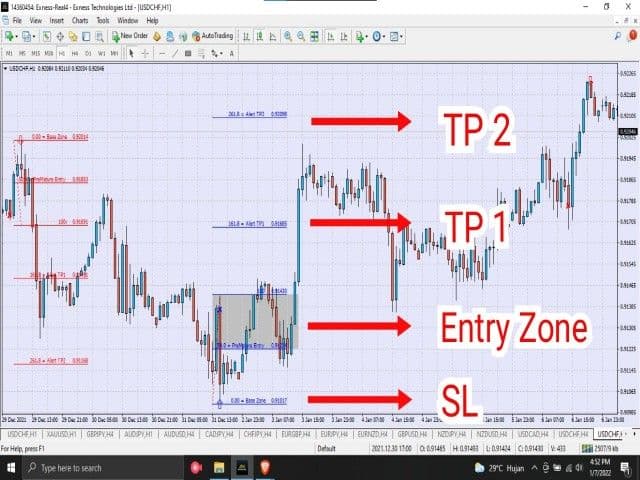
STANDART İŞLETİM PROSEDÜRÜ (SOP)
• SÇP çok basit ve anlaşılması kolaydır. Sistem aşağıdakilerin varlığını belirleyecektir:
1. İlk Kırılma (IB) veya Baskın Kırılma (DB)
2. Mum Arası 1 (CB1) - X sembolünün mavi veya kırmızı rengiyle işaretlenmiştir (Aslında önceki ABC modelinin B noktası)
3. Tekrar Test Et (Fibonacci seviyesi 0.50 – 1.00)
• 3 koşul karşılandığında SÇP tamamlanır. Giriş bölgesi (EZ), kar (TP) seviyesi ve stoploss seviyesi (SL) vermek için Fibonacci grafikte görünecektir.
• SOP ve Para Yönetimi bu basit kuralı takip ederse, başarılı bir ticaretin olasılığı yüksek yüzdelik dilimdedir ( >%80 ).
• Asla piyasanın gidişatına karşı ticaret yapmayın. Her zaman SOP'yi bekleyin.
• Takas Takibi seviyesinin üzerinde hiçbir CS kapatılmadığı sürece SOP geçerlidir.
• Gün İçi için 1H ve 4H zaman aralığını tavsiye edin. Scalping'i seviyorsanız, Timeframe 5M'yi kullanabilirsiniz.
BASİT İPUÇLARI ;
1. Tutarlı bir kâr için her zaman TP 1 seviyesinde kâr elde edin.
2. Grafikte sola bakın, eğer fiyat TP 2 veya TP 3'ü vurursa, genellikle tamamlanmış trend döngüsü (geri dönüş süresi), bu nedenle bu bölgelerde giriş noktası da olabilir.
3. Trendi daima daha yüksek zaman dilimlerinde otomatik fibonacci ile kontrol edin.
Gösterge, 1:4'e kadar risk ve ödülle piyasadaki en iyi fırsatları bulmanıza yardımcı olabilir. bu size ay sonunda birikmiş kar sağlayacaktır.
sadece ticaret planınız ve para yönetiminiz konusunda disiplinli olmanız gerekiyor. ticaret yüksek riskli bir iştir. Profesyonel bir tüccar olarak tüm riskler sizin sorumluluğunuzdadır.

I purchased the indicator because I am always looking for something that may help with Fibonacci. There is not much direction on how the indicator works other than a few pictures. The Vendor says he has no instructional videos at the moment. I say this because the inputs are not your general inputs, but have many options to consider. (which I appreciate but am even more confused) I will have to come back at a later time to update. Right now I have it on the AudJpy 5M chart and not sure what it is doing. I have an red X that turned to a green X. Still hoping for a video with instructions. One of the other concerns is the indicator does not display the 38.2 nor the 61.8. It does have the 50 and the 78.6. Thank you.