• Genel bakış
  • İncelemeler
  • Yorumlar

Pivot point scanner

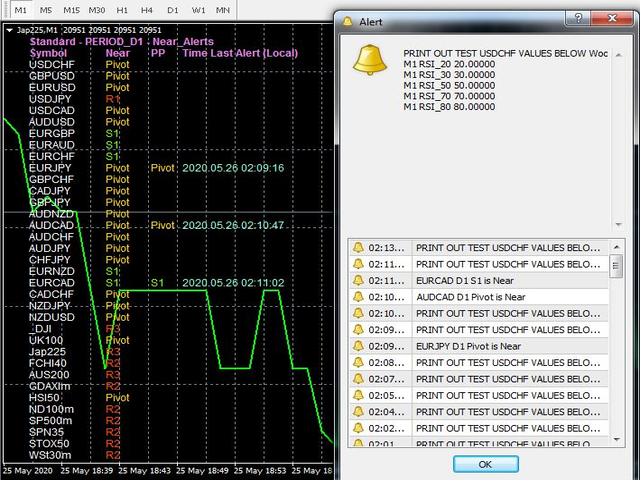
This Scanner will help you to get Pivot points , Resistance and Support Points on the Symbols in your watchlist, using this and the best part is it give alert in all format whether its a e-mail, or Phone Notification alert, or Pop-up Alerts. 

There are multiple points as :

1) Standard Pivot Points

2) Fibonacci Pivot points 

3) Camarilla Pivot points 

4) Woddie Pivot points.

5) Bollinger Bands.


Type of Alerts are :

1) Cross Alert.

2) Near_Alert.

3) Cross and Bounce Alert.

4) Bounce only Alert.


Ps: This is really easy to use all input values as Yes or No. sometimes use dropdown too.


Önerilen ürünler
FinArk Support and Resistance is an indicator that will detect support and resistance zone that are drawn on the chart by automatic. Supply Demand uses previous price action to identify potential imbalances between buyers and sellers. This trend detection indicator will compliment any strategy and can also be used as an independent tool.  We can enter in good price with this Indicator, in order to follow the   strong demand   on the current instrument. 
Best indicator for trend reversals Can be optimized for crypto trading or all currency pairs How to use:When the arrow appears, wait for the candle to close and open the order Level lines appear when candle closes,  The system shows you the best entry levels It is simple and easy to use, no additional settings are required. Best indicator for beginners and professionals You can set the displayed stop loss and desired profit levels. You can use it alone or in addition to your strategy. Recommend
Rira Renko
Vitor Palmeira Abbehusen
RENKO on Time Chart This indicator is an enhanced Renko, so you can watch the Renko bricks on the chart to understand price movement more clearly the other improvement is automated box size according to ATR (Average True Range) period you can set the ATR number as you want and the box size of Renko changes automatically based on price movement Inputs Mode: Box size is the input to specify the size of the Renko box you want to print on the chart. This input lets you choose the fixed b
Bu, bir mumun kapanış fiyatını tahmin eden bir göstergedir. Gösterge öncelikle D1 çizelgelerinde kullanılmak üzere tasarlanmıştır. Bu gösterge hem geleneksel forex ticareti hem de ikili opsiyon ticareti için uygundur. Gösterge, bağımsız bir ticaret sistemi olarak kullanılabilir veya mevcut ticaret sisteminize ek olarak hareket edebilir. Bu gösterge, mevcut mumu analiz ederek mumun gövdesi içindeki belirli güç faktörlerini ve önceki mumun parametrelerini hesaplar. Böylece gösterge, piyasa hareket
The indicator allows you to trade binary options. The recommended time frame is М1 and the expiration time is 1,2,3 minutes. The indicator suitable for auto and manual trading. A possible signal is specified as a arrows above/under a candle. You should wait until the candle closes! Arrows are not re-painted Trade sessions: TOKYO section (Half-end) Currency pairs: USD/JPY Working time frame: M1 Expiration time: 1,2,3 minutes. The indicator also shows good results when using the martingale strateg
FREE
VR Cub
Vladimir Pastushak
VR Cub , yüksek kaliteli giriş noktaları elde etmenin bir göstergesidir. Gösterge, matematiksel hesaplamaları kolaylaştırmak ve bir pozisyona giriş noktalarının aranmasını basitleştirmek için geliştirildi. Göstergenin yazıldığı ticaret stratejisi uzun yıllardan beri etkinliğini kanıtlamaktadır. Ticaret stratejisinin basitliği, acemi yatırımcıların bile başarılı bir şekilde ticaret yapmasına olanak tanıyan büyük avantajıdır. VR Cub, pozisyon açılış noktalarını ve Kâr Al ve Zararı Durdur hedef sev
This is a Multi-currency multi-timeframe Support/Resistance Scanner Dashboard for Metatrader 4 (MT4) platform. Get all extras and download free demo here: https://abiroid.com/product/abiroid-support-resistance-scanner Read detailed description in post above. Features: Scan Support/Resistance zones (also called Supply/Demand zones) Show alert when price is inside these zones and highlights the pair/timeframe Show or hide SR zones price nearest to current price (Price_Close) Show or hide cur
Trend Ray
Andriy Sydoruk
The indicator shows the potential trend direction by cyclical-wave dependence. Thus, all the rays of the intersection will be optimal rays, in the direction of which the price is expected to move, taking into account the indicator period. Rays can be used as a direction for potential market movement. But we must not forget that the approach must be comprehensive, the indicator signals require additional information to enter the market.
Awesome Oscillator by Bill Williams with the ability to fine-tune and replace the averaging algorithms of the indicator, which significantly expands the possibilities of using this oscillator in algorithmic trading and brings it closer in its properties to such an indicator as the MACD. To reduce price noise, the final indicator is processed with an additional Smooth averaging. The indicator has the ability to give alerts, send mail messages and push signals when the direction of movement of th
MQLTA Support Resistance Lines is an indicator that calculates the historical levels of Support and Resistance and display them as Lines on chart. It will also Alert you if the price is in a Safe or Dangerous zone to trade and show you the distance to the next level. The indicator is ideal to be used in other Expert Advisor through the iCustom function. This DEMO only works with AUDNZD, the full product can be found at https://www.mql5.com/en/market/product/26328 How does it work? The indicato
FREE
FiboZag
Andriy Sydoruk
Indicator FiboZag - transfer the indicator to the chart and the Fibonacci levels will be built automatically on the last ZigZag turn. The main advantage lies in the correct construction of Fibonacci levels and markup of price levels. Simple, visual and effective use. The indicator is not redrawn and does not lag. Works on all currency pairs and on all timeframes.
NOTE: PRICE WILL RISE VERY SOON. DON'T SKIP THIS OFFER! Dear traders I am glad to introduce the " Market Swing Scanner Board" indicator to you. This indicator was made mainly to be used in combination with the Market Swing Index Indicator. You use the  "Market Swing Scanner Board"  indicator to scan for trading opportunities on the  Market Swing Index Indicator . This tool is designed for serious traders who have decided to make a difference through trading. Be the next person to witness this st
GJ OPTIONS USES THE TREND WAVE INDICATOR AND IT CAN IDENTIFY THE BEGINNING AND THE END OF A NEW WAVE TREND MOVEMENT. AS AN OSCILLATOR, THE INDICATOR IDENTIFIES THE OVERBOUGHT AND OVERSOLD ZONES. IT WORKS GREAT TO CATCH THE SHORT TERM PRICE REVERSALS AND USES A MARTINGALE STRATEGY TO CLOSE ALL TRADES IN PROFIT. USE DEFAULT SETTINGS ON H1 OR HIGHER TIME FRAME ON ANY PAIR FOR MORE ACCURATE TRADES WHY THIS EA : Smart entries calculated by 5 great strategies The EA can be run on even a $20000 account
This product is a part of  ON Trade Waves Patterns Harmonic Elliot Wolfe you can test free version on EURJPY from this link  Wolf Waves Indicator Kurt Dalgalarını Keşfedin - En İyi Ticaret Aracınız! Herhangi bir zaman diliminde Kurt Dalgalarını kolayca tespit etmek için güçlü bir araç mı arıyorsunuz? Daha fazla aramayın! Kurt Dalgaları göstergemiz bu işi zahmetsizce halleder. İşte neden sizin için mükemmel olduğunu anlatıyoruz: Ana Özellikler: Otomatik Algılama:   Kurt Dalgaları göstergemiz
Indicator can drawing Support Level (Lowest price of choosed Time Frame) and Resistance Level (Highest price of choosed Time Frame), and this indicator can drawing last of Pivot Level from the Last of Support Resistance Level. Support and Resistance based Highest and Lowest at choosed Time Frame can be your next good experience for your forex trade to maximize your trade win and lost ratio. Parameter : _S_and_R__Setup_ ,          Default is   # SUPPORT AND RESISTANT # , No Need To Change Drawi
KT Renko Patterns MT4
KEENBASE SOFTWARE SOLUTIONS
2.33 (3)
KT Renko Patterns scans the Renko chart brick by brick to find some famous chart patterns that are frequently used by traders across the various financial markets. Compared to the time-based charts, patterns based trading is easier and more evident on Renko charts due to their uncluttered appearance. KT Renko Patterns features multiple Renko patterns, and many of these patterns are extensively explained in the book titled Profitable Trading with Renko Charts by Prashant Shah. A 100% automate
KT Auto Trendline MT4
KEENBASE SOFTWARE SOLUTIONS
KT Auto Trendline draws the upper and lower trendlines automatically using the last two significant swing highs/lows. Trendline anchor points are found by plotting the ZigZag over X number of bars. Features No guesswork requires. It instantly draws the notable trendlines without any uncertainty. Each trendline is extended with its corresponding rays, which helps determine the area of breakout/reversal. It can draw two separate upper and lower trendlines simultaneously. It works on all timefr
Trend PA
Mikhail Nazarenko
5 (3)
The Trend PA indicator uses   Price Action   and its own filtering algorithm to determine the trend. This approach helps to accurately determine entry points and the current trend on any timeframe. The indicator uses its own algorithm for analyzing price changes and Price Action. Which gives you the advantage of recognizing, without delay, a new nascent trend with fewer false positives. Trend filtering conditions can be selected in the settings individually for your trading style. The indicator
YK-Fibo Pivot Indicator: Trade Smarter with Fibonacci Pivot Points The YK-Fibo Pivot Indicator is a powerful technical analysis tool that combines the precision of Fibonacci retracements with the insights of Pivot Points. Whether you're a novice or seasoned trader, this indicator empowers you to spot profitable opportunities in the market with ease. Why Choose YK-Fibo Pivot? Pinpoint Support & Resistance: By calculating Fibonacci levels based on the previous day's high, low, and close prices, y
KT Horizontal Lines MT4
KEENBASE SOFTWARE SOLUTIONS
In MetaTrader, plotting multiple   horizontal lines   and then tracking their respective price levels can be a hassle. This indicator automatically plots multiple horizontal lines at equal intervals for setting price alerts, plotting support and resistance levels, and other manual purposes. This indicator is suitable for Forex traders who are new and looking for chances to make quick profits from buying and selling. Horizontal lines can help traders find possible areas to start trading when the
Statistical Trend Indicator is an advanced custom indicator designed to analyze market movements and provide traders with calculated probabilities of upward or downward trends. By analyzing historical price data over a specified lookback period, this indicator computes the likelihood of the market continuing in either direction, offering traders a statistical edge in decision-making. Key Features: Probability Display: It calculates and displays the percentage probabilities of an upward or dow
Custom Pivots
Tsvetan Tsvetanov
4 (4)
Pivots Points are significant levels traders can use to determine directional movement, support and resistance. Pivot Points use the prior period's high, low and close to formulate future support and resistance. In this regard, Pivot Points are predictive and leading indicators. Pivot Points were originally used by floor traders to set key levels. Floor traders are the original day traders. They deal in a very fast moving environment with a short-term focus. At the beginning of the trading day,
Visual guide which divides the 24 hours into three trading sessions. The default setting is to show   Asian ,   London   and   New York   sessions. But, the session start and end hours can be adjusted as required.  The indicator is useful to develop trading strategies by making it easy to see the market behavior during the three sessions.  Inputs Time Zone Start and End hours (Please provide values in HH:MM format, like 02:00, not like 2:00. Both the hours and minutes should have 2 digits)
This indicator was created to detect possible changes in direction of the market. Inside bars points to a certain level of indecision coming into the market. Neither side, buyers and sellers, have been able to push the price further up or down resulting in indecision. We can use this indicator to monitor for inside bar setups and having the indicator signaling the setup to the trader by alert, notification, it provides the trader with a starting point for his/her trading plan. The validation for
Optimal StopLoss Finder
Hispraise Chinedum Abraham
Optimal Stoploss BulucuSabit stoploss gibi normal popüler stoploss tekniklerini kullanmak veya bunları önceki en yüksek ve en düşük seviyelerin altına yerleştirmek birkaç nedenden dolayı dezavantajlıdır:1. Brokerlar bu alanları zaten biliyorlar, bu yüzden almaları kolay 2. Bir piyasada her zaman sabit bir stoploss kullanamazsınız, çünkü farklı zamanlarda gerçekten geniş veya gerçekten zayıf olabilir ve ya piyasadan daha az alırsınız ya da hızlı bir şekilde durdurulmak için kendinizi aşırı maruz
Fibonacci retracement and extension line drawing tool Fibonacci retracement and extended line drawing tool for MT4 platform is suitable for traders who use  golden section trading Advantages: There is no extra line, no too long line, and it is easy to observe and find trading opportunities Trial version: https://www.mql5.com/zh/market/product/35884 Main functions: 1. Multiple groups of Fibonacci turns can be drawn directly, and the relationship between important turning points
Simple and powerful CSM (Currency Strength Meter) Currency strength meter is the indicator you need to identify the current actual trend based on a unique calculation, which is generally used as another fundamental analysis for those who are not capable of reading the fundamental clearly. Currency strength meter will read the current strength of related currency pair (Forex) where generally consist of AUD, NZD, CAD, CHF, JPY, EUR, GBP, and USD for the main major currency. Feature Easy reading
This support and resistance indicator gives u a)support level b)resistance level c)direction(trend) all in one.The indicator is based on the top 3 best levels there are!Red dots are sell direction and green dots are buy direction,if candles dont break these levels u get in after the 3rd dot,always use higher time frames from h1 up so its more clear where direction is going,also u can set the indicator to your time frame that u are lookin at.
FIBOChannels
Hafis Mohamed Yacine
Fibonacci Channel What is a Fibonacci Channel? The Fibonacci channel is a technical analysis tool that is used to estimate support and resistance levels based on the Fibonacci numbers. It is a variation of the Fibonacci retracement tool, except with the channel the lines run diagonally rather than horizontally. It can be applied to both short-term and long-term trends, as well as to uptrend and downtrends. Lines are drawn at 23.6, 38.2, 50, 61.8, 78.6, 100, 161.8, 200, 261.8, 361.8 and 423.6
The indicator uses a mechanical approach to identify resistance/support zones and assess their levels of strength showing which price zones are more important than others. Resistance and Support are the main leading indicators used by most traders around the world. To be a successful trader, every trader needs to master the proper detection of price zones. This indicator was created to avoid subjectivity rules when drawing support/resistance zones. Most of the time, resistance and support are no
Bu ürünün alıcıları ayrıca şunları da satın alıyor
Gann Made Easy
Oleg Rodin
4.85 (82)
Gann Made Easy , bay teorisini kullanarak ticaretin en iyi ilkelerine dayanan, profesyonel ve kullanımı kolay bir Forex ticaret sistemidir. WD Gann. Gösterge, Zararı Durdur ve Kâr Al Seviyeleri dahil olmak üzere doğru SATIN AL ve SAT sinyalleri sağlar. PUSH bildirimlerini kullanarak hareket halindeyken bile işlem yapabilirsiniz. Lütfen satın aldıktan sonra benimle iletişime geçin! Alım satım ipuçlarımı ve harika bonus göstergelerini ücretsiz olarak sizinle paylaşacağım! Muhtemelen Gann ticaret y
- Real price is 80$ - 40% Discount ( It is 49$ now ) Contact me for instruction, add group and any questions! Related Product:  Bitcoin Expert , Gold Expert Introduction The breakout and retest strategy is traded support and resistance levels. it involves price breaking through a previous level.  The break and retest strategy is designed to help traders do two main things, the first is to avoid false breakouts. Many false breakouts start with a candlestick that breaks out of a level but ends wi
TPSproTREND PrO
Roman Podpora
4.79 (19)
TPSpro TREND PRO,   piyasayı otomatik olarak analiz eden, trend ve değişimlerinin her biri hakkında bilgi sağlayan, ayrıca yeniden çizmeden işlemlere girme sinyalleri veren bir trend göstergesidir! Gösterge her mumu ayrı ayrı analiz ederek kullanır. farklı dürtülere atıfta bulunur - yukarı veya aşağı dürtü. Para birimleri, kripto paralar, metaller, hisse senetleri ve endeksler için işlemlere tam giriş noktaları! Sürüm MT5                   GÖSTERGENİN TAM AÇIKLAMASI       Bunu -   RFI SEVİYELER
Gold Stuff
Vasiliy Strukov
4.89 (240)
Gold Stuff, özellikle altın için tasarlanmış bir trend göstergesidir ve herhangi bir finansal enstrümanda da kullanılabilir. Gösterge yeniden çizilmez ve gecikmez. Önerilen zaman dilimi H1. Bu göstergede tam otomatik Uzman Danışman EA Gold Stuff çalışır. Profilimde bulabilirsiniz. Ayarları ve kişisel bir bonusu almak için satın alma işleminden hemen sonra benimle iletişime geçin!  Güçlü Destek ve Trend Tarayıcı göstergemizin ücretsiz bir kopyasını pm'den alabilirsiniz. Ben! AYARLAR Ok Ç
FX Volume
Daniel Stein
4.58 (33)
Sabah Brifingimiz aracılığıyla ayrıntılar ve ekran görüntüleri ile günlük piyasa güncellemenizi alın burada mql5 ve on Telegram ! FX Volume, bir brokerin bakış açısından piyasa duyarlılığı hakkında GERÇEK bir fikir veren İLK ve TEK hacim göstergesidir. COT raporlarından çok daha hızlı bir şekilde, brokerlar gibi kurumsal piyasa katılımcılarının Forex piyasasında nasıl konumlandıklarına dair harika bilgiler sağlar. Bu bilgileri doğrudan grafiğinizde görmek, ticaretiniz için gerçek oyun değiştir
Şu anda %20 İNDİRİMLİ! Herhangi bir Acemi veya Uzman Tüccar için En İyi Çözüm! Bu gösterge paneli yazılımı 28 döviz çifti üzerinde çalışıyor. Ana göstergelerimizden 2'sine (Gelişmiş Para Birimi Gücü 28 ve Gelişmiş Para Birimi Dürtüsü) dayanmaktadır. Tüm Forex piyasasına harika bir genel bakış sağlar. Gelişmiş Para Birimi Gücü değerlerini, para birimi hareket hızını ve tüm (9) zaman dilimlerinde 28 Forex çifti için sinyalleri gösterir. Trendleri ve / veya scalping fırsatlarını belirlemek içi
Scalper Inside PRO
Alexey Minkov
4.73 (56)
An exclusive indicator that utilizes an innovative algorithm to swiftly and accurately determine the market trend. The indicator automatically calculates opening, closing, and profit levels, providing detailed trading statistics. With these features, you can choose the most appropriate trading instrument for the current market conditions. Additionally, you can easily integrate your own arrow indicators into Scalper Inside Pro to quickly evaluate their statistics and profitability. Scalper Inside
TPSpro RFI Levels
Roman Podpora
4.82 (22)
TALİMATLAR         RUS   -        ENG       Bir gösterge ile kullanılması   önerilir       -       TPSpro   TREND PRO -   Sürüm MT4         Ticarette önemli bir unsur, bir ticaret aracını satın alma veya satma kararlarının alındığı bölgeler veya seviyelerdir. Büyük oyuncuların piyasadaki varlıklarını gizleme girişimlerine rağmen, kaçınılmaz olarak izler bırakırlar. Bizim görevimiz bu izleri nasıl tanımlayacağımızı ve doğru şekilde nasıl yorumlayacağımızı öğrenmekti. Ana işlevler:: Satıcılar ve
Trend Punch
Mohamed Hassan
4.95 (19)
This indicator is unstoppable when combined with our other indicator called  Support & Resistance . After purchase, send us a message and you will get it   for  FREE as a BONUS! Introducing Trend Punch , the revolutionary forex trend indicator that will transform the way you trade! Trend Punch is uniquely designed to provide precise buy and sell arrows during strong market trends, making your trading decisions clearer and more confident. Whether you're trading major currency pairs or exotic sym
FX Power MT4 NG
Daniel Stein
5 (13)
Sabah Brifingimiz burada mql5 ve on Telegram! FX Power MT4 NG , uzun zamandır çok popüler olan döviz gücü ölçerimiz FX Power'ın yeni neslidir. Peki bu yeni nesil güç ölçer ne sunuyor? Orijinal FX Power hakkında sevdiğiniz her şey PLUS GOLD/XAU güç analizi Daha da hassas hesaplama sonuçları Ayrı ayrı yapılandırılabilir analiz dönemleri Daha da iyi performans için özelleştirilebilir hesaplama limiti Özel çokluDaha fazlasını görmek isteyenler için örnek ayarlar Her grafikte en sevdiğiniz renkler i
ÜRÜNÜ SATIN ALMADAN ÖNCE LÜTFEN AŞAĞIDAKİ BİLGİLERİ OKUYUNUZ! Apollo Pips PLUS SP benzersiz bir üründür! YENİ "APOLLO PIPS" GÖSTERGEMİ ARTI TÜM İŞLEM GÖSTERGELERİME ERİŞİM İLE "SÜPER PAKET" BONUSUNU ALMAK İSTEYENLER İÇİN! Apollo Pips PLUS SP ürününü satın alarak aslında Apollo Pips göstergemin tamamen yeni bir versiyonunu satın almış oluyorsunuz. Göstergenin bu sürümü, geliştirilmiş bir algoritmaya ve kullanımı kolay bir parametreye sahiptir; bu, size göstergeyi herhangi bir piyasada ve herhangi
Gold Channel is a volatility-based indicator, developed with a specific timing algorithm for the XAUUSD pair, which consists of finding possible corrections in the market. This indicator shows two outer lines, an inner line (retracement line) and an arrow sign, where the theory of the channel is to help identify overbought and oversold conditions in the market. The market price will generally fall between the boundaries of the channel. If prices touch or move outside the channel it is a tra
Trend Screener
STE S.S.COMPANY
4.81 (88)
Trend Göstergesi, Trend Alım Satım ve Filtreleme için Çığır Açan Benzersiz Çözüm, Tüm Önemli Trend Özellikleriyle Tek Bir Araç İçinde Yerleştirildi! Forex, emtialar, kripto para birimleri, endeksler ve hisse senetleri gibi tüm sembollerde/araçlarda kullanılabilen %100 yeniden boyamayan çoklu zaman çerçevesi ve Çoklu para birimi göstergesidir. SINIRLI SÜRELİ TEKLİF: Destek ve Direnç Tarama Göstergesi sadece 50$ ve ömür boyu mevcuttur. (Orijinal fiyat 250$) (teklif uzatıldı) Trend Screener, grafik
Atomic Analyst
Issam Kassas
5 (2)
Öncelikle belirtmek gerekir ki bu Ticaret Göstergesi Yeniden Çizim Yapmaz, Gecikmez ve Gecikme Göstermez, bu da hem manuel hem de robot ticareti için ideal hale getirir. Kullanıcı kılavuzu: ayarlar, girişler ve strateji. Atom Analisti, Piyasada Daha İyi Bir Avantaj Bulmak İçin Fiyatın Gücünü ve Momentumunu Kullanan PA Fiyat Hareketi Göstergesidir. Gürültüleri ve Yanlış Sinyalleri Kaldırmaya ve Ticaret Potansiyelini Artırmaya Yardımcı Olan Gelişmiş Filtrelerle Donatılmıştır. Birden fazla katma
Öncelikle, bu Ticaret Aracının Non-Repainting, Non-Redrawing ve Non-Lagging Gösterge olduğunu vurgulamakta fayda var, bu da onu profesyonel ticaret için ideal hale getiriyor. Çevrimiçi kurs, kullanıcı kılavuzu ve demo. Akıllı Fiyat Hareketi Kavramları Göstergesi, hem yeni hem de deneyimli tüccarlar için çok güçlü bir araçtır. İleri ticaret fikirlerini, Inner Circle Trader Analizi ve Smart Money Concepts Ticaret Stratejileri gibi 20'den fazla kullanışlı göstergeyi bir araya getirerek bir araya g
Currency Strength Exotics
Bernhard Schweigert
4.87 (30)
ŞU ANDA %20 INDIRIMLI! Herhangi bir Acemi veya Uzman Tüccar için En İyi Çözüm! Bu Gösterge, Egzotik Çiftler Emtialar, Endeksler veya Vadeli İşlemler gibi herhangi bir sembol için para birimi gücünü göstermek için uzmanlaşmıştır. Türünün ilk örneğidir, Altın, Gümüş, Petrol, DAX, US30, MXN, TRY, CNH vb. gerçek para birimi gücünü göstermek için 9. satıra herhangi bir sembol eklenebilir. Bu benzersiz, yüksek kaliteli ve uygun fiyatlı bir ticaret aracıdır çünkü bir dizi tescilli özelliği ve yeni
Fiyat tersine döndükçe ve geri çekildikçe piyasa yapısından elde edilen kâr değişir. Piyasa yapısını tersine çevirme uyarısı göstergesi, bir trendin veya fiyat hareketinin ne zaman tükenmeye yaklaştığını ve tersine dönmeye hazır olduğunu tanımlar. Genellikle bir geri dönüş veya büyük bir geri çekilme meydana gelmek üzereyken meydana gelen piyasa yapısındaki değişiklikler konusunda sizi uyarır. Gösterge, olası bir tükenme noktasının yakınında her yeni yüksek veya düşük oluştuğunda, başlangıçta
Enigmera
Ivan Stefanov
5 (3)
ENIGMERA: Pazarın çekirdeği https://www.enigmera.com Giriş Bu gösterge ve ticaret sistemi, finansal piyasalar için dikkate değer bir yaklaşımdır. ENIGMERA, destek ve direnç seviyelerini doğru bir şekilde hesaplamak için fraktal döngüleri kullanır. Gerçek birikim aşamasını gösterir ve yön ve hedefler verir.  İster bir trendde ister bir düzeltmede olalım çalışan bir sistem.  Nasıl çalışır? ENIGMERA üç çizgiden oluşur: destek/direnç çizgisi, hedef çizgisi ve sapma çizgisi. Sistem, geçmiş veril
Stratos Pali
Michela Russo
5 (1)
Stratos Pali Indicator   is a revolutionary tool designed to enhance your trading strategy by accurately identifying market trends. This sophisticated indicator uses a unique algorithm to generate a complete histogram, which records when the trend is Long or Short. When a trend reversal occurs, an arrow appears, indicating the new direction of the trend. Important Information Revealed Leave a review and contact me via mql5 message to receive My Top 5 set files for Stratos Pali at no cost! D
Bu gösterge panosu, piyasa yapısını tersine çevirme göstergesiyle kullanım için bir uyarı aracıdır. Birincil amacı, belirli zaman dilimlerinde geri dönüş fırsatları ve ayrıca göstergenin yaptığı gibi uyarıların yeniden test edilmesi (onay) konusunda sizi uyarmaktır. Pano, kendi başına bir grafik üzerinde oturacak ve seçtiğiniz çiftler ve zaman dilimlerinde size uyarılar göndermek için arka planda çalışacak şekilde tasarlanmıştır. Piyasa tersine çevrilme göstergesinin tek bir MT4'te birden fazla
MetaBands M4
Vahidreza Heidar Gholami
5 (2)
MetaBands uses powerful and unique algorithms to draw channels and detect trends so that it can provide traders with potential points for entering and exiting trades. It’s a channel indicator plus a powerful trend indicator. It includes different types of channels which can be merged to create new channels simply by using the input parameters. MetaBands uses all types of alerts to notify users about market events. Features Supports most of the channel algorithms Powerful trend detection algorith
ŞU ANDA %26 INDIRIMLI Yeni Başlayanlar veya Uzman Tüccarlar için En İyi Çözüm! Bu Gösterge benzersiz, yüksek kaliteli ve uygun fiyatlı bir ticaret aracıdır çünkü bir dizi tescilli özellik ve yeni bir formül ekledik. Sadece BİR grafik ile 28 Forex çifti için Döviz Gücünü okuyabilirsiniz! Yeni bir trendin veya scalping fırsatının tam tetik noktasını belirleyebildiğiniz için ticaretinizin nasıl gelişeceğini hayal edin? Kullanım kılavuzu: buraya tıklayın Bu ilk olan, orijinal! Değersiz bir
Trend Pulse
Mohamed Hassan
5 (4)
Please contact me after purchase to immediately get your PDF strategy + documentation for Trend Pulse !  Introducing Trend Pulse , a unique and robust indicator capable of detecting bullish, bearish, and even ranging trends! Trend Pulse uses a special algorithm to filter out market noise with real precision. If the current symbol is moving sideways, Trend Pulse will send you a ranging signal, letting you know that it's not a good time to enter a trade. This excellent system makes Trend Pulse
ICT, SMC, SMART MONEY CONCEPTS, SMART MONEY, Smart Money Concept, Support and Resistance, Trend Analysis, Price Action, Market Structure, Order Blocks, BOS/CHoCH,   Breaker Blocks ,  Momentum Shift,   Supply&Demand Zone/Order Blocks , Strong Imbalance, HH/LL/HL/LH,    Fair Value Gap, FVG,  Premium  &   Discount   Zones, Fibonacci Retracement, OTE, Buy Side Liquidity, Sell Side Liquidity, BSL/SSL Taken, Equal Highs & Lows, MTF Dashboard, Multiple Time Frame, BigBar, HTF OB, HTF Market Structure, 
PRO Renko Sistemi, RENKO grafikleri ticareti için özel olarak tasarlanmış son derece hassas bir ticaret sistemidir. Bu, çeşitli ticaret araçlarına uygulanabilen evrensel bir sistemdir. Sistemi etkin piyasa sana doğru ters sinyallerine erişim hakkı denilen ses nötralize eder. Göstergenin kullanımı çok kolaydır ve sinyal üretiminden sorumlu tek bir parametreye sahiptir. Aracı, seçtiğiniz herhangi bir ticaret aracına ve renko çubuğunun boyutuna kolayca uyarlayabilirsiniz. Yazılımımla karlı b
Shepherd Harmonic Pattern
Abdullah Alrai
4.65 (49)
Bu gösterge, manuel ve otomatik yöntemlerle çizilen harmonik desenleri algılar. Kullanım kılavuzuna şu bağlantıdan erişebilirsiniz: İncelemenizi ekleyin ve ürünü almak için bizimle iletişime geçin. Bu ürünü mt4'te denemek için ücretsiz bir sürümü vardır. Gartley ve Nenstar desenlerini algılamak için kullanabilirsiniz: https://www.mql5.com/en/market/product/30181 Tam MT4 sürümünü şuradan satın alabilirsiniz: https://www.mql5.com/en/market/product/15212 Notlar Gösterge kontrol paneline sahiptir ve
Scalper Vault
Oleg Rodin
5 (27)
Scalper Vault , başarılı bir scalping için ihtiyacınız olan her şeyi size sağlayan profesyonel bir scalping sistemidir. Bu gösterge, forex ve ikili opsiyon tüccarları tarafından kullanılabilecek eksiksiz bir ticaret sistemidir. Önerilen zaman çerçevesi M5'tir. Sistem size trend yönünde doğru ok sinyalleri sağlar. Ayrıca size üst ve alt sinyaller ve Gann piyasa seviyeleri sağlar. Göstergeler, PUSH bildirimleri dahil her türlü uyarıyı sağlar. Göstergeyi satın aldıktan sonra lütfen benimle iletişim
Tanıtım       Kuantum Trend Keskin Nişancı Göstergesi   , trend tersine dönmeleri belirleme ve ticaret yapma şeklinizi değiştiren çığır açan MQL5 Göstergesi! 13 yılı aşkın ticaret tecrübesine sahip deneyimli tüccarlardan oluşan bir ekip tarafından geliştirilmiştir.       Kuantum Trend Keskin Nişancı Göstergesi       trend dönüşlerini son derece yüksek doğrulukla belirlemenin yenilikçi yolu ile ticaret yolculuğunuzu yeni zirvelere taşımak için tasarlanmıştır. ***Kuantum Trend Keskin Nişancı Gö
Apollo BuySell Predictor , birkaç ticaret modülü içeren profesyonel bir ticaret sistemidir. Bir tüccara benzersiz kırılma bölgeleri, fibonacci tabanlı destek ve direnç seviyeleri, pivot trend çizgisi, geri çekilme hacmi sinyalleri ve herhangi bir tüccarın günlük olarak ihtiyaç duyduğu diğer yararlı özellikleri sağlar. Sistem herhangi bir çift ile çalışacaktır. Önerilen zaman dilimleri M30, H1, H4'tür. Gösterge, H4'ten daha yüksek zaman dilimleri dışında diğer zaman dilimleriyle de çalışabilir. B
Yazarın diğer ürünleri
Boom and Crash Trend Detector is a  Non-Repaint   MT5 trading system usually being sold for 50 0$ . Most people use this for Deriv but can be used to forex too. The boom and crash spike indicator is a spike detecting software, with Multiple features, these features include. Spike Alert ( from 10 to 100-second warning before spike) Continues spike Alert (for double or continuous spikes at a time) supports all Boom/crash Indices M6 time frame works best here . Bigger time frame trend pointer f
This EA is specifically for Volatility and Step Index . which are famous as ( BOOM & CRASH markets) . This Ea have several inputs that i though should be talk upon ->   equity_profit_ = 20;   // Restart the EA after this $ profit   equity_loss_ = 20;    // Restart the EA after this $ Loss   EA_close_Minutes_dollor_profit = 0;   // This much minutes to stop EA after profit   EA_close_Minutes_dollor_loss = 0;  // This much minutes to stop EA after Loss  Buy_trade = true; Sell_trade = tr
This EA Can work on any pair and make grids .  Is consistent in working and make comfortable trades. This have SL and TP well defined and Approx amount you need to out a trade too. For any information you can contract the developer .  Please try once and let me know the reviews. this will show how many trades are Open for BUY and SELL at a time and How much PL you are at right now .   
Filtrele:
İnceleme yok
İncelemeye yanıt