SL Sniper
- Göstergeler
- Chalin Saranga Jayathilake
- Sürüm: 1.0
- Etkinleştirmeler: 5
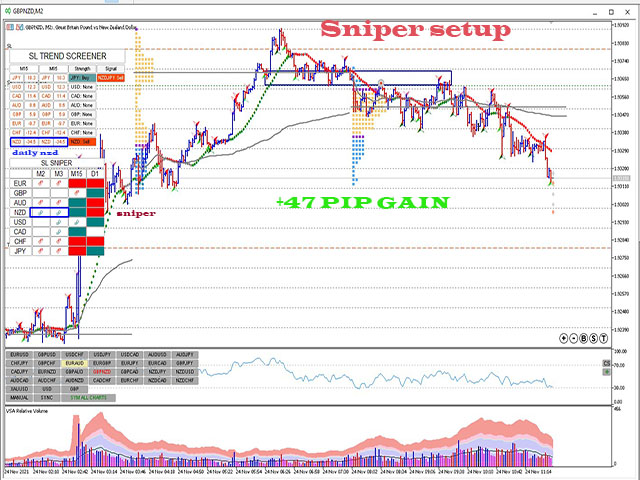
SL Sniper I coded. to trade with the trap system of the main market with vsa for more information and you want vsa system please pm me
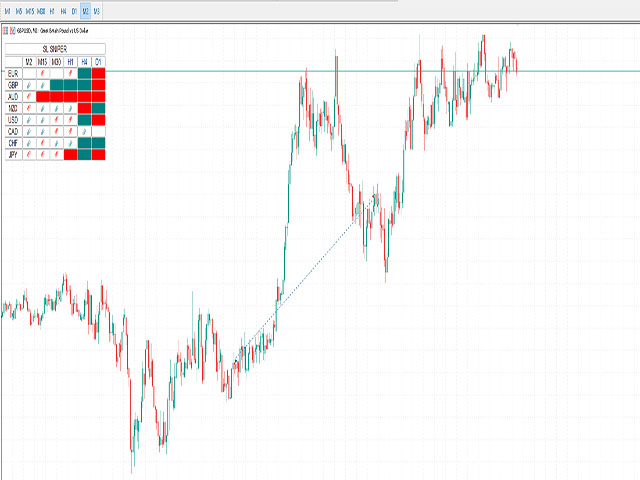
Suggested timeframes to trading :M1- M2- M3- M5 - M15-M30 -H1
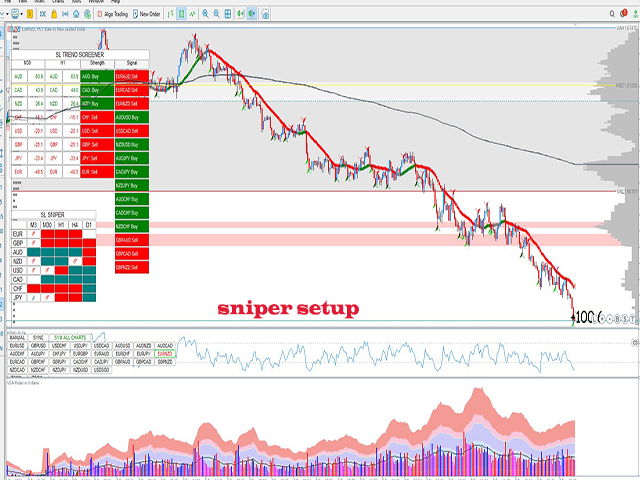
Wait london and newyork markert open after wait best then select the best strong index and weakest index by sniper
Histogram is indicated by one arrow at a time. The signal in the end direction of weak and strong
All red and green mean trending index,natural market is displayed only in white
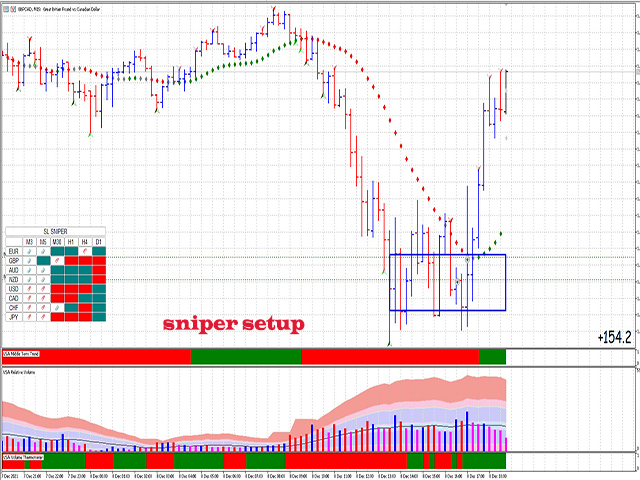
SL Sniper Indicator can be used for short term long and scalping. It is better to confirm entry signals with high low price action
Currency is gaining strength and the other is losing strength.(up down arrow symbol possible trending it symbol)
Filter sniper signal and volume price action road is clearTake chart 1m and chart 5m and trade low risk