MarketMonitor
- Göstergeler
- Vasyl Temchenko
- Sürüm: 1.0
- Etkinleştirmeler: 5
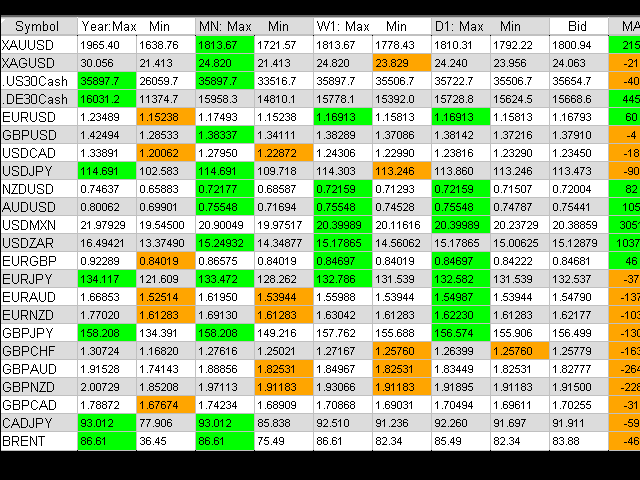
Uygulama, bir sayfada birkaç düzine çiftten gelen verileri görüntüler. Bu, alım satım için gelecek vaat eden çiftleri hızlı bir şekilde belirlemenizi sağlar.
Onlarca grafiği açıp analiz etmeye gerek yok, sadece 3-4-5 çizelgeleri ve tam olarak analiz edilmesi gerekenleri açacaksınız.
"Yorumlar" tam boy resme bakın.
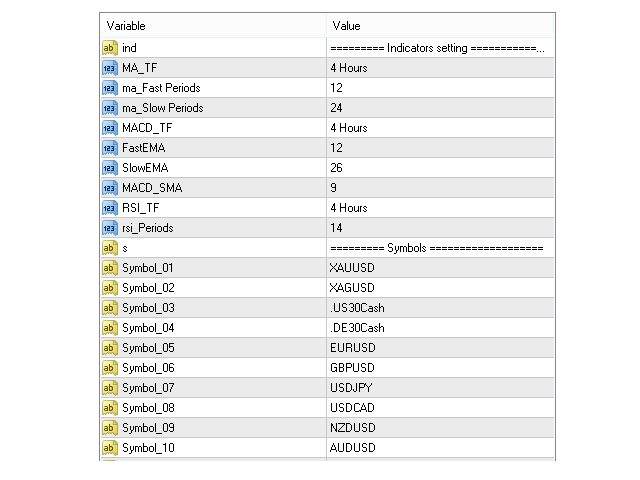
Menü 1 ila 30 sembol arasında ayarlanabilir. Bu yeterli değilse, grafik arayüz üzerinden sınırsız sayıda ekleyebilirsiniz. Orada gereksiz çiftleri de silebilirsiniz.
GUI ayrıca yerleşik göstergelerin eğilim ayarlarını değiştirmenize de olanak tanır.
Gösterge maksimum ve minimum gün, hafta, ay, yıl bulur. Tablo maksimum / minimum değerleri gösterir. "Maksimum-minimum" genlik, her dönem için araç ipucunda görüntülenir.
Fiyat maksimum veya minimuma yaklaşırsa, ilgili hücre renk değiştirir. Maksimum Kireç ise, minimum Turuncu ise.
En yüksek / en düşük, aynı zamanda tabloda gösterilen mevcut fiyatla da karşılaştırılabilir.
Uygulamada yerleşik 3 gösterge vardır: MA-Cross, MACD, RSI.
Tablo, göstergelerin mevcut değerlerini gösterir ve ayrıca trend yönü renkle gösterilir.
Göstergelerin temel ayarları menüde belirlenir, tümü GUI aracılığıyla değiştirilebilir.
GUI'nin altındaki kalın yeşil çizgiye çift tıklamak uygulama menüsünü açar.
Giriş parametreleri
MA_TF ... ... ... rsi_Periods - Göstergeler giriş parametreleri.
Symbol_01 ... Symbol_30, gözlemlemek istediğiniz çiftlerin isimleridir. Adlar tam olarak Piyasa İzleme sekmesinde göründükleri gibi girilmelidir. Kasa, noktalar, tireler önemlidir.