Pivots
- Göstergeler
- Paul Geirnaerdt
- Sürüm: 1.1
- Güncellendi: 17 Kasım 2021
- Etkinleştirmeler: 8
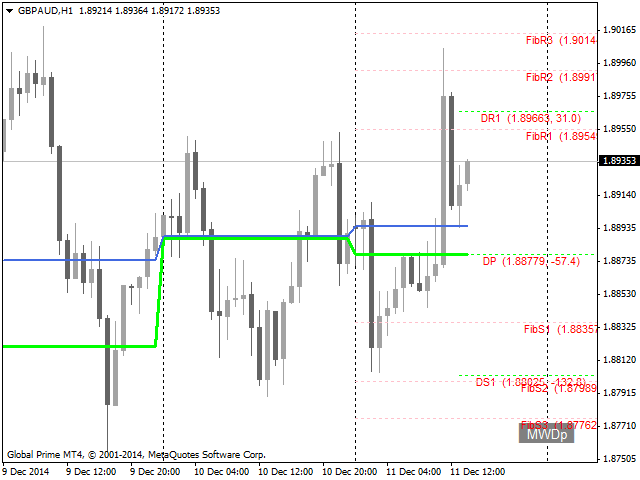
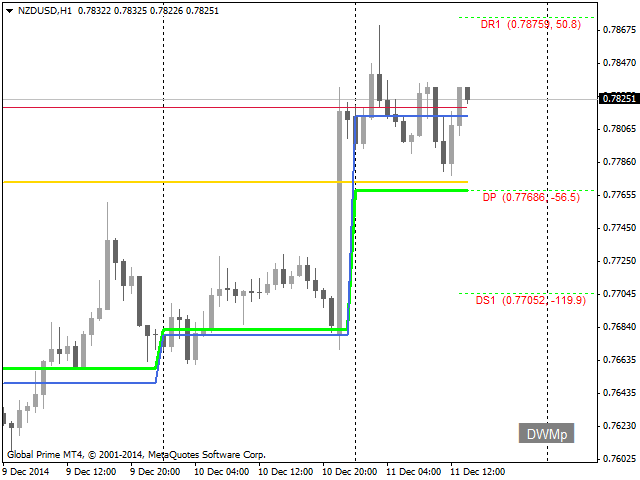
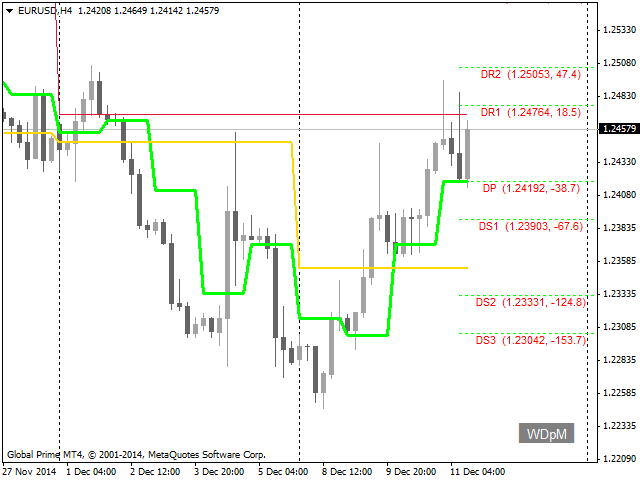
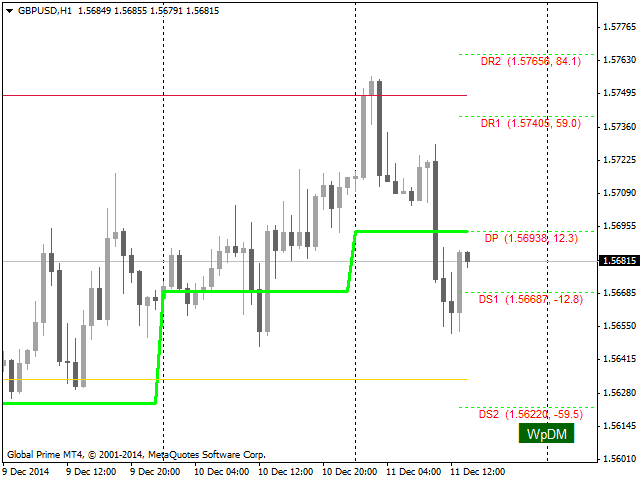
Pivots is an indicator to show pivots for relevant time frames. Besides the pivots the indicator can also show daly open line, the resistance and support levels, the ADR Fibonacci levels and the order of the pivots.
Pivots includes an intelligent algorithm to eliminate Sunday candles, but only if your broker provides those.
Settings
- textFont - font to use for the labels.
- textSize - font size.
- textColor - you know what to do.
- maxBars - the number of candles Pivots shows information for, decrease if necessary.
- addSundayToMonday - set to true to add Sunday candles, if any, to the following Monday candle, useful for D1 only.
- showDailyLine - set to true to show the daily pivot.
- showDailyOpenLine - set to true to show the daily open line.
- showWeekLine - set to true to show the weekly pivot.
- showMonthLine - set to true to show the monthly pivot.
- showDailySR - set to true to show the daily pivot support & resistance lines.
- showDailyOpenSR - set to true to show the daily open support & resistance lines.
- showWeeklySR - set to true to show the weekly pivot support & resistance lines.
- showMonthlySR - set to true to show the monthly pivot support & resistance lines.
- showSRAtOwnBar - set to true to start the support & resistance line at the close of the pivot candle.
- showFibonacci - set to true to show the Fibonacci levels based on the daily ADR.
- includeDistance - set to true to include the distance to price in the labels.
- includeValue - set to true to include the value of the level in its label.
- shiftText... - number of pixels to shift labels to the right.
- showOrder - set to true to show the order of the main pivots (D, W, M) and price (P).
- showOrderBackground - set to true to show a background to the order.
- orderX - X number of pixels of the order from the bottom right corner.
- orderY - Y number of pixels of the order from the bottom right corner.
- style... - pick your favorite line style.
- width... - set line widths.
- color... - choose your favorite.
If in doubt, start with the default options.
Loose Ends
If you run in any problems, try to load some history for all your symbols before dropping Pivots on your chart.





Kullanıcı incelemeye herhangi bir yorum bırakmadı