Top and bottom patterns
- Göstergeler
- Alexander Nikolaev
- Sürüm: 1.3
- Güncellendi: 29 Eylül 2021
- Etkinleştirmeler: 10
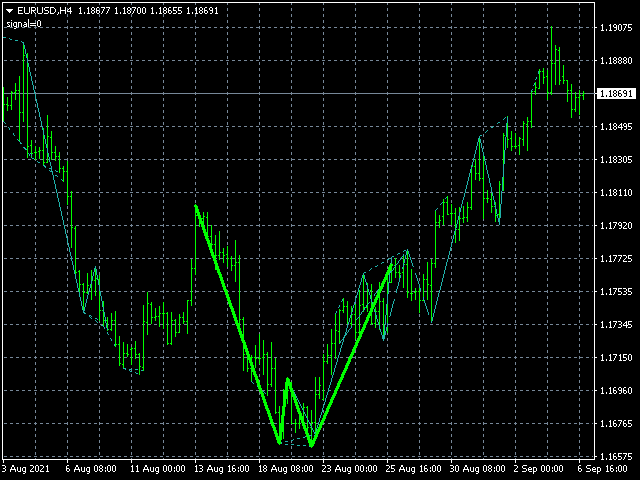
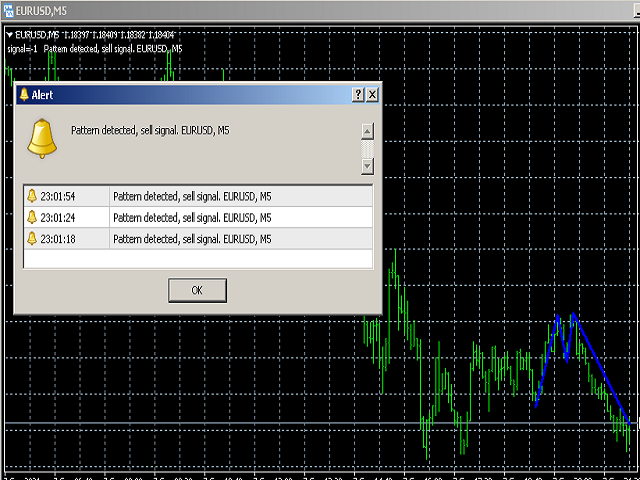
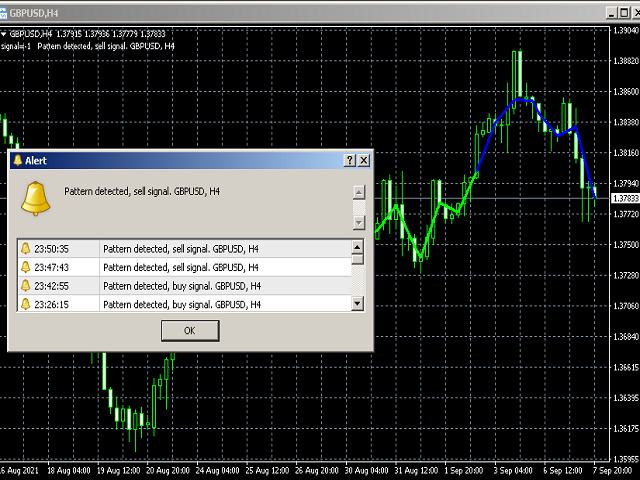
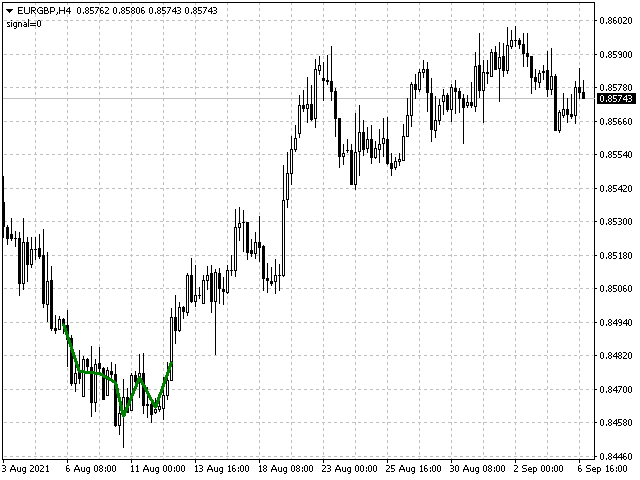
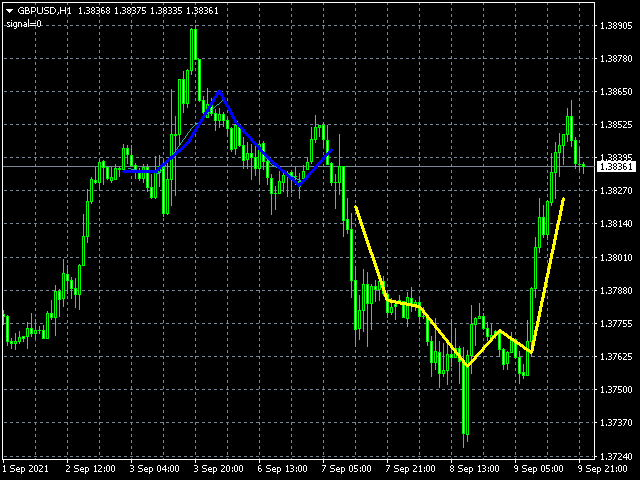
This indicator finds technical analysis reversal patterns such as Double Bottom, Triple Bottom, Head & Shoulders and their opposite counterparts. The indicator shows them on the chart of a currency pair and can signal a trader if a pattern has been formed recently. This allows you to quickly detect a possible trend reversal or correction, it is enough to add an indicator to the chart, after that, you can change different timeframes to quickly find such patterns, if the patterns are not located or, on the contrary, are not located in the best places in history, you can change the parameters for better display for a certain currency pair. Also, you can change the color of the lines of the displayed patterns and enable the display of lines of not fully formed patterns.
Options
- History - the number of bars to search for patterns on the chart;
- ExtremCountBars - The number of bars to search for extremums, for example, highs at the 2nd peak (3-40 is recommended);
- MinExtremDist - The minimum number of bars between 2 extremums (2-12 is recommended, the larger the value, the larger the size of the found pattern);
- MaxExtremDist - Maximum number of bars between 2 extremums (10-50 is recommended);
- MultipleVerticesFilter - Filtering to find "extra" highs or lows (if enabled, there should be only 2 tops or bottoms);
- PeriodMAforEdgeFiltering - Filtering the edges of the double bottom and top shapes by MA so that there is a smooth rise or fall (0 - off, 0-10 is recommended);
- PriceDeviationsParam - The maximum price deviation (depending on the volatility) of a currency pair of two extremes (the larger this value, the more the figure may turn out to be a curve, but it will be found more often);
- PriceChangeBefore - How much the value of the price change before the pattern should be less than the size of the pattern itself (recommended from 1 to 2.5);
- MaxPriceStrengthAfterPattern - A parameter for increasing (and decreasing) the maximum price divergence from the pattern (for example, 1.5 = 1.5 times the pattern size);
- SelfTuningParametersCount - The number of attempts to auto-tuning parameters (how many times the parameter values can be changed to search for at least 1 figure, it is recommended 0-10, 0 - auto-tuning of parameters is disabled);
- PeriodMAforHeadS - The period of the moving average for drawing the "Head and Shoulders" figure (and the inverted version), 0 - the pattern is off, 2-10 is recommended (the higher the value, the larger the size of the found pattern can be);
- DrawUnfinishedPatterns - Draw unfinished patterns (lines on the chart that show that a pattern could have been formed);
- EnableAlert - enable alerts when a pattern appears and breaks out;
- AlertPeriodBars - The number of bars after which the alert can appear again;
- MaximumFigureShiftForAlert - Maximum distance of the figure from the current bar for the alert to appear;
- NeutralLinesClr - Color of neutral lines (shown when the DrawUnfinishedPatterns parameter is enabled);
- FinalBuyPatternClr - Line color of the completed buy shape;
- FinalSellPatternClr - Line color of the completed sell shape.
